EXTJS lineChart折线图

JSON文件


Line chart绑定store

拖入一个Line chart并绑定store(设置好url和fileds)
sencha architect自动生成的代码:
store:
Ext.define('MyApp10.store.data2', {
    extend: 'Ext.data.Store',

    requires: [
        'Ext.data.proxy.Ajax',
        'Ext.data.reader.Json',
        'Ext.data.Field'
    ],

    constructor: function(cfg) {
        var me = this;
        cfg = cfg || {};
        me.callParent([Ext.apply({
            autoLoad: true,
            autoSync: true,
            storeId: 'data2',
            proxy: {
                type: 'ajax',
                url: 'data/chart/data2.json',
                reader: {
                    type: 'json'
                }
            },
            fields: [
                {
                    name: 'name'
                },
                {
                    name: 'data1'
                },
                {
                    name: 'data2'
                },
                {
                    name: 'data3'
                }
            ]
        }, cfg)]);
    }
});

设置属性

line chart属性:

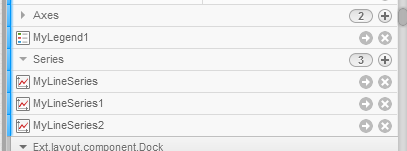
添加一个legend和三个series:

axes属性:

Category    fields:name    title:名称
Numeric      fields:data1,data2,data3,    title:数据    编辑grid属性:
grid: {
                                        odd: {
                                            opacity: 1,
                                            fill: '#ddd',
                                            stroke: '#bbb',
                                            'stroke-width': 0.5
                                        }
                                    },

series属性:

直接贴代码了:
series: [
                                {
                                    type: 'line',
                                    highlight: {
                                        size: 7,
                                        radius: 7
                                    },
                                    xField: 'name',
                                    yField: 'data1',
                                    markerConfig: {
                                        type: 'cross',
                                        size: 4,
                                        radius: 4,
                                        'stroke-width': 0
                                    },
                                    smooth: 3
                                },
                                {
                                    type: 'line',
                                    highlight: {
                                        size: 7,
                                        radius: 7
                                    },
                                    xField: 'name',
                                    yField: 'data2',
                                    markerConfig: {
                                        type: 'circle',
                                        size: 4,
                                        radius: 4,
                                        'stroke-width': 0
                                    },
                                    smooth: 3
                                },
                                {
                                    type: 'line',
                                    highlight: {
                                        size: 7,
                                        radius: 7
                                    },
                                    xField: 'name',
                                    yField: 'data3',
                                    fill: true,
                                    markerConfig: {
                                        type: 'circle',
                                        size: 4,
                                        radius: 4,
                                        'stroke-width': 0
                                    },
                                    smooth: 3
                                }
                            ],

全部代码

{
                    xtype: 'panel',
                    id: 'linechart_tab',
                    title: 'LineChart',
                    items: [
                        {
                            xtype: 'chart',
                            height: 477,
                            id: 'linechart',
                            width: 789,
                            animate: true,
                            insetPadding: 20,
                            store: 'data2',
                            theme: 'Category1',
                            axes: [
                                {
                                    type: 'Category',
                                    fields: [
                                        'name'
                                    ],
                                    title: '名称',
                                    position: 'bottom'
                                },
                                {
                                    type: 'Numeric',
                                    fields: [
                                        'data1',
                                        'data2',
                                        'data3'
                                    ],
                                    grid: {
                                        odd: {
                                            opacity: 1,
                                            fill: '#ddd',
                                            stroke: '#bbb',
                                            'stroke-width': 0.5
                                        }
                                    },
                                    title: '数据',
                                    position: 'left'
                                }
                            ],
                            series: [
                                {
                                    type: 'line',
                                    highlight: {
                                        size: 7,
                                        radius: 7
                                    },
                                    xField: 'name',
                                    yField: 'data1',
                                    markerConfig: {
                                        type: 'cross',
                                        size: 4,
                                        radius: 4,
                                        'stroke-width': 0
                                    },
                                    smooth: 3
                                },
                                {
                                    type: 'line',
                                    highlight: {
                                        size: 7,
                                        radius: 7
                                    },
                                    xField: 'name',
                                    yField: 'data2',
                                    markerConfig: {
                                        type: 'circle',
                                        size: 4,
                                        radius: 4,
                                        'stroke-width': 0
                                    },
                                    smooth: 3
                                },
                                {
                                    type: 'line',
                                    highlight: {
                                        size: 7,
                                        radius: 7
                                    },
                                    xField: 'name',
                                    yField: 'data3',
                                    fill: true,
                                    markerConfig: {
                                        type: 'circle',
                                        size: 4,
                                        radius: 4,
                                        'stroke-width': 0
                                    },
                                    smooth: 3
                                }
                            ],
                            legend: {
                                position: 'right'
                            }
                        }
                    ]
                },

预览效果


  • 1
    点赞
  • 1
    收藏
    觉得还不错? 一键收藏
  • 8
    评论
评论 8
添加红包

请填写红包祝福语或标题

红包个数最小为10个

红包金额最低5元

当前余额3.43前往充值 >
需支付:10.00
成就一亿技术人!
领取后你会自动成为博主和红包主的粉丝 规则
hope_wisdom
发出的红包
实付
使用余额支付
点击重新获取
扫码支付
钱包余额 0

抵扣说明:

1.余额是钱包充值的虚拟货币,按照1:1的比例进行支付金额的抵扣。
2.余额无法直接购买下载,可以购买VIP、付费专栏及课程。

余额充值