


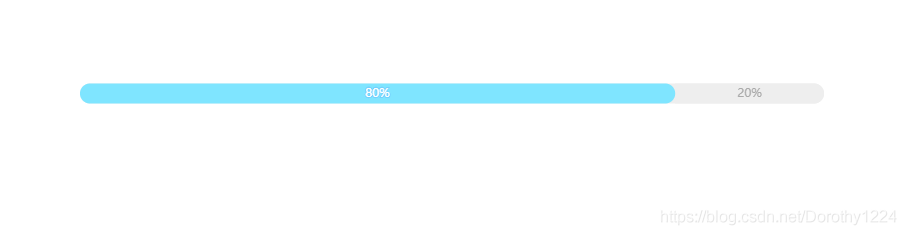
echarts 百分比进度条如下图两种,下面代码是第二张图的,第一个的稍加修改label值即可

直接上代码:
<div id="main" style="width: 180px;height:30px;"></div>
<script>
var myChart = echarts.init(document.getElementById('main'));
var option = {
    grid: {
        top: 5,
        bottom: 5,
        left: 5,
        right: 50
    },
    title: {
        text: percent + '%',
        right: 0,
        top: 'middle',
        textStyle: {
            fontWeight: 500,
            fontSize: 12
        }
    },
    color: ['#74d1fd', '#eee'],
    xAxis: {
        show:false,
        type : 'value',
        boundaryGap : [0, 0]
    },
    yAxis: [
        {
            type : 'category',
            data : [''],
            axisLine:{show:false},
            axisTick:[{
                show:false
            }]
        }
    ],
    series: [
        {
            type: 'bar',
            name: '已完成',
            stack: '总量',
            barMaxWidth: 20,
            label: {
                show: false,
                position: 'inside',
                formatter: '{c}%'
            },
            itemStyle: {
                barBorderRadius: [10, 10, 10, 10]
            },
            data: [37.5]
        },
        {
            type: 'bar',
            name: '未完成',
            stack: '总量',
            barMaxWidth: 20,
            label: {
                show: false,
                color: '#aaa',
                position: 'inside' ,
                formatter: '{c}%'
            },
            showBackground: true,
            backgroundStyle: {
                color: '#eee',
                barBorderRadius: [10,10,10,10]
            },
            itemStyle: {
                color: '#eee',
                barBorderRadius: [0, 10, 10, 0],
            },
            silent:true,
            data: [62.5]
        }
    ]
};
myChart.setOption(option);
</script>
注:如果进度条样式不对,可能是echarts版本的问题。
如上demo使用的是4.3.2版本的。


 179
179


 被折叠的 条评论
为什么被折叠?
被折叠的 条评论
为什么被折叠?
 到【灌水乐园】发言


