


Getting started with CUDA - An Even Easier Introduction to CUDA
1. Start Simple
Traditional C++ program
A simple C++ program that adds the elements of two arrays with a million elements each. add.cpp
#include <iostream>
#include <math.h>

// function to add the elements of two arrays
void add(int n, float *x, float *y)
{
  for (int i = 0; i < n; i++)
      y[i] = x[i] + y[i];
}

int main(void)
{
  int N = 1<<20; // 1M elements

  float *x = new float[N];
  float *y = new float[N];

  // initialize x and y arrays on the host
  for (int i = 0; i < N; i++) {
    x[i] = 1.0f;
    y[i] = 2.0f;
  }

  // Run kernel on 1M elements on the CPU
  add(N, x, y);

  // Check for errors (all values should be 3.0f)
  float maxError = 0.0f;
  for (int i = 0; i < N; i++)
    maxError = fmax(maxError, fabs(y[i]-3.0f));
  std::cout << "Max error: " << maxError << std::endl;

  // Free memory
  delete [] x;
  delete [] y;

  return 0;
}
Then compile and run the program.
g++ add.cpp -o add
time ./add
root@679ef0756dc1:/home# time ./add
Max error: 0

real	0m0.043s
user	0m0.027s
sys	0m0.009s
CUDA program - version 1
Change the traditional program into CUDA program add.cu. In this program, we just used one thread of the GPU.
#include <iostream>
#include <math.h>
// Kernel function to add the elements of two arrays
__global__
void add(int n, float *x, float *y)
{
  for (int i = 0; i < n; i++)
    y[i] = x[i] + y[i];
}

int main(void)
{
  int N = 1<<20;
  float *x, *y;

  // Allocate Unified Memory – accessible from CPU or GPU
  cudaMallocManaged(&x, N*sizeof(float));
  cudaMallocManaged(&y, N*sizeof(float));

  // initialize x and y arrays on the host
  for (int i = 0; i < N; i++) {
    x[i] = 1.0f;
    y[i] = 2.0f;
  }

  // Run kernel on 1M elements on the GPU
  add<<<1, 1>>>(N, x, y);

  // Wait for GPU to finish before accessing on host
  cudaDeviceSynchronize();

  // Check for errors (all values should be 3.0f)
  float maxError = 0.0f;
  for (int i = 0; i < N; i++)
    maxError = fmax(maxError, fabs(y[i]-3.0f));
  std::cout << "Max error: " << maxError << std::endl;

  // Free memory
  cudaFree(x);
  cudaFree(y);

  return 0;
}
Compile and run :
nvcc add.cu -o add-cuda
nvprof ./add-cuda
root@679ef0756dc1:/home# nvprof ./add-cuda
==65== NVPROF is profiling process 65, command: ./add-cuda
Max error: 0
==65== Profiling application: ./add-cuda
==65== Profiling result:
            Type  Time(%)      Time     Calls       Avg       Min       Max  Name
 GPU activities:  100.00%  215.26ms         1  215.26ms  215.26ms  215.26ms  add(int, float*, float*)
      API calls:   56.59%  215.28ms         1  215.28ms  215.28ms  215.28ms  cudaDeviceSynchronize
                   42.42%  161.38ms         2  80.691ms  765.61us  160.62ms  cudaMallocManaged
                    0.48%  1.8181ms         1  1.8181ms  1.8181ms  1.8181ms  cudaLaunchKernel
                    0.23%  862.98us         2  431.49us  386.21us  476.77us  cudaFree
                    0.22%  842.51us        96  8.7760us     198ns  386.68us  cuDeviceGetAttribute
                    0.03%  124.16us         1  124.16us  124.16us  124.16us  cuDeviceTotalMem
                    0.02%  90.258us         1  90.258us  90.258us  90.258us  cuDeviceGetName
                    0.00%  3.8090us         1  3.8090us  3.8090us  3.8090us  cuDeviceGetPCIBusId
                    0.00%  2.1580us         3     719ns     204ns  1.6460us  cuDeviceGetCount
                    0.00%  1.1320us         2     566ns     235ns     897ns  cuDeviceGet
                    0.00%     365ns         1     365ns     365ns     365ns  cuDeviceGetUuid

==65== Unified Memory profiling result:
Device "GeForce GTX 950M (0)"
   Count  Avg Size  Min Size  Max Size  Total Size  Total Time  Name
       6  1.3333MB  256.00KB  2.0000MB  8.000000MB  1.371168ms  Host To Device
      90  136.53KB  4.0000KB  0.9961MB  12.00000MB  1.992256ms  Device To Host
Total CPU Page faults: 45
CUDA program - version 2
Picking up the Threads**
Now that you’ve run a kernel with one thread that does some computation, how do you make it parallel? The key is in CUDA’s <<<1, 1>>> syntax. This is called the execution configuration, and it tells the CUDA runtime how many parallel threads to use for the launch on the GPU. There are two parameters here, The first represent the number of thread blocks, and the second represent the the number of threads in the block. Let’s start by changing the second one: the number of threads in a thread block. CUDA GPUs run kernels using blocks of threads that are a multiple of 32 in size, so 256 threads is a reasonable size to choose.
add<<<1,256>>>(N, x, y);
The things we have to do is to change the kernel function.
__global__
void add(int n, float *x, float *y)
{
  int index = threadIdx.x;	// threaddIdex.x represent the index of the current thread within its block
  int stride = blockDim.x;	// blockDim.x represents the number of threads in the block
  for (int i = index; i < n; i += stride)
      y[i] = x[i] + y[i];
}
In this kernel function, threaddIdex.x represent the index of the current thread within its block and blockDim.x represents the number of threads in the block. If we change the threaddIdex.x to 0 and blockDim.x to 1, then the program is the same as version 1.
The whole program is add2.cu
#include <iostream>
#include <math.h>
// Kernel function to add the elements of two arrays
__global__
void add(int n, float *x, float *y)
{
  int index=threadIdx.x;
  int stride=blockDim.x;
  for (int i = index; i < n; i+=stride)
    y[i] = x[i] + y[i];
}

int main(void)
{
  int N = 1<<20;
  float *x, *y;

  // Allocate Unified Memory – accessible from CPU or GPU
  cudaMallocManaged(&x, N*sizeof(float));
  cudaMallocManaged(&y, N*sizeof(float));

  // initialize x and y arrays on the host
  for (int i = 0; i < N; i++) {
    x[i] = 1.0f;
    y[i] = 2.0f;
  }

  // Run kernel on 1M elements on the GPU
  add<<<1, 256>>>(N, x, y);

  // Wait for GPU to finish before accessing on host
  cudaDeviceSynchronize();

  // Check for errors (all values should be 3.0f)
  float maxError = 0.0f;
  for (int i = 0; i < N; i++)
    maxError = fmax(maxError, fabs(y[i]-3.0f));
  std::cout << "Max error: " << maxError << std::endl;

  // Free memory
  cudaFree(x);
  cudaFree(y);

  return 0;
}
Compile and run it:
nvcc add2.cu -o add-cuda2
nvprof ./add-cuda2
==205== NVPROF is profiling process 205, command: ./add-cuda2
Max error: 0
==205== Profiling application: ./add-cuda2
==205== Profiling result:
            Type  Time(%)      Time     Calls       Avg       Min       Max  Name
 GPU activities:  100.00%  2.1227ms         1  2.1227ms  2.1227ms  2.1227ms  add(int, float*, float*)
      API calls:   96.06%  137.54ms         2  68.772ms  785.70us  136.76ms  cudaMallocManaged
                    1.49%  2.1320ms         1  2.1320ms  2.1320ms  2.1320ms  cudaDeviceSynchronize
                    1.23%  1.7577ms         1  1.7577ms  1.7577ms  1.7577ms  cudaLaunchKernel
                    0.62%  891.10us         2  445.55us  430.50us  460.60us  cudaFree
                    0.48%  687.07us        96  7.1560us     157ns  322.94us  cuDeviceGetAttribute
                    0.07%  97.659us         1  97.659us  97.659us  97.659us  cuDeviceTotalMem
                    0.05%  72.485us         1  72.485us  72.485us  72.485us  cuDeviceGetName
                    0.00%  3.6910us         1  3.6910us  3.6910us  3.6910us  cuDeviceGetPCIBusId
                    0.00%  1.8140us         3     604ns     182ns  1.4290us  cuDeviceGetCount
                    0.00%     852ns         2     426ns     185ns     667ns  cuDeviceGet
                    0.00%     301ns         1     301ns     301ns     301ns  cuDeviceGetUuid

==205== Unified Memory profiling result:
Device "GeForce GTX 950M (0)"
   Count  Avg Size  Min Size  Max Size  Total Size  Total Time  Name
       6  1.3333MB  256.00KB  2.0000MB  8.000000MB  1.335552ms  Host To Device
      90  136.53KB  4.0000KB  0.9961MB  12.00000MB  1.978848ms  Device To Host
Total CPU Page faults: 45
As we can see, the speedup compare to version 1 is 101.41.
CUDA program - version 3
Out of the Blocks
- one GPU has many parallel processors grouped into Streaming Multiprocessors (SMs).
- one SM can run multiple concurrent threads.
A Tesla P100 GPU based on the Pascal GPU Architecture has 56 SMs, each capable of supporting up to 2048 active threads. To take full advantage of all these threads, I should launch the kernel with multiple thread blocks.
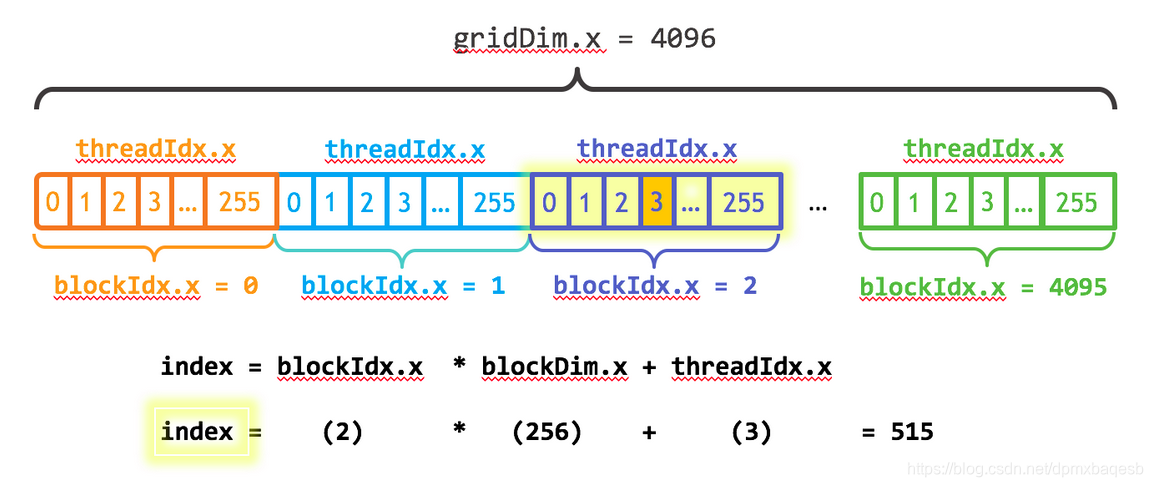
In this Figure, gridDim.x represents the number of blocks in a grid, blockIdx.x represent the index in the grid, blockDim.x represent the number of threads in each block.
The first parameter of the execution configuration specifies the number of thread blocks. Together, the blocks of parallel threads make up what is known as the grid. Since I have N elements to process, and 256 threads per block, I just need to calculate the number of blocks to get at least N threads. I simply divide N by the block size (being careful to round up in case N is not a multiple of blockSize).
int blockSize = 256;
int numBlocks = (N + blockSize - 1) / blockSize;
add<<<numBlocks, blockSize>>>(N, x, y);
After this, we need to change the kernel function.
__global__
void add(int n, float *x, float *y)
{
  int index = blockIdx.x * blockDim.x + threadIdx.x;
  int stride = blockDim.x * gridDim.x;
  for (int i = index; i < n; i += stride)
    y[i] = x[i] + y[i];
}
The whole program is add3.cu.
#include <iostream>
#include <math.h>
// Kernel function to add the elements of two arrays
__global__
void add(int n, float *x, float *y)
{
  int index=blockIdx.x*blockDim.x+threadIdx.x;
  int stride=blockDim.x*gridDim.x;
  for (int i = index; i < n; i+=stride)
    y[i] = x[i] + y[i];
}

int main(void)
{
  int N = 1<<20;
  float *x, *y;

  // Allocate Unified Memory – accessible from CPU or GPU
  cudaMallocManaged(&x, N*sizeof(float));
  cudaMallocManaged(&y, N*sizeof(float));

  // initialize x and y arrays on the host
  for (int i = 0; i < N; i++) {
    x[i] = 1.0f;
    y[i] = 2.0f;
  }

  // Run kernel on 1M elements on the GPU
  int blockSize=256;
  int numBlocks=(N+blockSize-1)/blockSize;
  add<<<numBlocks, blockSize>>>(N, x, y);

  // Wait for GPU to finish before accessing on host
  cudaDeviceSynchronize();

  // Check for errors (all values should be 3.0f)
  float maxError = 0.0f;
  for (int i = 0; i < N; i++)
    maxError = fmax(maxError, fabs(y[i]-3.0f));
  std::cout << "Max error: " << maxError << std::endl;

  // Free memory
  cudaFree(x);
  cudaFree(y);

  return 0;
}
Compile and run it:
nvcc add3.cu -o add-cuda3
nvprof ./add-cuda3
==292== NVPROF is profiling process 292, command: ./add-cuda3
Max error: 0
==292== Profiling application: ./add-cuda3
==292== Profiling result:
            Type  Time(%)      Time     Calls       Avg       Min       Max  Name
 GPU activities:  100.00%  418.24us         1  418.24us  418.24us  418.24us  add(int, float*, float*)
      API calls:   97.35%  174.22ms         2  87.110ms  841.72us  173.38ms  cudaMallocManaged
                    1.04%  1.8535ms         1  1.8535ms  1.8535ms  1.8535ms  cudaLaunchKernel
                    0.70%  1.2564ms        96  13.087us     521ns  571.73us  cuDeviceGetAttribute
                    0.45%  797.54us         2  398.77us  381.95us  415.59us  cudaFree
                    0.24%  426.83us         1  426.83us  426.83us  426.83us  cudaDeviceSynchronize
                    0.14%  247.58us         1  247.58us  247.58us  247.58us  cuDeviceTotalMem
                    0.08%  143.62us         1  143.62us  143.62us  143.62us  cuDeviceGetName
                    0.00%  4.9000us         3  1.6330us     508ns  3.6460us  cuDeviceGetCount
                    0.00%  4.6040us         1  4.6040us  4.6040us  4.6040us  cuDeviceGetPCIBusId
                    0.00%  2.6960us         2  1.3480us     519ns  2.1770us  cuDeviceGet
                    0.00%     805ns         1     805ns     805ns     805ns  cuDeviceGetUuid

==292== Unified Memory profiling result:
Device "GeForce GTX 950M (0)"
   Count  Avg Size  Min Size  Max Size  Total Size  Total Time  Name
       6  1.3333MB  256.00KB  2.0000MB  8.000000MB  1.352896ms  Host To Device
      90  136.53KB  4.0000KB  0.9961MB  12.00000MB  1.979296ms  Device To Host
Total CPU Page faults: 45
Compared to version 2, the speedup is 5.10. It’s not good as the parallel partition in this program count for not much. We can use the Linux perf tool to get it.


 795
795


 被折叠的 条评论
为什么被折叠?
被折叠的 条评论
为什么被折叠?
 到【灌水乐园】发言


