


Prometheus+Grafana+Alertmanager部署实现企业微信机器人告警
概要
Prometheus支持多操作系统部署,也可以通过docker、kubernetes等容器平台进行部署。
详情请移至官网查看:https://prometheus.io/download/
1.环境准备
- 节点
| Centos 7 | IP |
|---|---|
| prometheus & grafana &alertmanager | 192.168.50.a |
| prometheus node | 192.168.50.b |
- 软件包
Prometheus-2.45.1:https://github.com/prometheus/prometheus/releases/download/v2.45.1/prometheus-2.45.1.linux-amd64.tar.gz
node_exporter-1.6.1:https://github.com/prometheus/node_exporter/releases/download/v1.6.1/node_exporter-1.6.1.linux-amd64.tar.gz
Grafana-10.2.0:https://dl.grafana.com/enterprise/release/grafana-enterprise-10.2.0-1.x86_64.rpm
2.部署 prometheus(二进制)
安装
step 1.下载
wget https://github.com/prometheus/prometheus/releases/download/v2.45.1/prometheus-2.45.1.linux-amd64.tar.gz
step 2.部署
tar  -zxvf  prometheus-2.45.1.linux-amd64.tar.gz  -C   /opt/
cd   /opt/
mv  ./prometheus-2.45.1.linux-amd64   prometheus
step 3.验证
[root@prometheus prometheus]#  cd   /opt/prometheus
[root@prometheus prometheus]# ./prometheus  --version
prometheus, version 2.45.1 (branch: HEAD, revision: c62de5d1075d9c24a281b4b719f124f14e730fa5)
  build user:       root@827ead67e852
  build date:       20230929-21:10:51
  go version:       go1.20.8
  platform:         linux/amd64
  tags:             netgo,builtinassets,stringlabels
step 4.配置用户
groupadd  prometheus
useradd  -g  prometheus -s /sbin/nologin prometheus
修改安装目录权限
chown -R prometheus:prometheus /opt/prometheus/
创建prometheus运行数据目录
mkdir  -p  /opt/prometheus/data
chown -R prometheus:prometheus /opt/prometheus/data
配置文件
在prometheus监控系统,prometheus的职责是采集,查询和存储和推送报警到alertmanager。本文主要介绍下prometheus的配置文件。
-
配置文件格式
配置文件格式是yaml格式
官方文档说明: https://prometheus.io/docs/prometheus/latest/configuration/configuration/
.yml或者.yaml 都是 yaml格式的文件。
yaml格式json交互比较容易,python/go/java/php 有yaml格式库,方便语言之间解析,并且这种格式存储的信息量很大。
- 配置文件指标说明
[root@prometheus prometheus]# cat prometheus.yml
# my global config
global:
  scrape_interval: 15s # Set the scrape interval to every 15 seconds. Default is every 1 minute.
  evaluation_interval: 15s # Evaluate rules every 15 seconds. The default is every 1 minute.
  # scrape_timeout is set to the global default (10s).

# Alertmanager configuration
alerting:
  alertmanagers:
    - static_configs:
        - targets:
          # - alertmanager:9093

# Load rules once and periodically evaluate them according to the global 'evaluation_interval'.
rule_files:
  # - "first_rules.yml"
  # - "second_rules.yml"

# A scrape configuration containing exactly one endpoint to scrape:
# Here it's Prometheus itself.
scrape_configs:
  # The job name is added as a label `job=<job_name>` to any timeseries scraped from this config.
  - job_name: "prometheus"

    # metrics_path defaults to '/metrics'
    # scheme defaults to 'http'.

    static_configs:
      - targets: ["localhost:9090"]
global指标
# my global config
global:
   scrape_interval: 15s        # 默认15s 全局每次数据收集的间隔
   evaluation_interval: 15s    # 规则扫描时间间隔是15秒,默认不填写是 1分钟
   scrape_timeout: 5s          # 超时时间
   external_labels:            # 用于外部系统标签的,不是用于metrics(度量)数据
- 常用的命令行参数
./prometheus -h
  --config.file="/opt/prometheus/prometheus.yml"  # 读取指定配置文件
  --web.listen-address="0.0.0.0:9090"  # 指定prometheus运行端口
  --log.level=info # 日志级别
  --alertmanager.timeout=10s # 与报警组件的超时时间
alerting
# Alertmanager configuration
alerting:
  alertmanagers:
  - static_configs:
    - targets:
      # - alertmanager:9093
这里定义和prometheus集成的alertmanager插件,用于监控报警。后续会单独进行alertmanger插件的配置、配置说明、报警媒介以及route路由规则记录。
rule_files
这个主要是用来设置告警规则,基于设定什么指标进行报警(类似触发器trigger)。这里设定好规则以后,prometheus会根据全局global设定的evaluation_interval参数进行扫描加载,规则改动后会自动加载。其报警媒介和route路由由alertmanager插件实现。
# Load rules once and periodically evaluate them according to the global 'evaluation_interval'.
rule_files:
  # - "first_rules.yml"
  # - "second_rules.yml"
scrape_configs 配置采集目标 endpoints
scrape_configs 默认规则:
scrape_configs:
  # The job name is added as a label `job=` to any timeseries scraped from this config.
 - job_name: 'prometheus'

    # metrics_path defaults to '/metrics'
    # scheme defaults to 'http'.

    static_configs:
    - targets: ['localhost:9090']
支持的配置:
-
job_name:
任务目标名,可以理解成分组,每个分组包含具体的target组员。 -
scrape_interval: 5s
单独设定的话,会覆盖global设定的参数,拉取时间间隔为5s -
metrics_path
监控项访问的url路径 -
targets: Endpoint
监控目标访问地址
上述为静态规则,没有设置自动发现。这种情况下增加主机需要自行修改规则,通过supervisor reload 对应任务,也是缺点:每次静态规则添加都要重启prometheus服务,不利于运维自动化。
也可以通过热加载的方式进行。
prometheus支持服务发现:
基于文件的服务发现方式不需要依赖其他平台与第三方服务,用户只需将要新的target信息以yaml或json文件格式添加到target文件中 ,prometheus会定期从指定文件中读取target信息并更新
好处:
(1)不需要一个一个的手工去添加到主配置文件,只需要提交到要加载目录里边的json或yaml文件就可以了;
(2)方便维护,且不需要每次都重启prometheus服务端。
Prometheus提供两种重新加载配置文件prometheus.yml的方法:
1.向prometheus进行发信号
kill -HUP pid
2.向prometheus发送HTTP请求
curl -XPOST http://prometheus.chenlei.com/-/reload

“/-/reload” 只接收POST请求,并且需要在启动prometheus进程时,指定 “–web.enable-lifecycle”
创建服务脚本systemd管理
vim  /usr/lib/systemd/system/prometheus.service

[Unit]
Description=Prometheus
After=network.target

[Service]
Type=simple
User=prometheus
Group=prometheus
ExecStart=/opt/prometheus/prometheus \
--config.file=/opt/prometheus/prometheus.yml \
--storage.tsdb.path=/opt/prometheus/data \
--storage.tsdb.retention.time=15d \
--web.console.templates=/opt/prometheus/consoles \
--web.console.libraries=/opt/prometheus/console_libraries \
--web.max-connections=512 \
--web.external-url "http://192.168.50.a:9090" \
--web.listen-address "0.0.0.0:9090" \
--web.enable-admin-api \
--web.enable-lifecycle
Restart=on-failure

[Install]
WantedBy=multi-user.target
启动并验证
- 查看服务状态
systemctl daemon-reload
systemctl enable prometheus
systemctl start  prometheus
systemctl status prometheus
- 查看服务端口
[root@prometheus prometheus]# ss -tunlp | grep 9090
tcp    LISTEN     0      65535    :::9090                 :::*                   users:(("prometheus",pid=13988,fd=8))
- 配置文件语法检测
# ./promtool check config prometheus.yml
绘图
访问 web ui
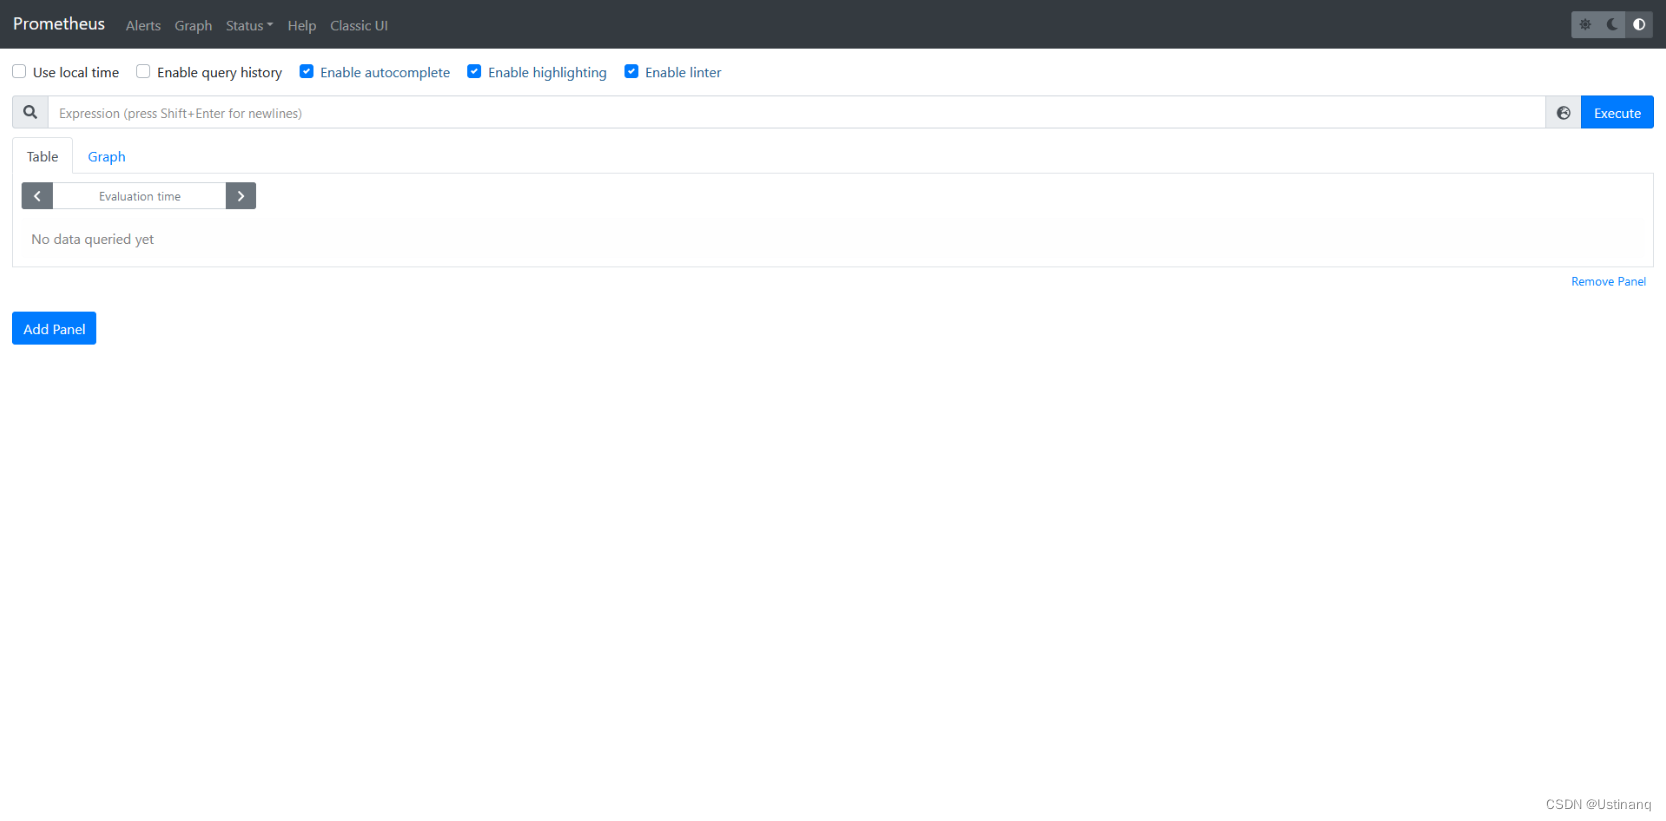
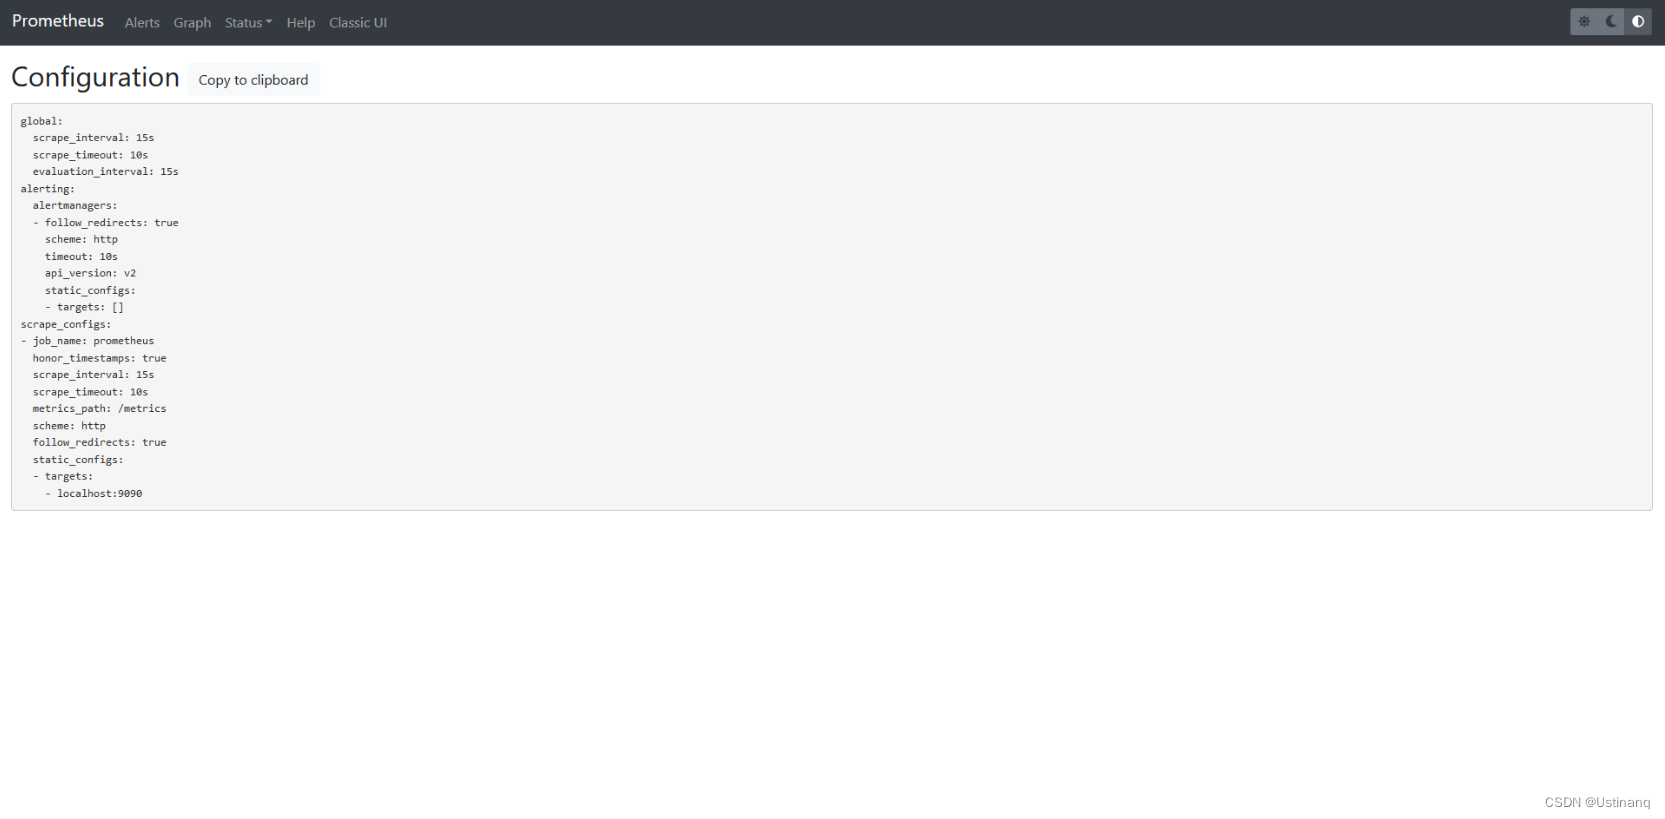
在Status菜单下,Configuration,Rule,Targets等: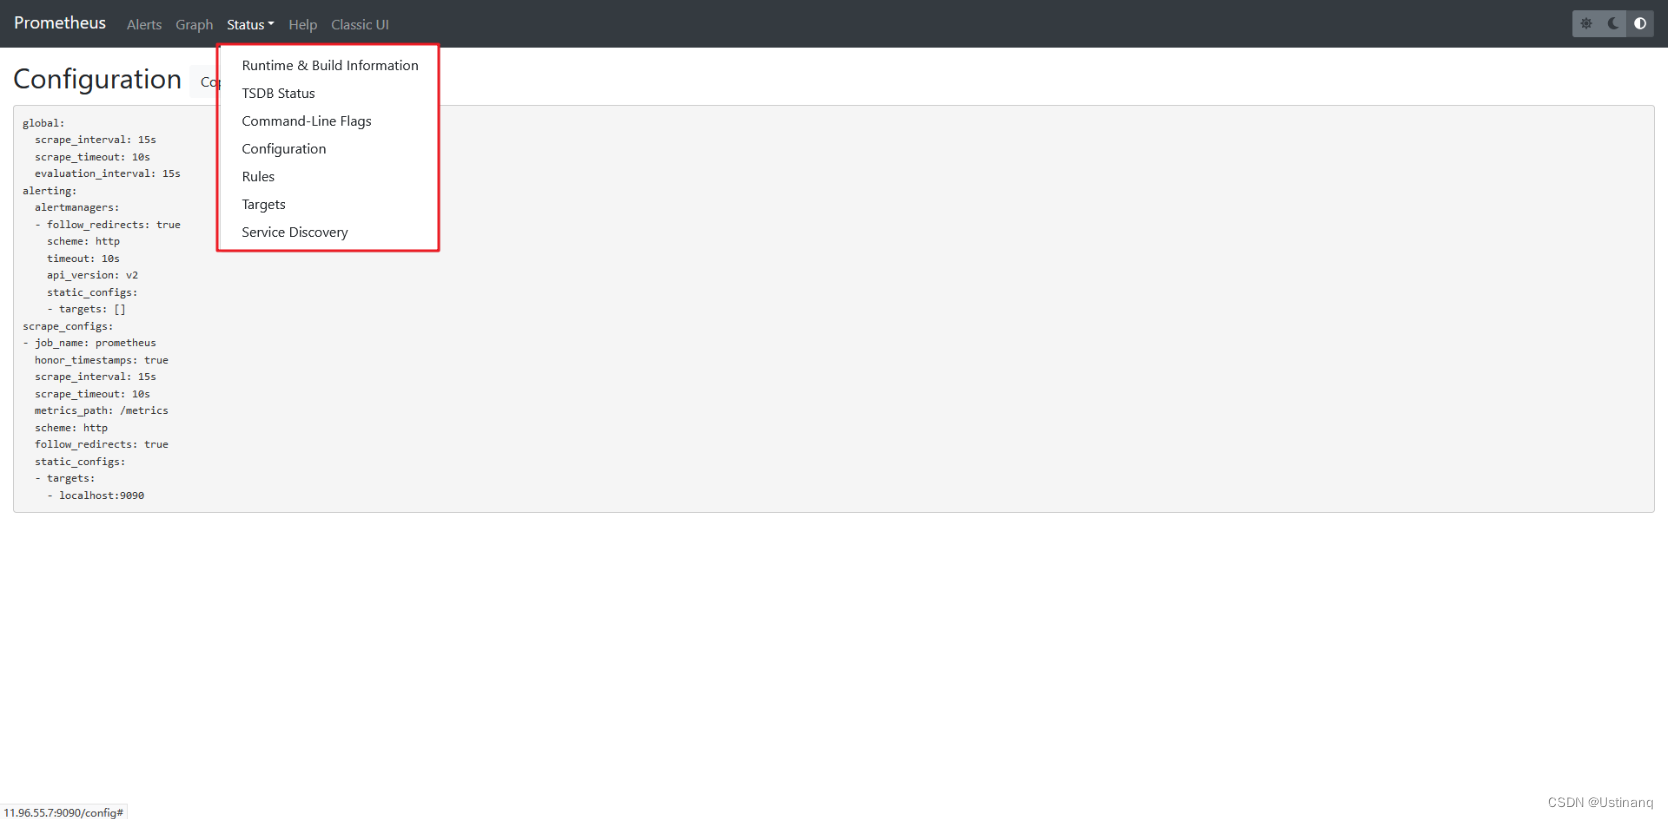
Status–>Configuration展示prometheus.yml的配置,如下:
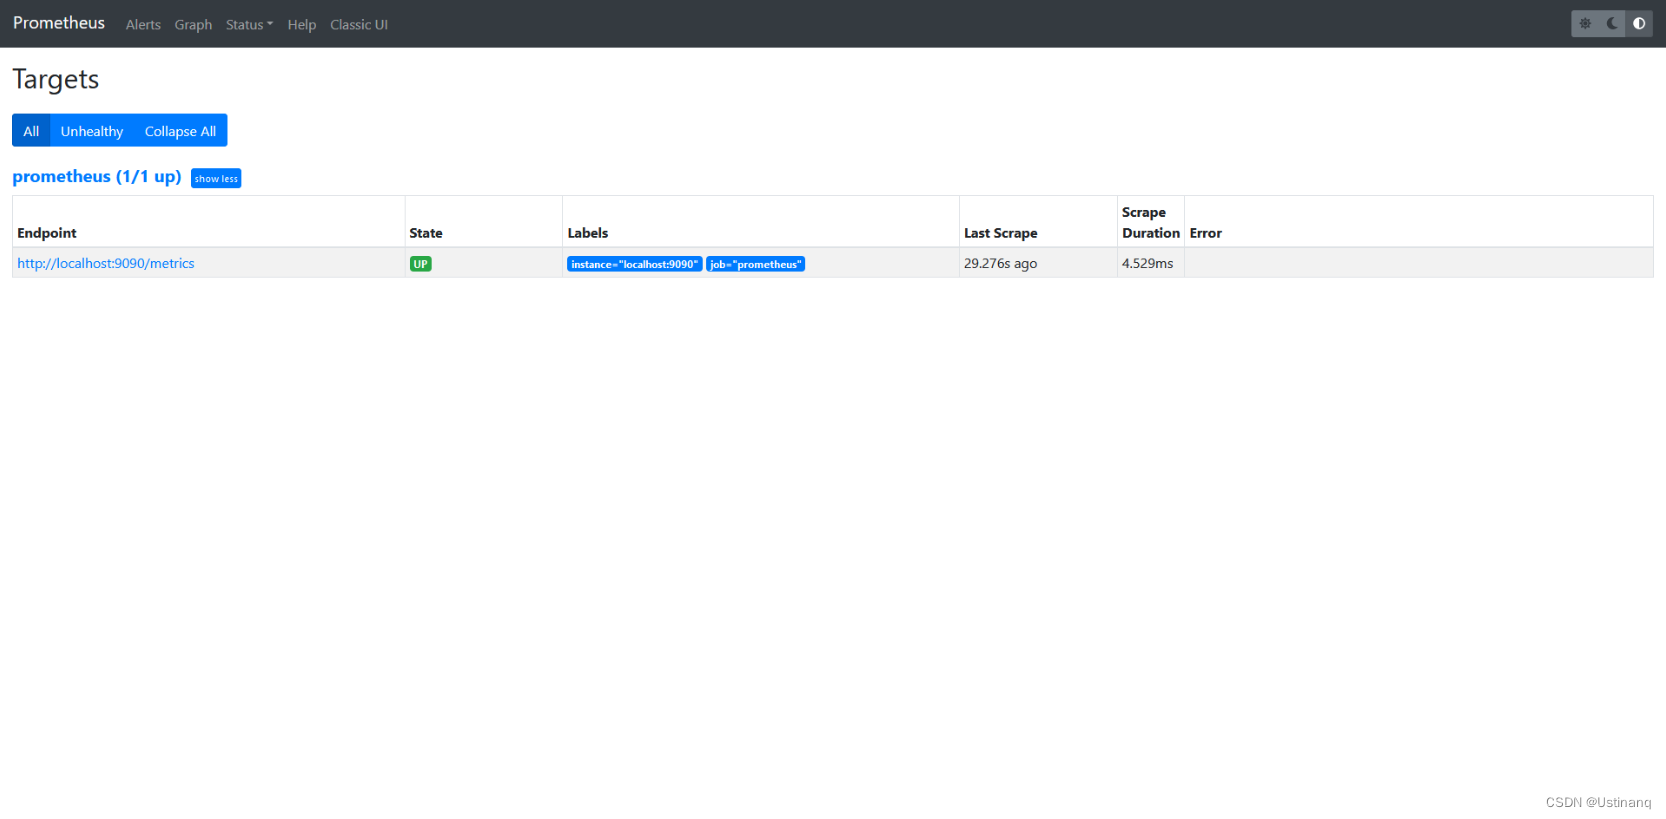
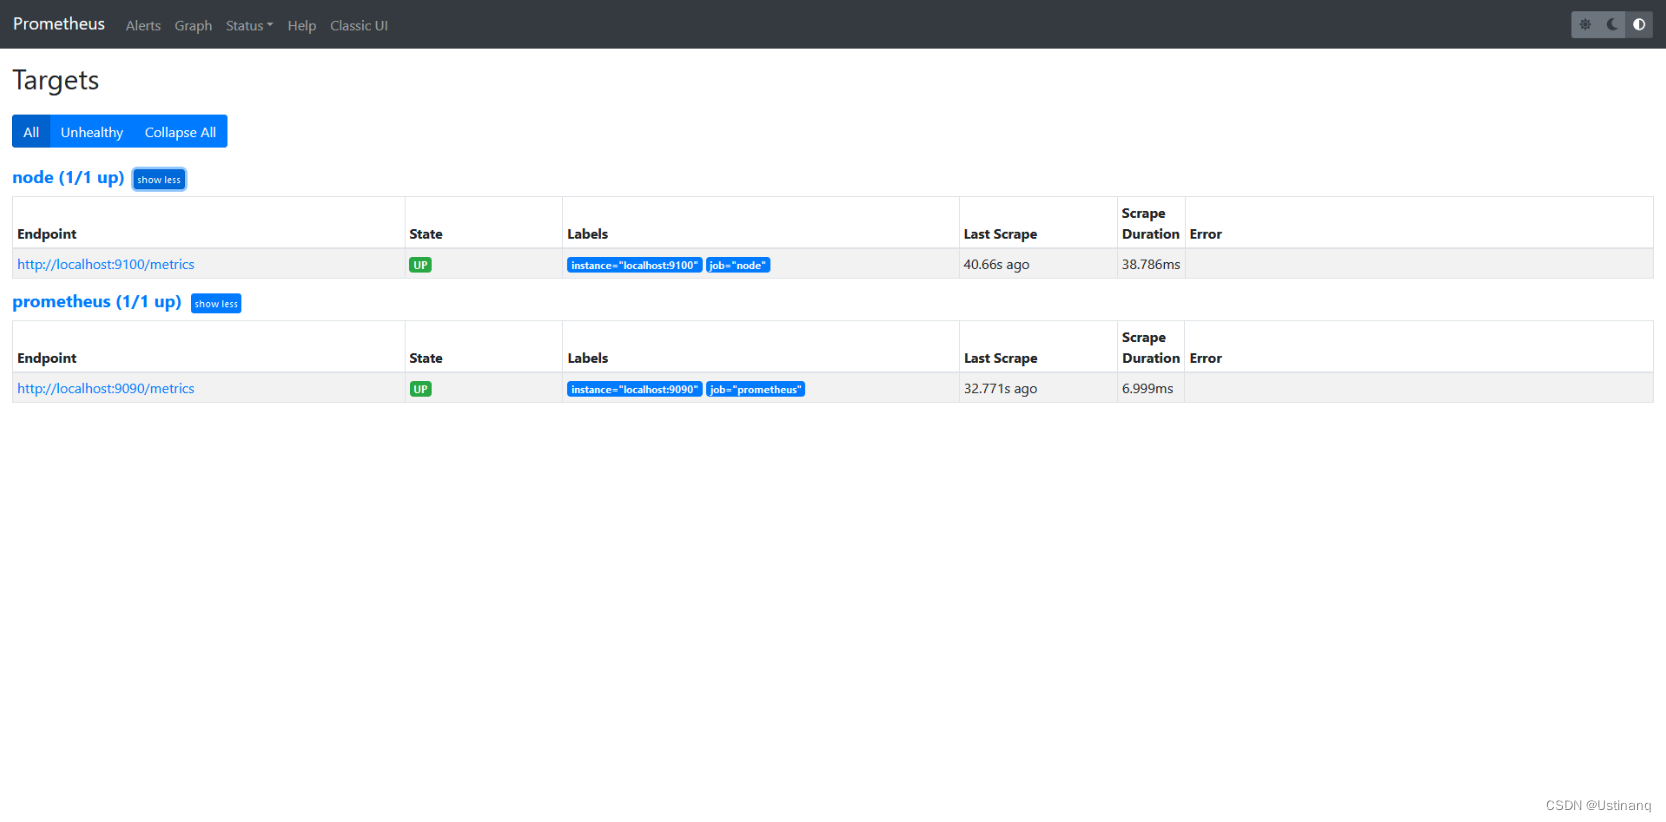
Status–>Targets展示监控具体的监控目标:
访问:http://127.0.0.1:9090/metrics,查看从exporter具体能抓到的数据:

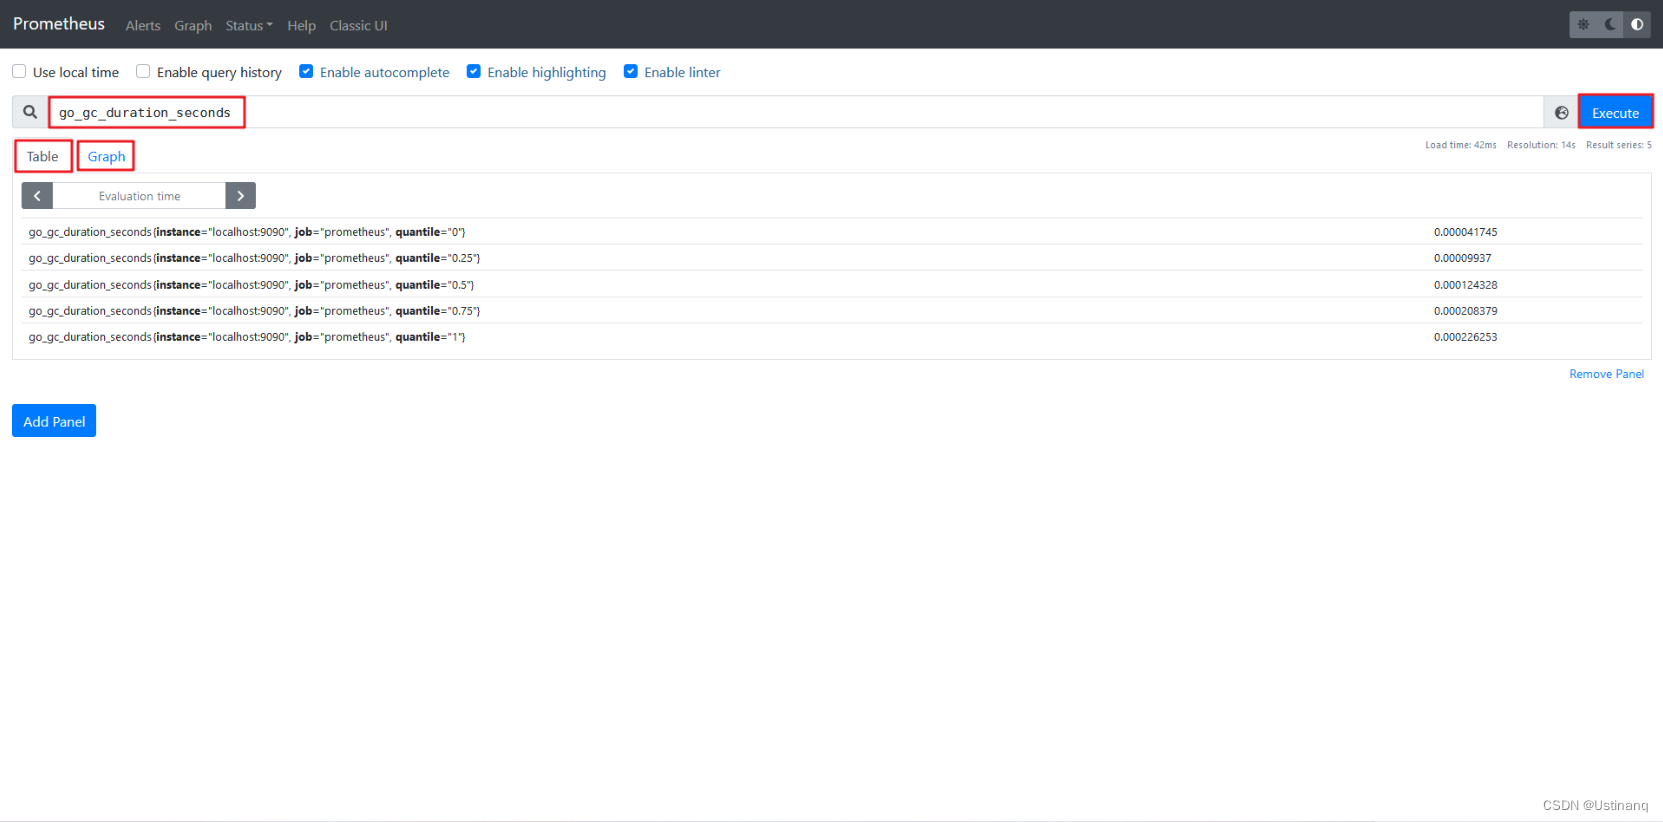
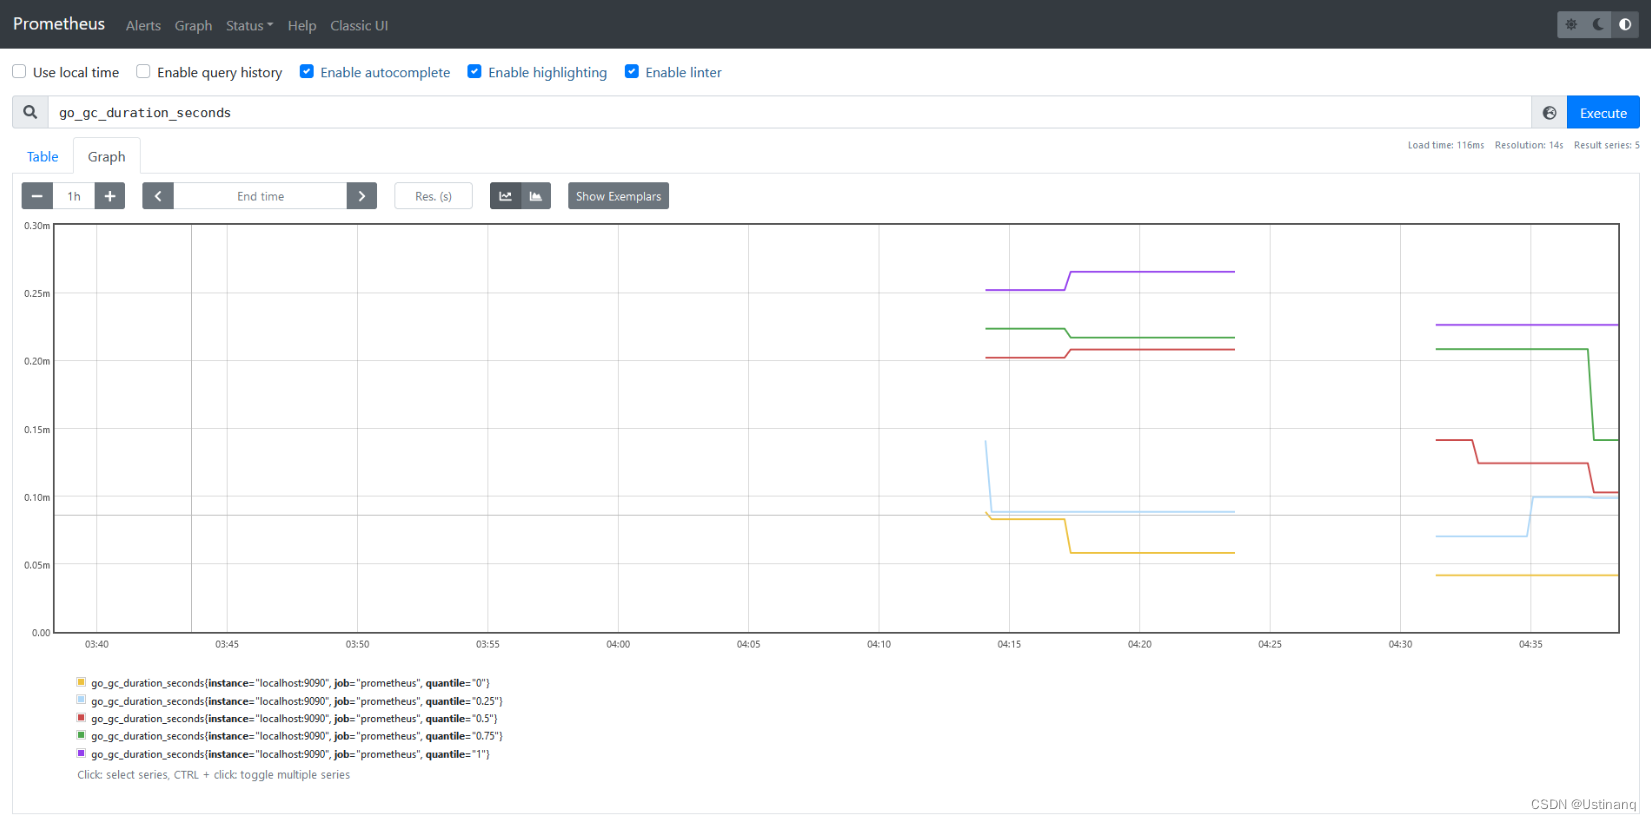
访问:http://127.0.0.1:9090,在输入框中任意输入1个exporter能抓取得值,点击"Execute"按钮,即可见相应抓取数据的图形,数据以table和Graph:
3.部署node_exporter
Node_exporter收集机器的系统数据,这里采用prometheus官方提供的exporter,除node_exporter外,官方还提供consul,memcached,haproxy,mysqld等exporter,具体可查看官网。
安装 node_exporter
step 1.下载
wget https://github.com/prometheus/node_exporter/releases/download/v1.6.1/node_exporter-1.6.1.linux-amd64.tar.gz
step 2.安装
tar -zxvf node_exporter-1.6.1.linux-amd64.tar.gz -C /opt/
cd /opt/
mv node_exporter-1.6.1.linux-amd64/  node_exporter
step 3.添加用户
groupadd prometheus
useradd -g prometheus -s /sbin/nologin prometheus
chown -R prometheus:prometheus /opt/node_exporter
step 4.设置开机启动(个人给定端口9101)
vim  /lib/systemd/system/node_exporter.service
[Unit]
Description=Prometheus Node_exporter
After=network.target prometheus.service

[Service]
Type=simple
User=prometheus
Group=prometheus
ExecStart=/opt/node_exporter/node_exporter --web.listen-address=0.0.0.0:9101
Restart=on-failure

[Install]
WantedBy=multi-user.target
step 5.启动服务
systemctl daemon-reload
systemctl enable node_exporter
systemctl start node_exporter
step 6.验证
查看 node_exporter服务http://192.168.50.b:9101/metrics (默认端口为: 9101,默认9100)

查看监控指标 http://192.168.50.b:9101/metrics

添加 node_exporter到配置文件
安装好 node_exporter 后,我们需要在 Prometheus 中对其进行集成
step 1.修改 Prometheus 的配置文件 (prometheus.yml),添加 node 服务 (在 scrape_configs 属性下添加)
cat >> prometheus.yml <<EOF
  - job_name: 'node'
    static_configs:
    - targets: ['NodeIP:9101']
EOF
step 2.重启 prometheus 服务
systemctl restart prometheus.service
或热加载
curl -X POST 192.168.50.a:9090/-/reload
step 3.查看target
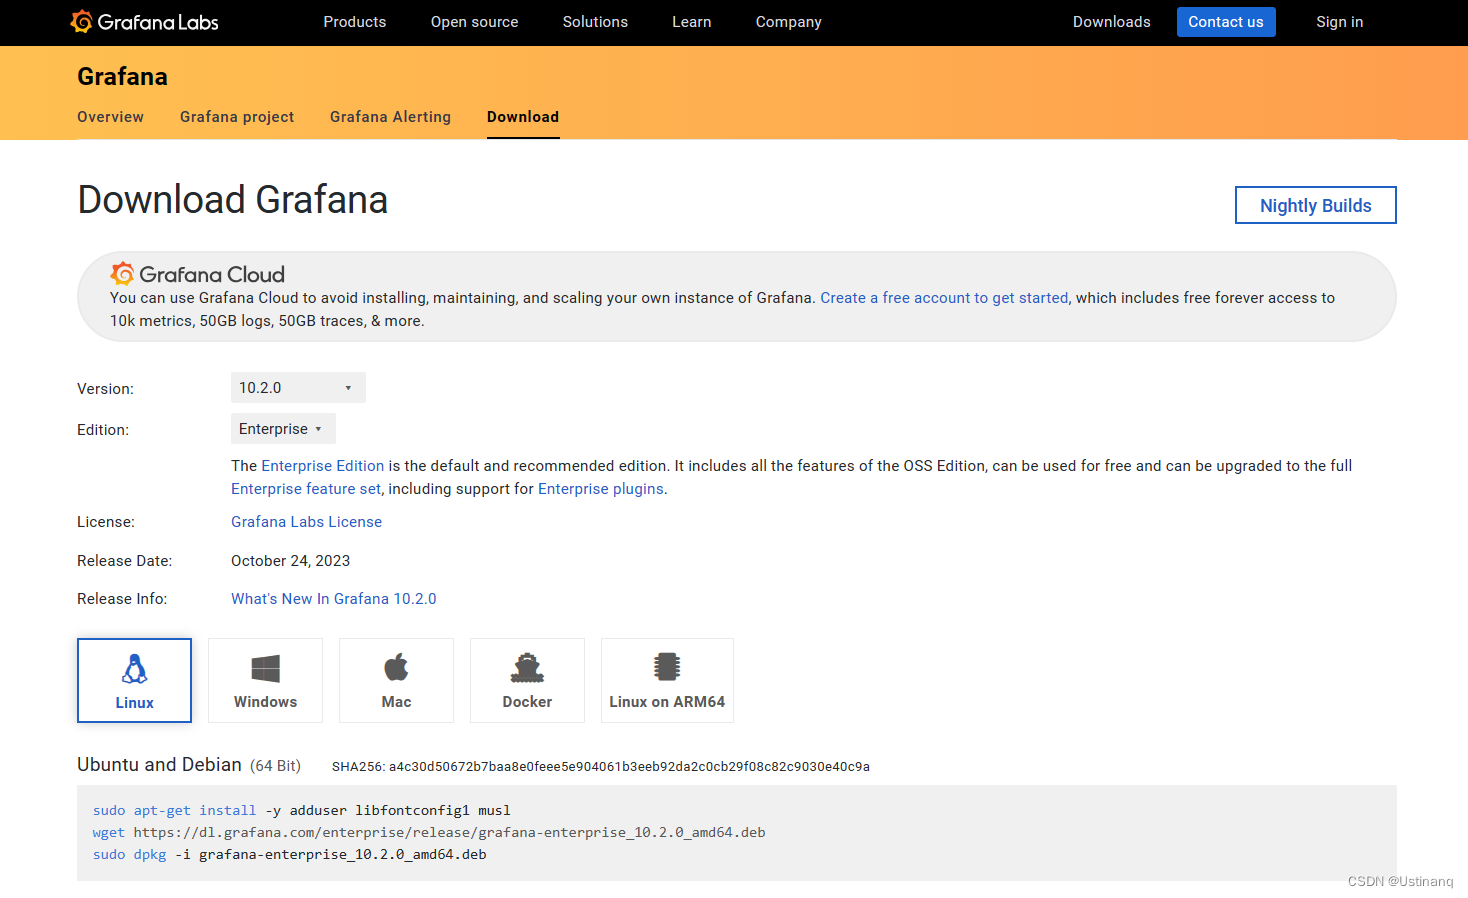
4.部署grafana
下载地址:https://grafana.com/grafana/download?pg=oss-graf&plcmt=resources
安装 grafana
step 1.下载
wget https://dl.grafana.com/enterprise/release/grafana-enterprise-10.2.0-1.x86_64.rpm
step 2.安装
yum -y install grafana-enterprise-10.2.0-1.x86_64.rpm
step 3.配置文件
配置文件位于/etc/grafana/grafana.ini,保持默认配置即可。
step 4.设置开机启动
systemctl enable grafana-server
systemctl start grafana-server
添加数据源
-
登陆
访问:http://127.0.0.1:3000,默认账号/密码:admin/admin,首次登陆需要修改默认的管理员密码
-
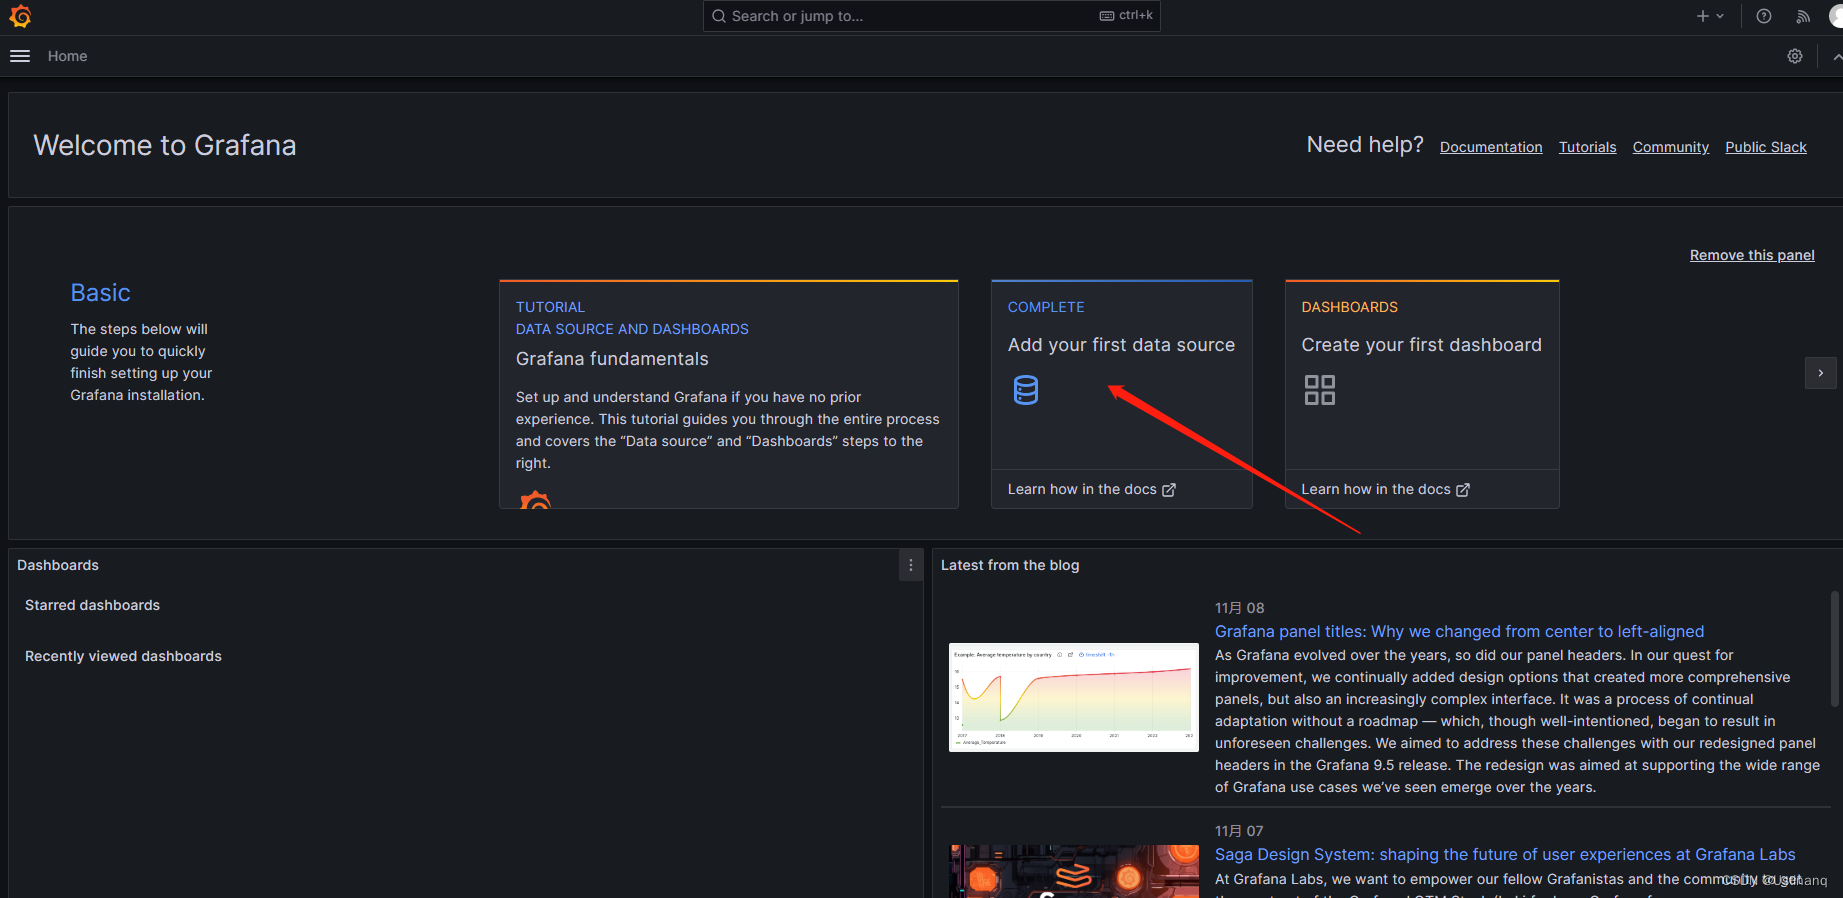
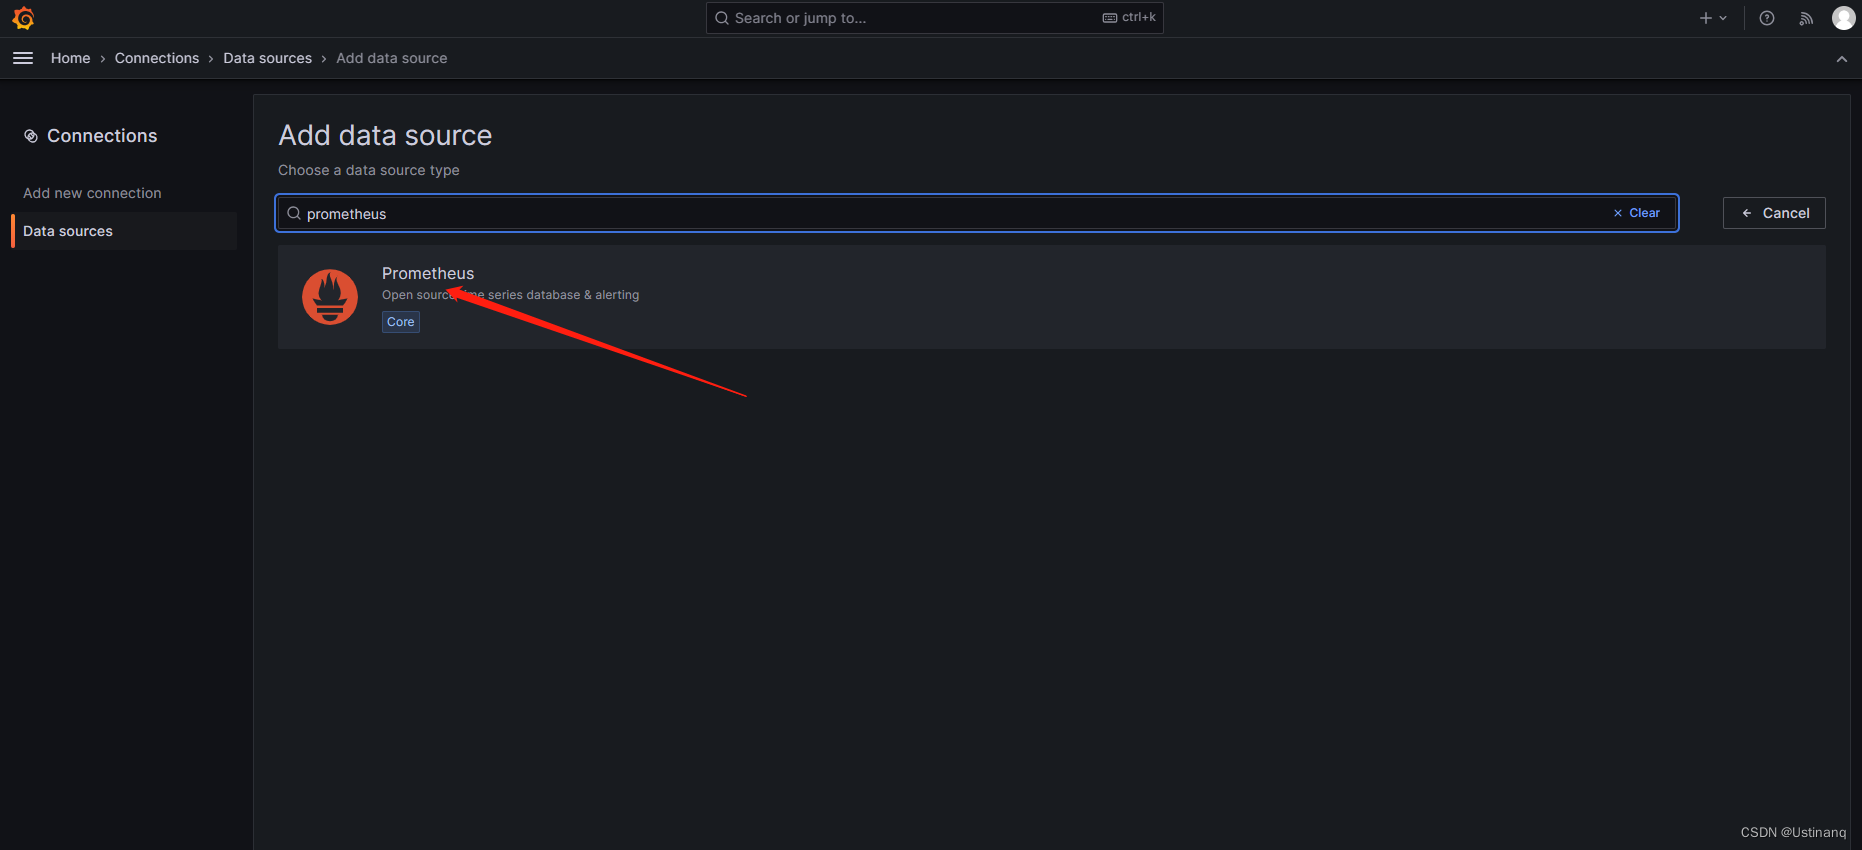
添加数据源
在登陆首页,点击”Add data source”按钮,跳转到添加数据源页面,配置如下:

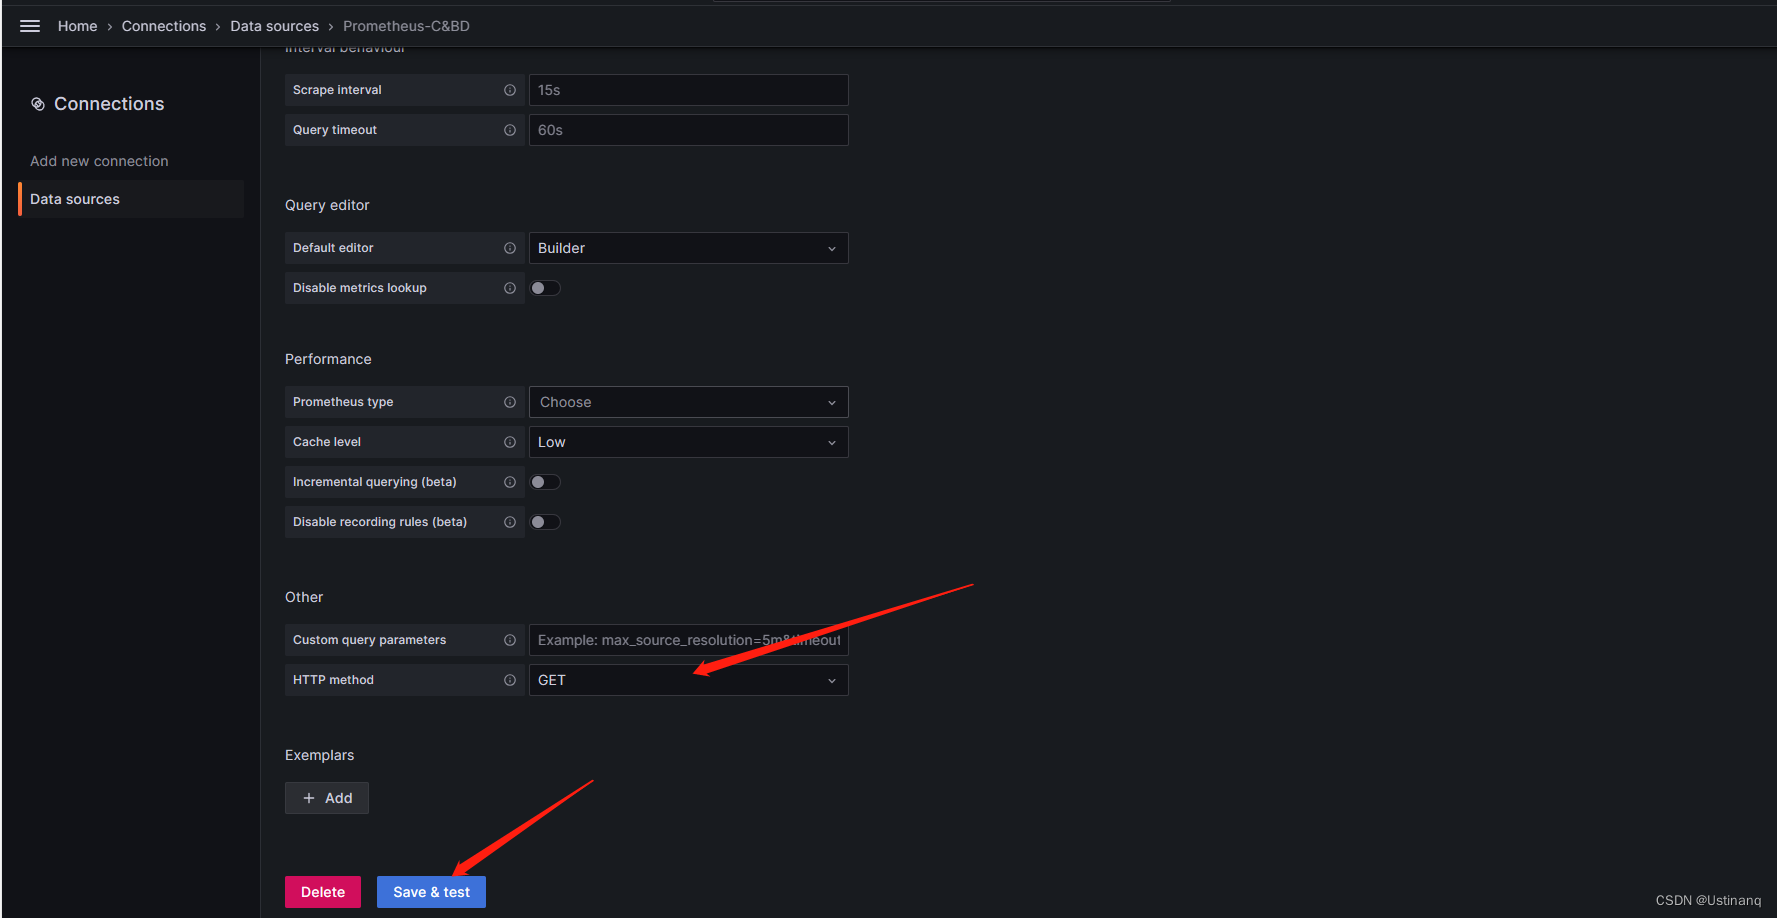
填写 URL: http://localhost:9090/:

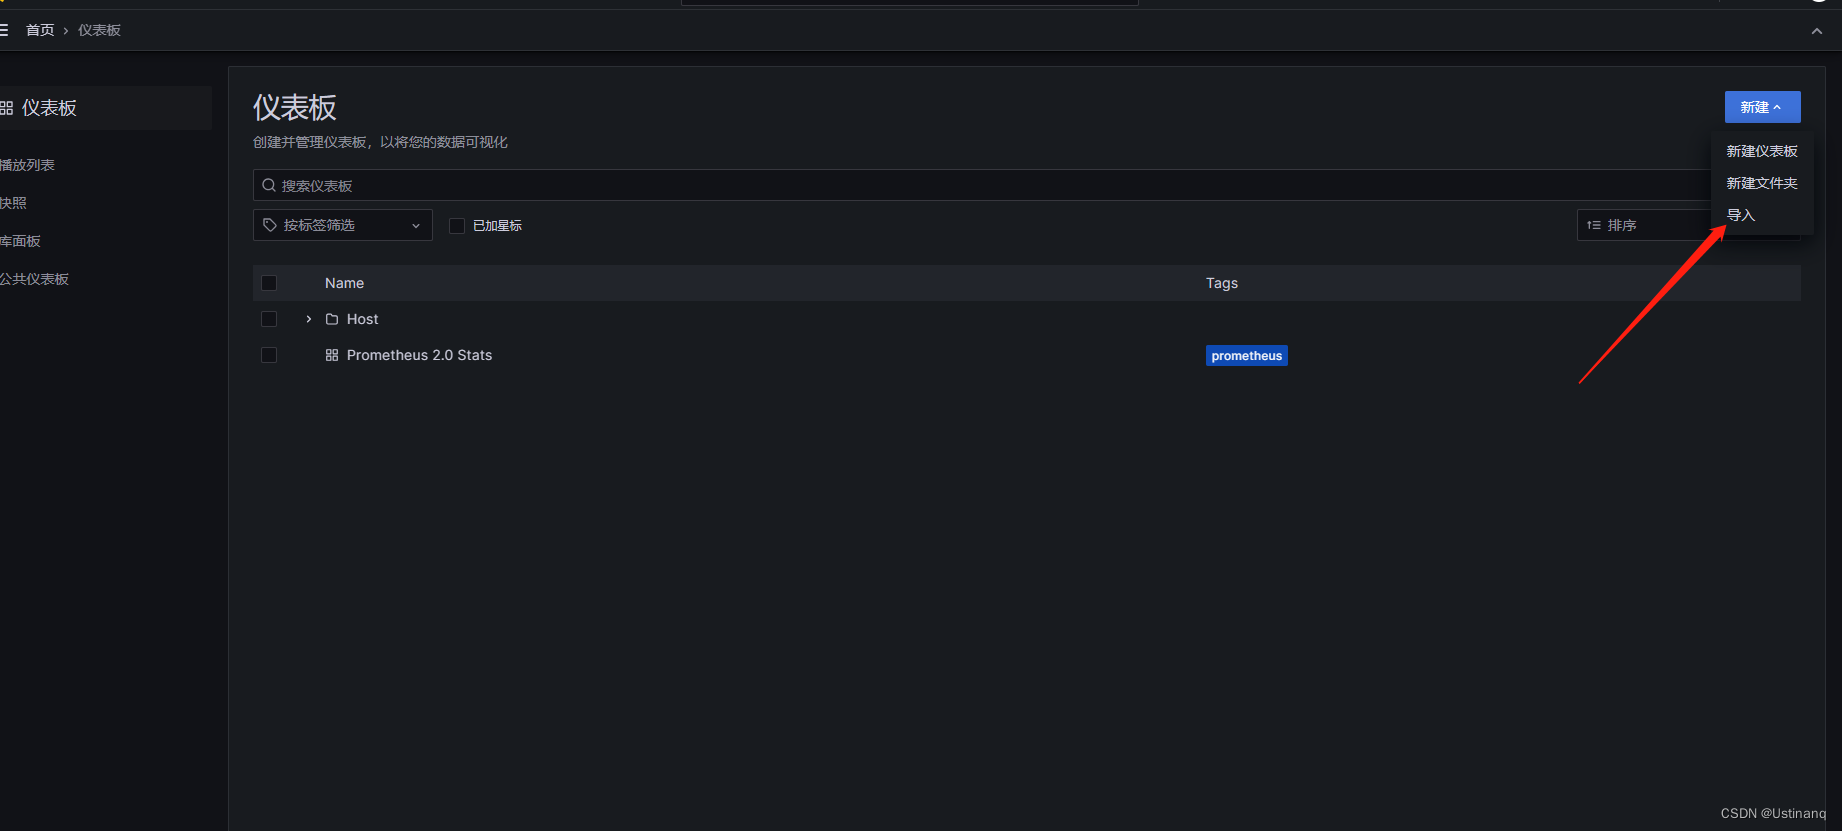
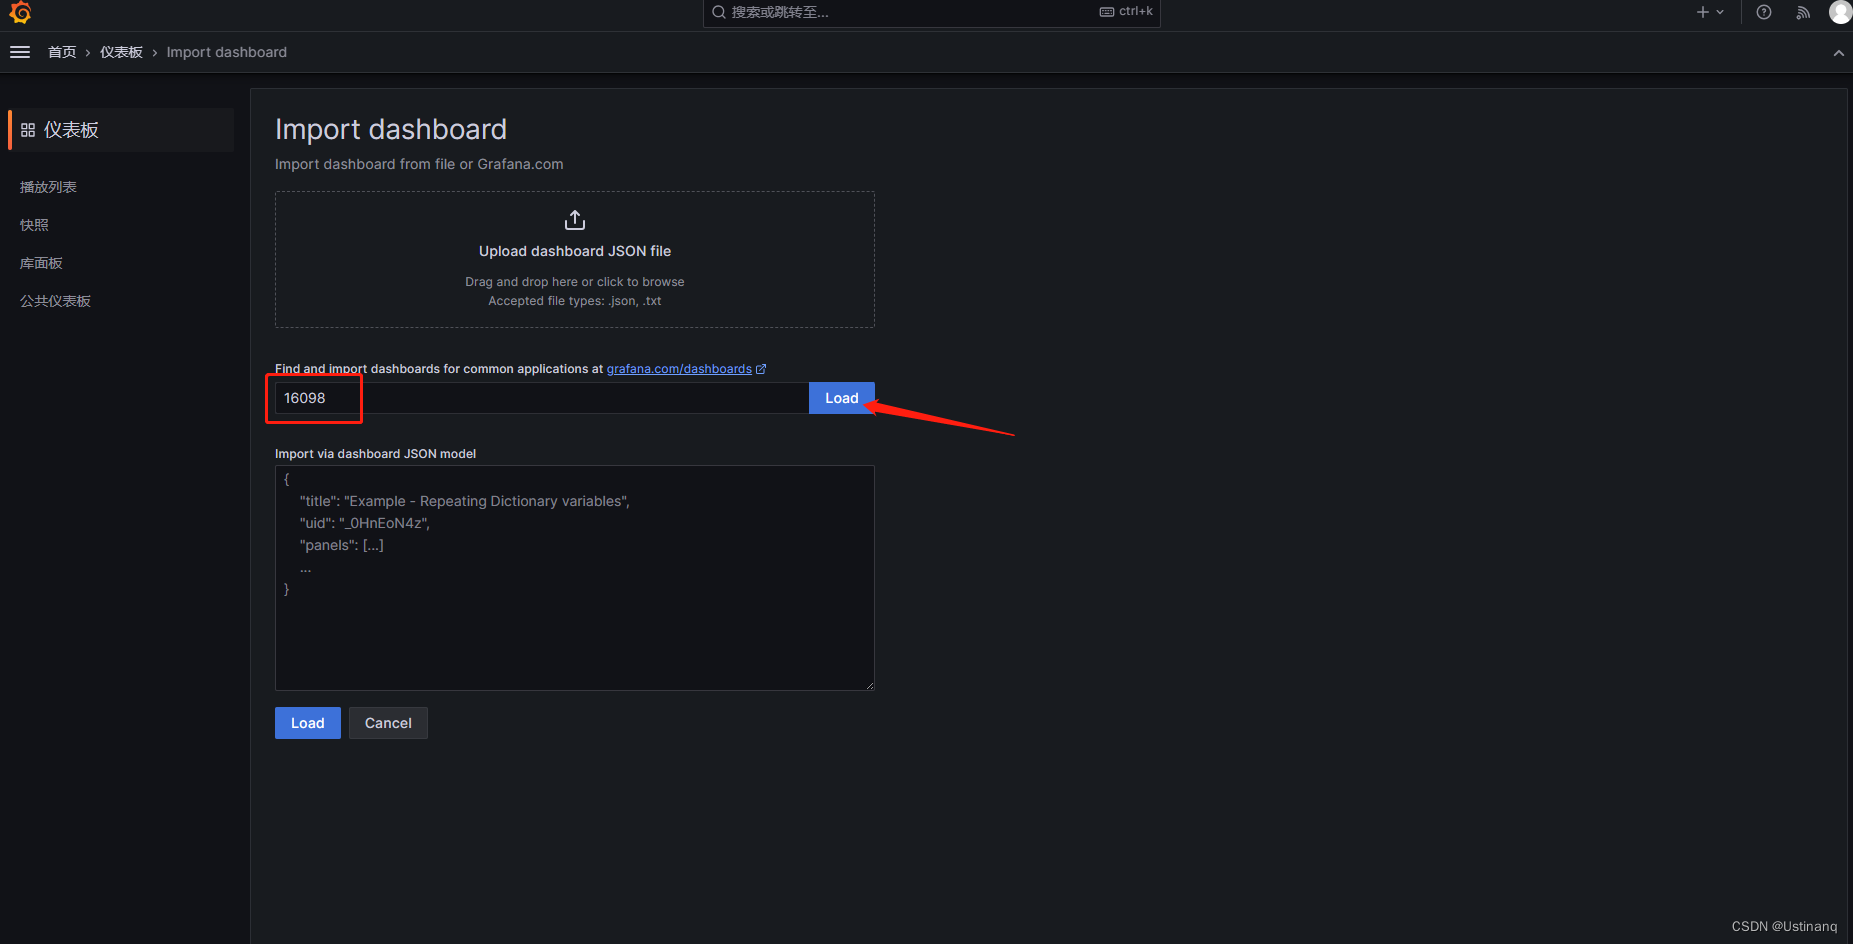
导入主机详情模板:英文版-11074,中文-16098
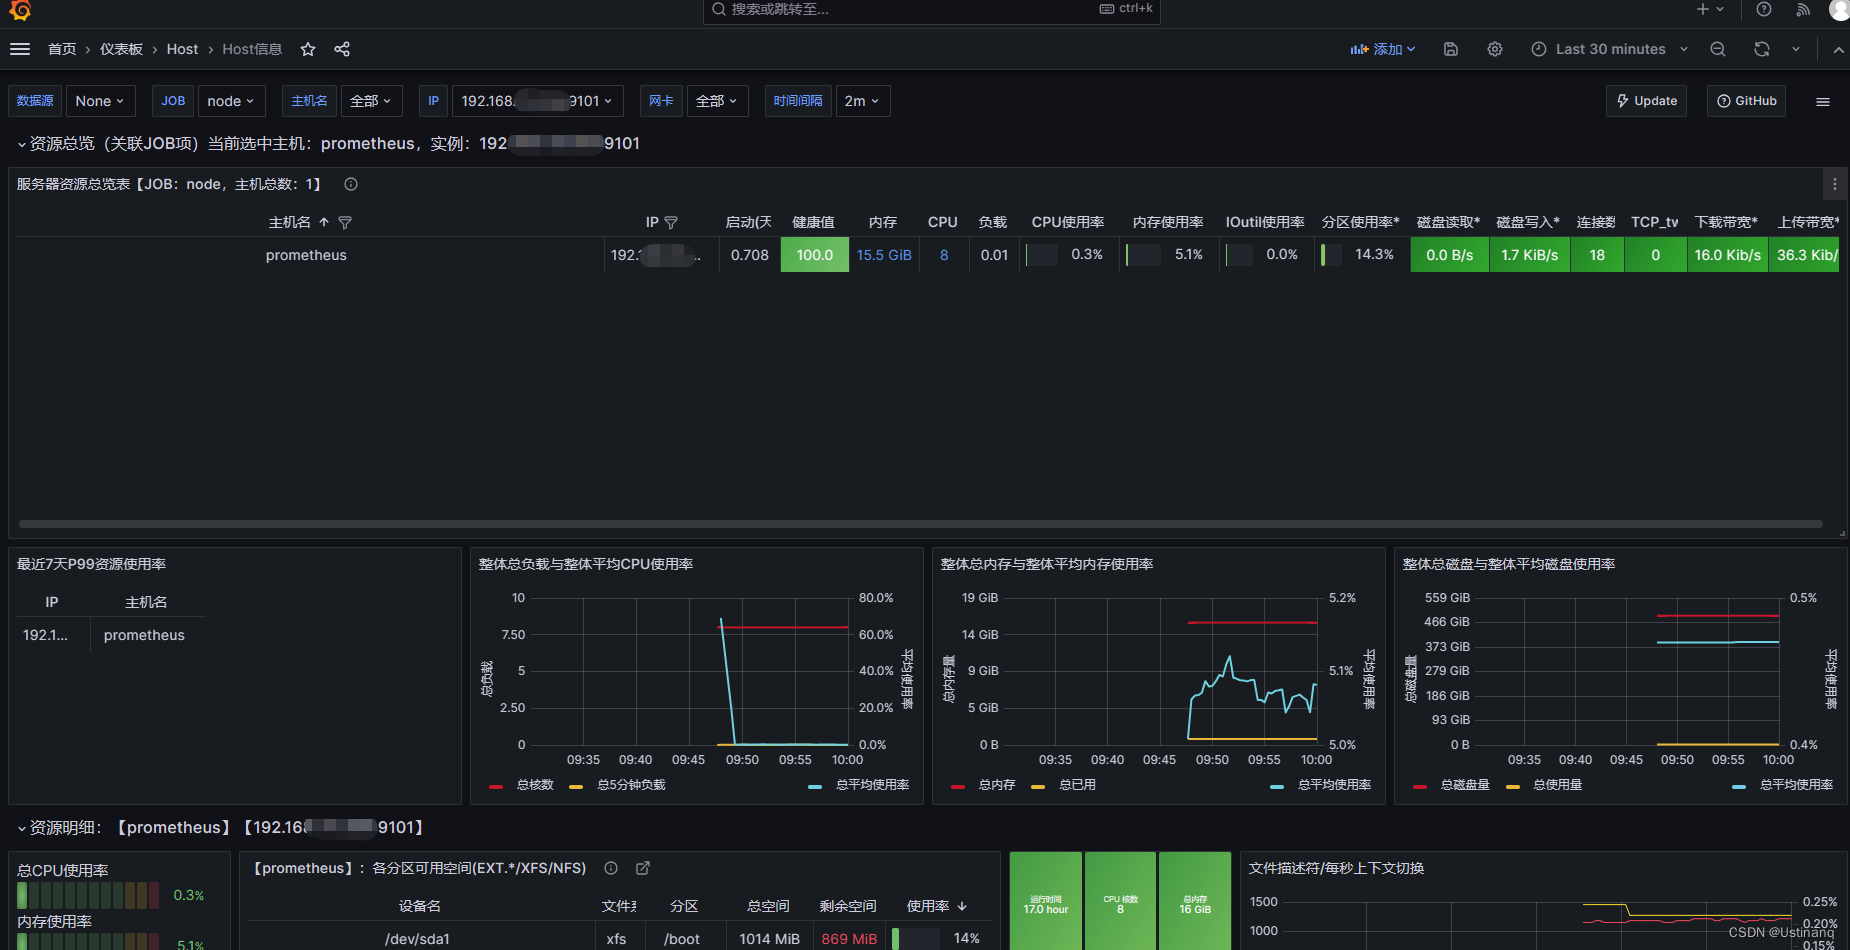
撒花!!!


 815
815

 被折叠的 条评论
为什么被折叠?
被折叠的 条评论
为什么被折叠?
 到【灌水乐园】发言


