


作图环境:vscode+插件Jupyter
这段话很重要:
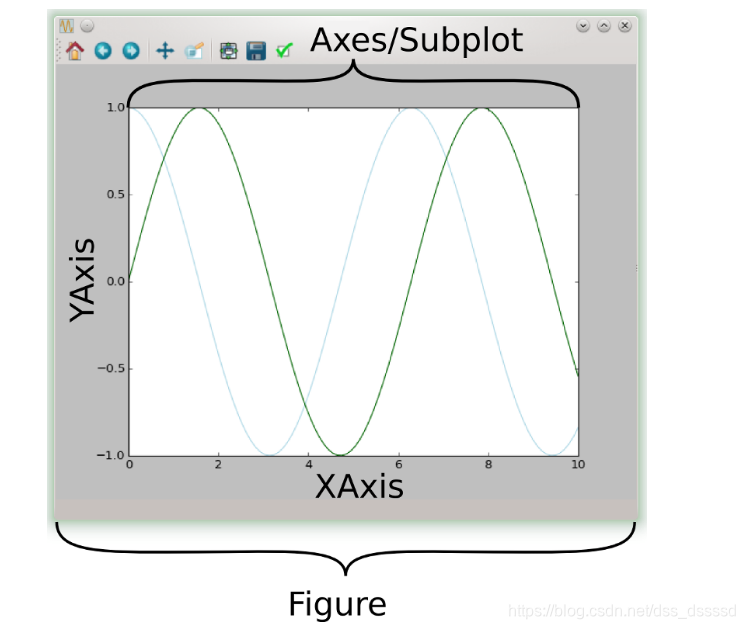
一个作图的窗口就是一个Figure, 在Figure上可以有很多个Axes/Subplot,每一个Axes/Subplot为一个单独的绘图区,可以在上面绘图,其中每一个Axes/subplot, 有XAxis,YAxis,在上面可以标出刻度,刻度的位置,以及xy轴的标签label。
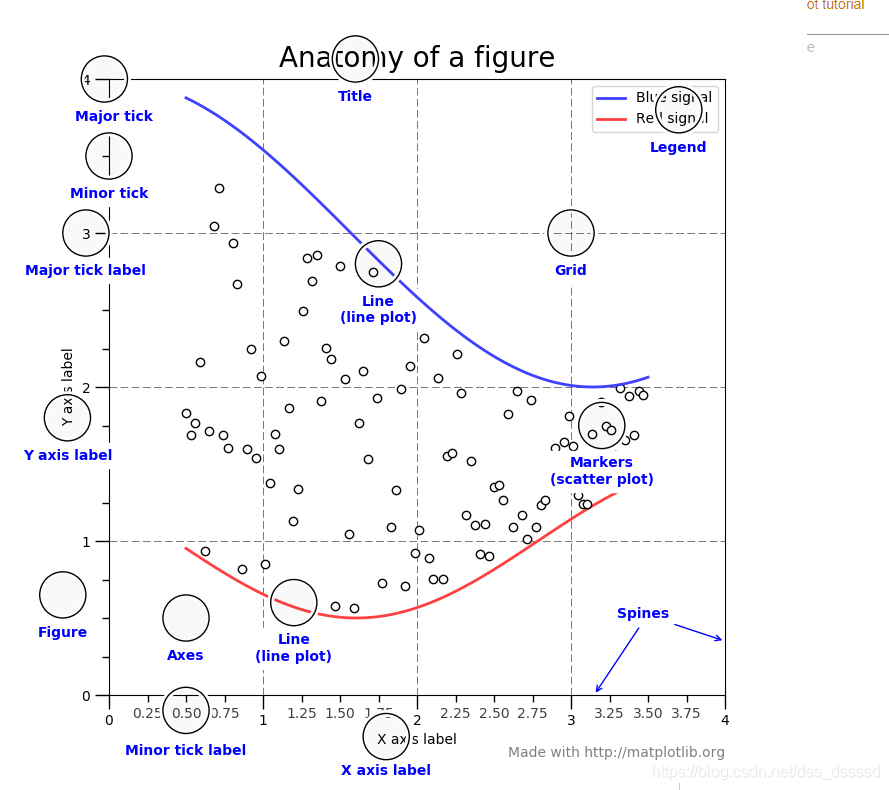
下图为一个Figure上更详细的内容:
- 创建Figure
plt.figure
https://matplotlib.org/api/_as_gen/matplotlib.pyplot.figure.html
- 常用的一个参数: figsize=(width, height), 可以指定(w,h),也可以用figaspect(ratio)计算。创建指定宽度和高度的Figure
- Return : 返回的是一个Figure窗体对象
函数:figaspect(ratio) https://matplotlib.org/api/_as_gen/matplotlib.figure.figaspect.html?highlight=figaspect#matplotlib.figure.figaspect
从rcParams["figure.figsize"],取出height,并利用 r a t i o = h e u g h t w i d t h ratio = \frac{heught}{width} ratio=widthheught计算出width,返回(width, height)
import matplotlib.pyplot as plt
fig = plt.figure(figsize=plt.figaspect(2.0)) # an empty figure with no axes
fig.suptitle("No axec on this figure")  # Add a title so we know which it is

- 在Figure上创建Axes
所有的画图工作都在Axes上执行,一个Figure可以有很多个Axes,但是一个Axes只能属于一个Figure.
一般来说,你会创建一个Figure,然后再将Axes添加到Figure上。
你可能会使用fig.add_axes,但是,更多的时候使用fig.add_subplot更方便。
add_subplot(*args, **kwargs)
https://matplotlib.org/api/_as_gen/matplotlib.figure.Figure.html?highlight=add_subplot#matplotlib.figure.Figure.add_subplot
- return : Axes实例
# 调用实例
add_subplot(nrows, ncols, index, **
最低0.47元/天 解锁文章


 151
151


 被折叠的 条评论
为什么被折叠?
被折叠的 条评论
为什么被折叠?
 到【灌水乐园】发言


