


什么是选股?
选股(stock selection)是一种主动性投资策略,先按照某种规则或算法分析单只股票的前景,然后构建一个投资组合,长期持有。一般情况下要求组合的股票具有低相关性,这样才能对冲系统性风险,否则在大盘走弱的时候投资组合也会面临巨大的下跌风险。
运用什么模型?
关于如何选股,学术界提出过很多不同的模型,最经典的莫过于马科维茨投资组合理论。这里我们使用MM趋势模型(Mark Minervini’s Trend Template),这是国外一位传奇投资大师提出的技术面选股方法,核心思想是通过技术指标来度量股票动能,从中筛选最有潜力的股票,买入并持有。
MM趋势模型
- 股票价格高于150天均线和200天均线
- 150日均线高于200日均线
- 200日均线上升至少1个月
- 50日均线高于150日均线和200日均线
- 股票价格高于50日均线
- 股票价格比52周低点高30%
- 股票价格在52周高点的25%以内
- 相对强弱指数(RS)大于等于70,这里的相对强弱指的是股票与大盘对比,RS = 股票1年收益率 / 基准指数1年收益率
关于Mark Minervini
全美最富盛名的交易员之一,曾经获得30000%的收益率,在34岁前称为亿万富翁,详情见<金融怪杰>一书。
选股面临的技术性难题?
- 从哪里获取大量股票的历史数据?
- 当股票数量很多时,如何提高计算性能?
本文将用Python实现MM模型的量化选股,并解决上述提出的两个技术难题。
-
import os -
import datetime as dt -
import time -
from typing import Any, Dict, Optional, List -
import requests -
import pickle -
import numpy as np -
import pandas as pd -
import matplotlib.pyplot as plt -
import seaborn as sns -
import talib -
import multiprocessing as mp -
from requests.exceptions import ConnectionError, Timeout -
%matplotlib inline -
plt.style.use("fivethirtyeight")
1. 从蜂鸟数据获取历史数据
蜂鸟数据是新兴的金融数据提供商,提供包括股票,外汇,商品期货和数字货币的实时报价和历史数据,并提供API接口,是所有金融从业者获取免费数据的便捷渠道。
-
## 撰写自定义函数,通过API获取数据 -
def fetch_trochil(url: str, -
params: Dict[str, str], -
attempt: int = 3, -
timeout: int = 3) -> Dict[str, Any]: -
"""装饰requests.get函数""" -
for i in range(attempt): -
try: -
resp = requests.get(url, params, timeout=timeout) -
resp.raise_for_status() -
data = resp.json()["data"] -
if not data: -
raise Exception("empty dataset") -
return data -
except (ConnectionError, Timeout) as e: -
print(e) -
i += 1 -
time.sleep(i * 0.5) -
def fetch_cnstocks(apikey: str) -> pd.DataFrame: -
"""从蜂鸟数据获取A股产品列表""" -
url = "https://api.trochil.cn/v1/cnstock/markets" -
params = {"apikey": apikey} -
res = fetch_trochil(url, params) -
return pd.DataFrame.from_records(res) -
def fetch_daily_ohlc(symbol: str, -
date_from: dt.datetime, -
date_to: dt.datetime, -
apikey: str) -> pd.DataFrame: -
"""从蜂鸟数据获取A股日图历史K线""" -
url = "https://api.trochil.cn/v1/cnstock/history" -
params = { -
"symbol": symbol, -
"start_date": date_from.strftime("%Y-%m-%d"), -
"end_date": date_to.strftime("%Y-%m-%d"), -
"freq": "daily", -
"apikey": apikey -
} -
res = fetch_trochil(url, params) -
return pd.DataFrame.from_records(res) -
def fetch_index_ohlc(symbol: str, -
date_from: dt.datetime, -
date_to: dt.datetime, -
apikey: str) -> pd.DataFrame: -
"""获取股指的日图历史数据""" -
url = "https://api.trochil.cn/v1/index/daily" -
params = { -
"symbol": symbol, -
"start_date": date_from.strftime("%Y-%m-%d"), -
"end_date": date_to.strftime("%Y-%m-%d"), -
"apikey": apikey -
} -
res = fetch_trochil(url, params) -
return pd.DataFrame.from_records(res)
1.1 产品列表
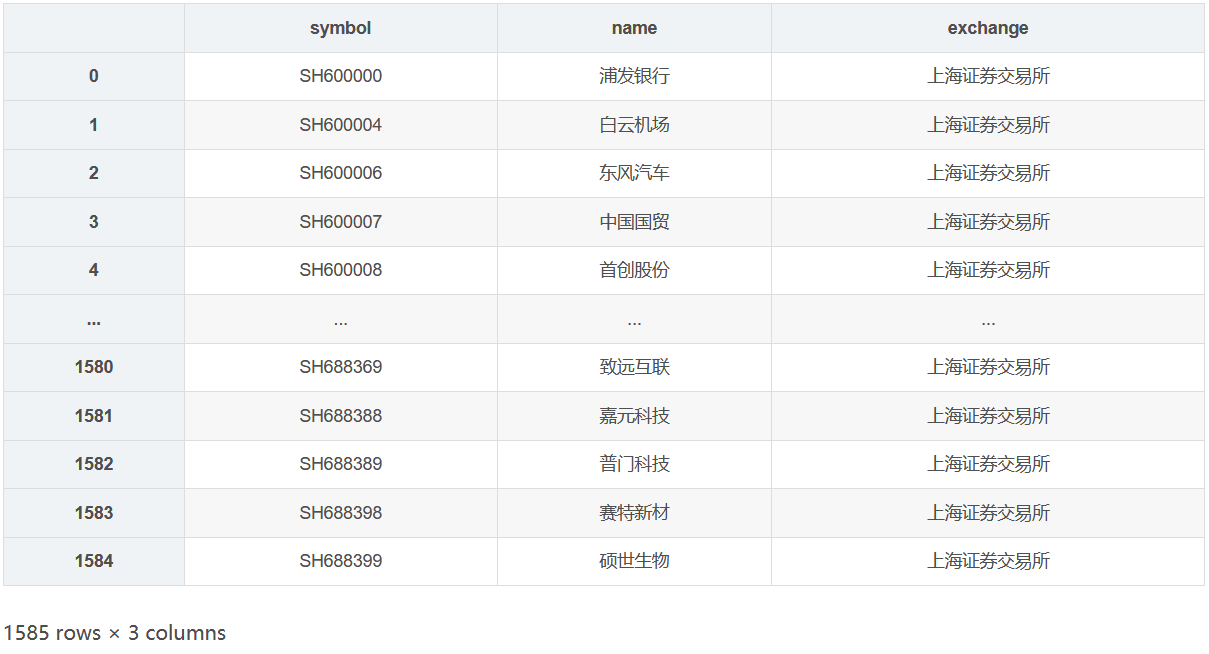
先获取沪深A股上市企业的所有股票ID。
-
apikey = os.getenv("TROCHIL_API") # use your apikey -
cnstocks = fetch_cnstocks(apikey) -
cnstocks

成功获取沪深A股3789只股票的产品信息,前缀'SH'代表上海证券交易所股票,'SZ'代表在深圳证券交易所的股票。建模时仅使用上证交易所的股票。
-
# 筛选前缀为'SH'的股票 -
cnstocks_shsz = cnstocks.query("symbol.str.startswith('SH')") -
cnstocks_shsz
1.2 个股历史数据
从蜂鸟数据获取上海证券交易所股票的日图历史价格。根据MM趋势模型,我们最少需要过去260天的历史数据,部分新上市或已退市的股票可能不符合要求,所以剔除K线数量少于260的股票。
-
%%time -
# 下载2019年至今的历史数据 -
# 下载时剔除K线少于260个交易日的股票 -
date_from = dt.datetime(2019, 1, 1) -
date_to = dt.datetime.today() -
symbols = cnstocks_shsz.symbol.to_list() -
min_klines = 260 -
# 逐个下载,蜂鸟数据的API没有分钟请求限制 -
# 先把数据存储在列表中,下载完成后再合并和清洗 -
ohlc_list = [] -
for symbol in symbols: -
try: -
ohlc = fetch_daily_ohlc(symbol, date_from, date_to, apikey) -
if ohlc is not None and len(ohlc) >= min_klines: -
ohlc.set_index("datetime", inplace=True) -
ohlc_list.append(ohlc) -
except Exception as e: -
pass -
CPU times: user 21.7 s, sys: 349 ms, total: 22 s -
Wall time: 49.3 s
下载1500多只股票的历史数据(约400多个交易日)只需要不到1分钟的时间。接下来我们整合和清洗数据,然后存储在本地,方便后续分析。
-
ohlc_joined = pd.concat(ohlc_list) -
ohlc_joined.info() -
<class 'pandas.core.frame.DataFrame'> -
Index: 532756 entries, 2019-01-02 to 2020-07-29 -
Data columns (total 6 columns): -
# Column Non-Null Count Dtype -
--- ------ -------------- ----- -
0 open 532756 non-null float64 -
1 high 532756 non-null float64 -
2 low 532756 non-null float64 -
3 close 532756 non-null float64 -
4 volume 532756 non-null float64 -
5 symbol 532756 non-null object -
dtypes: float64(5), object(1) -
memory usage: 28.5+ MB
查看是否存在缺失值。
-
ohlc_joined.isnull().sum() -
open 0 -
high 0 -
low 0 -
close 0 -
volume 0 -
symbol 0 -
dtype: int64
保存到本地,以csv格式存储。后面可以直接从本地读取数据,避免API请求带来的时间浪费。
ohlc_joined.to_csv("cnstock_daily_ohlc.csv", index=True)1.3 上证指数
获取上证指数的历史价格,计算过去1年的累计收益率,用于计算个股的相对强弱。
-
benchmark = fetch_index_ohlc("shci", date_from, date_to, apikey) -
benchmark.tail()

-
# 计算1年累计收益率,1年以252个交易日计算 -
benchmark_ann_ret = benchmark.close.pct_change(252).iloc[-1] -
benchmark_ann_ret -
0.12150312157460808
2. 选股
-
def screen(close: pd.Series, benchmark_ann_ret: float) -> pd.Series: -
"""实现MM选股模型的逻辑,评估单只股票是否满足筛选条件 -
Args: -
close(pd.Series): 股票收盘价,默认时间序列索引 -
benchmark_ann_ret(float): 基准指数1年收益率,用于计算相对强弱 -
""" -
# 计算50,150,200日均线 -
ema_50 = talib.EMA(close, 50).iloc[-1] -
ema_150 = talib.EMA(close, 150).iloc[-1] -
ema_200 = talib.EMA(close, 200).iloc[-1] -
# 200日均线的20日移动平滑,用于判断200日均线是否上升 -
ema_200_smooth = talib.EMA(talib.EMA(close, 200), 20).iloc[-1] -
# 收盘价的52周高点和52周低点 -
high_52week = close.rolling(52 * 5).max().iloc[-1] -
low_52week = close.rolling(52 * 5).min().iloc[-1] -
# 最新收盘价 -
cl = close.iloc[-1] -
# 筛选条件1:收盘价高于150日均线和200日均线 -
if cl > ema_150 and cl > ema_200: -
condition_1 = True -
else: -
condition_1 = False -
# 筛选条件2:150日均线高于200日均线 -
if ema_150 > ema_200: -
condition_2 = True -
else: -
condition_2 = False -
# 筛选条件3:200日均线上升1个月 -
if ema_200 > ema_200_smooth: -
condition_3 = True -
else: -
condition_3 = False -
# 筛选条件4:50日均线高于150日均线和200日均线 -
if ema_50 > ema_150 and ema_50 > ema_200: -
condition_4 = True -
else: -
condition_4 = False -
# 筛选条件5:收盘价高于50日均线 -
if cl > ema_50: -
condition_5 = True -
else: -
condition_5 = False -
# 筛选条件6:收盘价比52周低点高30% -
if cl >= low_52week * 1.3: -
condition_6 = True -
else: -
condition_6 = False -
# 筛选条件7:收盘价在52周高点的25%以内 -
if cl >= high_52week * 0.75 and cl <= high_52week * 1.25: -
condition_7 = True -
else: -
condition_7 = False -
# 筛选条件8:相对强弱指数大于等于70 -
rs = close.pct_change(252).iloc[-1] / benchmark_ann_ret * 100 -
if rs >= 70: -
condition_8 = True -
else: -
condition_8 = False -
# 判断股票是否符合标准 -
if (condition_1 and condition_2 and condition_3 and -
condition_4 and condition_5 and condition_6 and -
condition_7 and condition_8): -
meet_criterion = True -
else: -
meet_criterion = False -
out = { -
"rs": round(rs, 2), -
"close": cl, -
"ema_50": ema_50, -
"ema_150": ema_150, -
"ema_200": ema_200, -
"high_52week": high_52week, -
"low_52week": low_52week, -
"meet_criterion": meet_criterion -
} -
return pd.Series(out)
2.1 同步
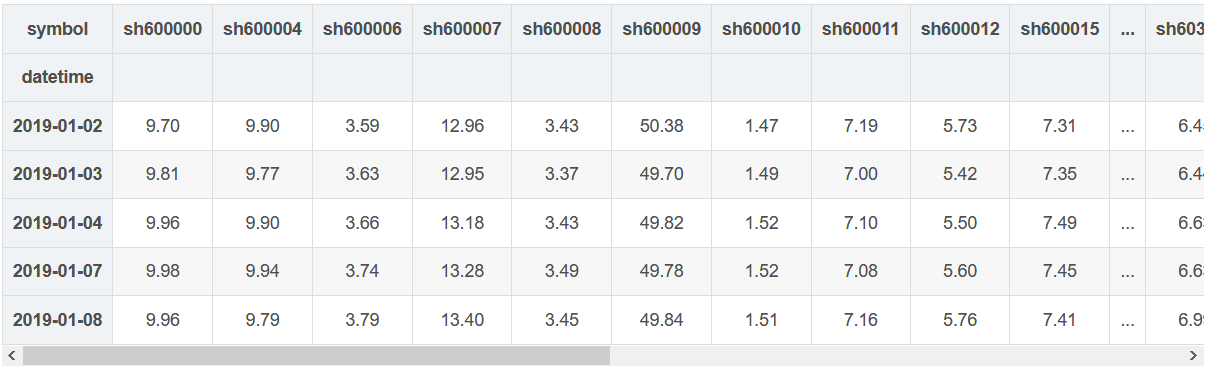
首先我们用同步的方法进行筛选,将相同的筛选函数应用于1400只股票。
-
# 仅仅筛选有足够历史数据的股票 -
symbols_to_screen = list(ohlc_joined.symbol.unique()) -
# 将数据框的格式从long-format转化为wide-format -
ohlc_joined_wide = ohlc_joined.pivot(columns="symbol", values="close").fillna(method="ffill") -
ohlc_joined_wide.head()
-
%%time -
results = ohlc_joined_wide.apply(screen, benchmark_ann_ret=benchmark_ann_ret) -
results = results.T -
CPU times: user 2.97 s, sys: 6.47 ms, total: 2.98 s -
Wall time: 2.97 s
同步计算大约需要3秒的时间,在研究阶段是可以接受的,但生产阶段不行。试想您把选股系统做成一个产品,用户选定条件后点击筛选,要等待至少3秒的时间才能得到结果,将导致非常糟糕的用户体验,接下来我们尝试用多进程来解决这个问题。
我们先看看满足条件的股票有哪些?
results.query("meet_criterion == True").sort_values("rs", ascending=False)
有389个股票符合条件,从量化交易的角度来看,似乎并没有成功挑选出有潜力的股票,当然这与参数的选择有关系。
模型是否有效并不是本文要探讨的主题(我们会在其它文章中进行探索),所以先不要过度关注这点。
2.2 多进程
接下来尝试用多进程来加速选股的过程,看是否能把筛选时间降到1秒以内。多进程计算的核心思想是分而治之,将相似的计算任务分发到不同的CPU,最后汇总结果。这里用multiprocessing实现多进程。
-
%%time -
# 定义worker函数 -
def screen_stocks(df: pd.DataFrame, benchmark_ann_ret: float) -> pd.DataFrame: -
results = df.apply(screen, benchmark_ann_ret=benchmark_ann_ret) -
return results.T -
# 拆分数据框,先尝试用四条进程,将数据框拆分为四个部分(按列划分) -
df_chunks = np.array_split(ohlc_joined_wide, 4, axis=1) -
# 用multiprocessing.Pool对象管理进程池 -
with mp.Pool(processes=4) as p: -
future_results = [p.apply_async( -
screen_stocks, kwds={"df": df, "benchmark_ann_ret": benchmark_ann_ret}) for df in df_chunks] -
results = pd.concat([r.get() for r in future_results]) -
CPU times: user 934 ms, sys: 204 ms, total: 1.14 s -
Wall time: 1.06 s
利用四条进程,我们成功把计算时间缩短到1秒左右,并且获得完全相同的结果。
results.query("meet_criterion == True").sort_values("rs", ascending=False)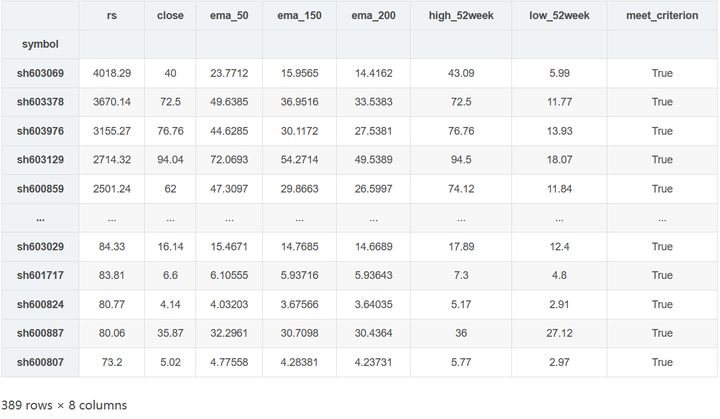
接下来测试一下进程数量和计算时间的关系,决定最优的进程数量。
-
max_processors = mp.cpu_count() -
time_used = {} -
for processors in range(1, max_processors + 1): -
df_chunks = np.array_split(ohlc_joined_wide, processors, axis=1) -
t0 = time.time() -
with mp.Pool(processors) as p: -
future_results = [p.apply_async( -
screen_stocks, kwds={"df": df, "benchmark_ann_ret": benchmark_ann_ret}) for df in df_chunks] -
results = pd.concat([r.get() for r in future_results]) -
elapsed = time.time() - t0 -
time_used[processors] = elapsed -
fig, ax = plt.subplots(figsize=(12, 7)) -
ax = sns.pointplot(x=list(time_used.keys()), y=list(time_used.values())) -
ax.set_xlabel("CPU cores") -
ax.set_ylabel("Time used(seconds)") -
ax.set_title("Computation time vs CPU Cores", loc="left")

从上图可以看出,使用两个进程时计算时间削减了一半(跟预期相符)。随着进程数逼近最大进程数,计算时间的递减不断下降,这并不难理解,因为计算机同时在处理其它任务,所以即便设置processors=12,也不可能把全部进程全部利用起来。从目前的情况来看,用4条进程处理是合适的,能够把时间从3.5秒降低至约1秒左右。
3. 总结
本文介绍了如何使用Python进行量化选股,包括:
- 从蜂鸟数据获取沪深A股的历史数据。
- 自定义函数实现MM模型的选股逻辑。
- 多进程计算,大幅减少筛选的时间。
接下来的研究方向是回溯检验,根据MM模型构建投资组合,优化筛选参数,看是否能带来超额收益。
如果喜欢我们的文章,记得点赞和收藏哦,我们会持续为大家带来数据科学和量化交易领域的精品文章。
【关于我们】
蜂鸟数据:开源金融数据库,聚合主流金融市场10000+时间序列,为广大金融从业者提供高质量的免费数据。我们的优势:1. 同时提供股票,外汇,商品期货的实时报价和历史数据;2. 提供高度统一的API接口,您可以把数据整合到自己的程序中,查看我们的API文档。
这是属于大数据的时代,蜂鸟数据的使命:用数据创造财富。


 682
682


 被折叠的 条评论
为什么被折叠?
被折叠的 条评论
为什么被折叠?
 到【灌水乐园】发言


