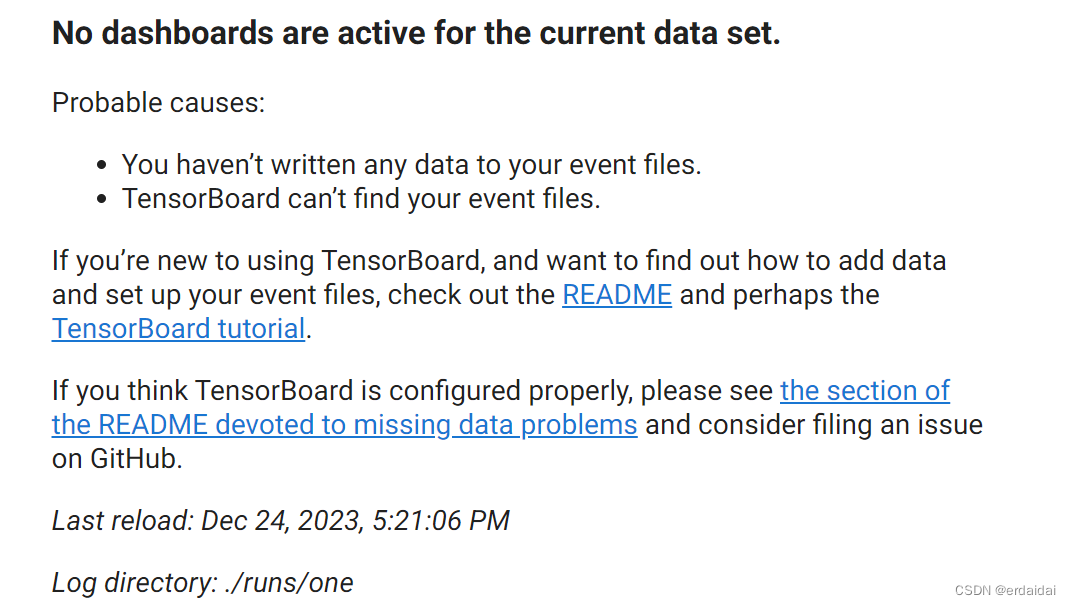
No dashboards are active for the current data set. 出现问题的原因是事件的路径未用绝对路径,tensorboard --logdir=./runs --port=6007 改为tensorboard --logdir=D:\Code\Python\Study\CL\hat-master\hat-master\run s\one --port=6007就好了


 583
583

 被折叠的 条评论
为什么被折叠?
被折叠的 条评论
为什么被折叠?
 到【灌水乐园】发言


 被折叠的 条评论
为什么被折叠?
到【灌水乐园】发言
被折叠的 条评论
为什么被折叠?
到【灌水乐园】发言


