


一、QCustomPlot介绍
QCustomPlot是一个基于Qt C++的图形库,用于绘制和数据可视化 - 制作漂亮的2D图 - 曲线图、趋势图、坐标图、柱状图等,并为实时可视化应用程序提供高性能服务。 它没有进一步的依赖关系,并有很好的文档记录。QCustomPlot可以导出为各种格式,如矢量化的PDF文件和光栅化图像,如PNG,JPG和BMP。
二、QCustomPlot的使用
首先引入qcustomplot.h和qcustomplot.cpp文件,切记一定要在pro中需要添加:
QT += printsupport然后开始紧张刺激的编码了:
#include "qcustomplot.h"
void QRtCurv::draw(){
QCustomPlot *pCustomPlot = new QCustomPlot(this);
pCustomPlot->resize(650, 500);
// 可变数组存放绘图的坐标的数据,分别存放x和y坐标的数据,101为数据长度
QVector<double> x(101), y(101),z(101), t(101),q(101), w(101);
QVector<double> e(101), r(101);
// 添加数据,这里演示y = x^3,为了正负对称,x从-10到+10
for (int i = 0; i < 101; ++i)
{
z[i] = i - 10;
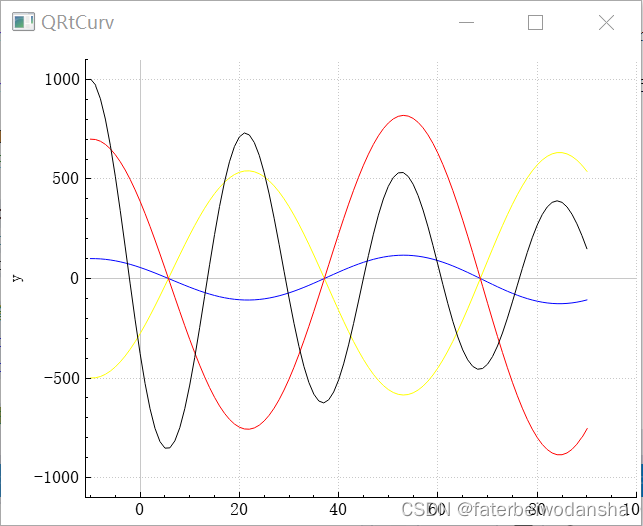
t[i] = qExp(i/400.0)*qCos(i/10.0)*-500; // 第一条曲线:y0衰减cos
}
for (int i = 0; i < 101; ++i)
{
x[i] = i- 10;
y[i] = qExp(i/400.0)*qCos(i/10.0)*100; // 第一条曲线:y0衰减cos
}
for (int i = 0; i < 101; ++i)
{
q[i] = i - 10;
w[i] = qExp(i/400.0)*qCos(i/10.0)*700; // 第一条曲线:y0衰减cos
}
for (int i=0; i<101; ++i)
{
e[i] = -10+i;
r[i] = qExp(-i/100.0)*qCos(i/5.00)*1000;
}
// 向绘图区域QCustomPlot添加一条曲线
QCPGraph *pGraph = pCustomPlot->addGraph();
// 添加数据
pCustomPlot->graph(0)->setData(x, y);
//第二条曲线
pCustomPlot->addGraph();
pCustomPlot->graph(1)->setPen(QPen(Qt::yellow)); // 曲线的颜色
pCustomPlot->graph(1)->setData(z,t);
pCustomPlot->rescaleAxes(true);
// 第三条曲线
pCustomPlot->addGraph();
pCustomPlot->graph(2)->setPen(QPen(Qt::red)); // 曲线的颜色
pCustomPlot->graph(2)->setData(q,w);
pCustomPlot->rescaleAxes(true);
//第四条曲线
pCustomPlot->addGraph();
pCustomPlot->graph(3)->setPen(QPen(Qt::black)); // 曲线的颜色
pCustomPlot->graph(3)->setData(e, r);
pCustomPlot->graph(1)->rescaleAxes(true);
pCustomPlot->xAxis->setLabel("x");
pCustomPlot->yAxis->setLabel("y");
// 设置坐标轴显示范围,否则只能看到默认范围
pCustomPlot->xAxis->setRange(-11, 100);
pCustomPlot->yAxis->setRange(-1100, 1100);
.......
}再来调试查看运行结果了


 7158
7158


 被折叠的 条评论
为什么被折叠?
被折叠的 条评论
为什么被折叠?
 到【灌水乐园】发言


