


本文分享机器学习工具Scikit-Learn强力扩展yellowbrick。
通过几行代码可视化
特征值、模型、模型评估等,帮助更便捷的的选择机器学习模型和调参,依赖Matplotlib和Scikit-Learn。
本文目录

yellowbrick安装
# 清华源加速安装
pip install yellowbrick -i https://pypi.tuna.tsinghua.edu.cn/simple
yellowbrick核心“武器” - Visualizers
Visualizers可以理解为一个scikit-learn的估计器(estimator)对象,但是附加了可视化的属性,使用过程与使用scikit-learn模型类似:
导入特定的visualizers;
实例化visualizers;
拟合visualizers;
可视化展示。
yellowbrick实例快速上手
展示ROC曲线,评估不同模型效果
import matplotlib.pyplot as plt

plt.figure(dpi=120)
from sklearn.linear_model import RidgeClassifier
from sklearn.model_selection import train_test_split
from sklearn.preprocessing import OrdinalEncoder, LabelEncoder

from yellowbrick.classifier import ROCAUC
from yellowbrick.datasets import load_game

# 导入数据
X, y = load_game()

# 数据转换
X = OrdinalEncoder().fit_transform(X)
y = LabelEncoder().fit_transform(y)

# 构建测试集和训练集
X_train, X_test, y_train, y_test = train_test_split(X, y, random_state=42)

# 实例化分类模型和visualizer
model = RidgeClassifier()
visualizer = ROCAUC(model, classes=["win", "loss", "draw"])

visualizer.fit(X_train, y_train)  # 拟合visualizer
visualizer.score(X_test, y_test)  # 评价模型在训练集上效果
visualizer.show()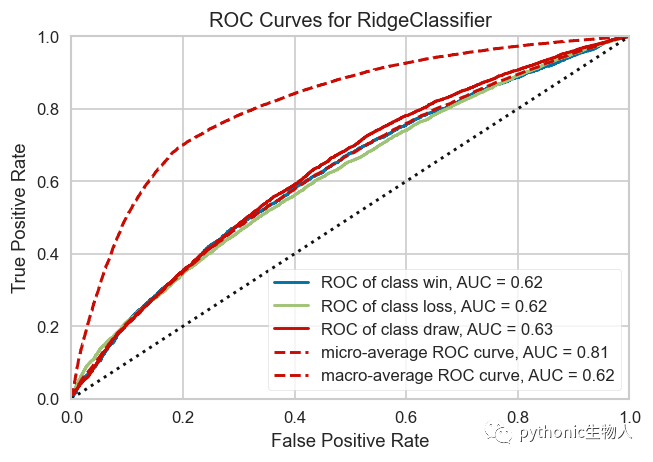
特征工程中,展示PCA降维效果
import matplotlib.pyplot as plt

plt.figure(dpi=120)
from yellowbrick.features import PCA

X, y = load_credit()
classes = ['account in default', 'current with bills']

visualizer = PCA(scale=True, projection=3, classes=classes)
visualizer.fit_transform(X, y)
visualizer.show()
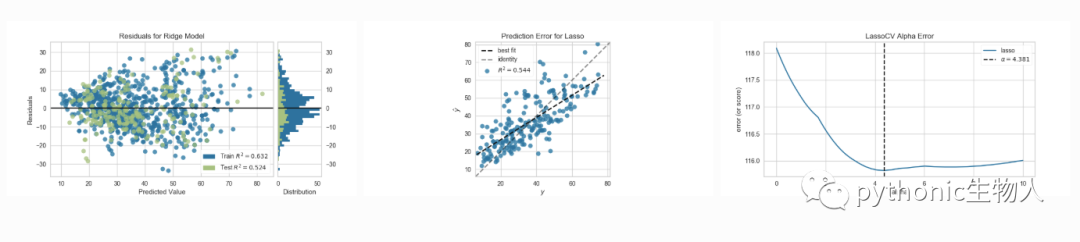
回归模型中,展示预测值和真实值之间的残差,Q-Q plot评估模型效果。
from sklearn.linear_model import Ridge
from sklearn.model_selection import train_test_split

from yellowbrick.datasets import load_concrete
from yellowbrick.regressor import ResidualsPlot

# 导入数据
X, y = load_concrete()

# 构建训练集、测试集
X_train, X_test, y_train, y_test = train_test_split(X, y, test_size=0.2, random_state=42)

# 实例化模型和visualizer
model = Ridge()
visualizer = ResidualsPlot(model, hist=False, qqplot=True)
visualizer.fit(X_train, y_train)
visualizer.score(X_test, y_test)
visualizer.show()
展示Lasso回归模型效果
import matplotlib.pyplot as plt

plt.figure(dpi=120)
from sklearn.linear_model import Lasso
from yellowbrick.datasets import load_bikeshare
from yellowbrick.regressor import prediction_error


X, y = load_bikeshare()
visualizer = prediction_error(Lasso(), X, y)#一行代码即可展示,方不方便
更多实例见下一节~~
yellowbrick常用的Visualizers
特征展示(Feature Visualization)
Rank Features: pairwise ranking of features to detect relationships
Parallel Coordinates: horizontal visualization of instances
Radial Visualization: separation of instances around a circular plot
PCA Projection: projection of instances based on principal components
Manifold Visualization: high dimensional visualization with manifold learning
Joint Plots: direct data visualization with feature selection

分类模型展示(Classification Visualization)
Class Prediction Error: shows error and support in classification
Classification Report: visual representation of precision, recall, and F1
ROC/AUC Curves: receiver operator characteristics and area under the curve
Precision-Recall Curves: precision vs recall for different probability thresholds
Confusion Matrices: visual description of class decision making
Discrimination Threshold: find a threshold that best separates binary classes

回归模型展示(Regression Visualization)
Prediction Error Plot: find model breakdowns along the domain of the target
Residuals Plot: show the difference in residuals of training and test data
Alpha Selection: show how the choice of alpha influences regularization
Cook’s Distance: show the influence of instances on linear regression
聚类模型展示(Clustering Visualization)
K-Elbow Plot: select k using the elbow method and various metrics
Silhouette Plot: select k by visualizing silhouette coefficient values
Intercluster Distance Maps: show relative distance and size/importance of clusters

模型选择(Model Selection Visualization)
Validation Curve: tune a model with respect to a single hyperparameter
Learning Curve: show if a model might benefit from more data or less complexity
Feature Importances: rank features by importance or linear coefficients for a specific model
Recursive Feature Elimination: find the best subset of features based on importance

目标展示(Target Visualization)
Balanced Binning Reference: generate a histogram with vertical lines showing the recommended value point to bin the data into evenly distributed bins
Class Balance: see how the distribution of classes affects the model
Feature Correlation: display the correlation between features and dependent variables

文本展示(Text Visualization)
Term Frequency: visualize the frequency distribution of terms in the corpus
t-SNE Corpus Visualization: use stochastic neighbor embedding to project documents
Dispersion Plot: visualize how key terms are dispersed throughout a corpus
UMAP Corpus Visualization: plot similar documents closer together to discover clusters
PosTag Visualization: plot the counts of different parts-of-speech throughout a tagged corpus

yellowbrick图形个性化设置
https://www.scikit-yb.org/en/latest/index.html
-END-
👇点击阅读更多👇 关注「pythonic生物人」
加微信群:扫码备注学习
|


 799
799


 被折叠的 条评论
为什么被折叠?
被折叠的 条评论
为什么被折叠?
 到【灌水乐园】发言


