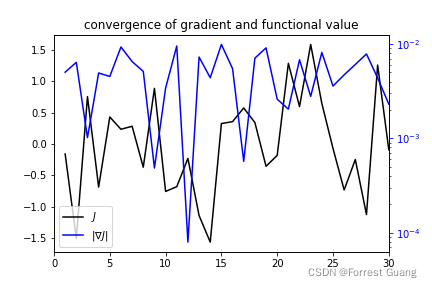
twinx()用法
import matplotlib.pyplot as plt
import numpy as np
max_iters = 30
obj_value = np.random.randn(max_iters,1)
grad = np.random.rand(max_iters,1)*1e-2
iters = []
for i in range(len(grad)):
iters.append(i + 1)
fig = plt.figure()
ax1 = fig.add_subplot(111)
line1, = ax1.plot(iters,obj_value,'black',label=r'$J$')
ax1.tick_params(axis='y',colors = 'black')
ax1.set_title('convergence of gradient and functional value')
ax2 = ax1.twinx()
line2, = ax2.plot(iters,grad,'blue',label = r'$\|\nabla J\|$')
ax2.tick_params(axis='y',colors = 'blue')
plt.yscale('log')
ax2.set_xlim([0, max_iters])
ax2.set_xlabel('iters')
ax_list = (line1,line2)
plt.legend((line1,line2),(r'$J$',r'$\|\nabla J\|$'))
plt.savefig('convergence3.png')
plt.show()
3Dgif
import numpy as np
import matplotlib.pyplot as plt
from matplotlib import cm
import matplotlib as mpl
import torch
import matplotlib.animation as animation
def UU(x):
x0 = x[:,0]
x1 = x[:,1]
beta = x[:,2]
return np.sin(x0)*np.sin(np.pi*x1)*np.exp(beta)
def UUpred(x):
x0 = x[:,0]
x1 = x[:,1]
beta = x[:,2]
return np.sin(x0)*np.sin(np.pi*x1 + beta)*np.exp(beta)
class INSET():
def __init__(self,bound,nx,prob):
self.prob = prob
self.dim = 2
self.area = (bound[0,1] - bound[0,0])*(bound[1,1] - bound[1,0])
self.hx = [(bound[0,1] - bound[0,0])/nx[0],(bound[1,1] - bound[1,0])/nx[1]]
self.size = nx[0]*nx[1]
self.X = np.zeros([self.size,self.dim])
for j in range(nx[1]):
for i in range(nx[0]):
self.X[j*nx[0] + i,0] = bound[0,0] + (i + 0.5)*self.hx[0]
self.X[j*nx[0] + i,1] = bound[1,0] + (j + 0.5)*self.hx[1]
bound = np.array([0,1.0,0,1.0]).reshape(2,2)
size_te = 10
nx = [size_te,size_te]
prob = 1
inset = INSET(bound,nx,prob)
beta_list = np.linspace(0,1,10).squeeze()
x = np.linspace(0,1,size_te)
y = np.linspace(0,1,size_te)
X,Y = np.meshgrid(x,y)
fig = plt.figure(figsize=(15,5))
def animate(i):
beta = beta_list[i]
x = np.hstack([inset.X,0*inset.X[:,0:1] + beta])
u_acc = UU(x).reshape(nx[0],nx[1])
ax = fig.add_subplot(1, 3, 1, projection='3d')
ax.set_title('u_acc of prob = %d:test grid:%d'%(prob,size_te))
ax.plot_surface(X, Y, u_acc, cmap='turbo', linewidth=1, antialiased=False)
ax.view_init(20, -120)
u_pred = UUpred(x).reshape(nx[0],nx[1])
ax = fig.add_subplot(1, 3, 2, projection='3d')
ax.set_title('u_pred of prob = %d:test grid:%d'%(prob,size_te))
ax.plot_surface(X, Y, u_pred, cmap='jet', linewidth=1, antialiased=False)
ax.view_init(20, -120)
err = u_acc - u_pred
ax = fig.add_subplot(1, 3, 3, projection='3d')
ax.set_title('err of prob = %d:test grid:%d'%(prob,size_te))
ax.plot_surface(X, Y, err, cmap='jet', linewidth=1, antialiased=False)
ax.view_init(20, -120)
plt.suptitle(r'$\beta=%.2f$'%(beta))
ani = animation.FuncAnimation(fig,animate,len(beta_list),interval=100)
ani.save("3D.gif",writer='pillow')
plt.show()
复杂区域gif
import numpy as np
import matplotlib.pyplot as plt
from matplotlib import cm
import matplotlib.animation as animation
n = 64
num_line = 100
def obj(te_data):
x0 = te_data[:,0]
x1 = te_data[:,1]
para1 = te_data[:,2]
para2 = te_data[:,3]
return np.sin(x0)*np.exp(x1) + para1**2 - np.cos(para2)
def meshgrid(mu1,mu2):
x0 = np.linspace(0,2,2*n)
x1 = np.linspace(0,1,n)
x0, x1 = np.meshgrid(x0,x1)
ind = ((x0-1.5)**2 + (x1-0.5)**2 >= mu1**2)
x0 = x0[ind].reshape(-1,1)
x1 = x1[ind].reshape(-1,1)
x0 = x0.flatten()
x1 = x1.flatten()
return x0,x1
def data_set(mu1,mu2,x0,x1):
x0 = x0.reshape(-1,1)
x1 = x1.reshape(-1,1)
te_data_tra =np.hstack([x0,x1])
te_data = np.zeros([te_data_tra.shape[0],4])
te_data[:,0:2] = te_data_tra
te_data[:,2:3] = mu1
te_data[:,3:4] = mu2
return te_data
def FF(mu1,mu2,x0,x1):
te_data = data_set(mu1,mu2,x0,x1)
return obj(te_data)
M = 4
mu1_list = np.linspace(0.05,0.45,M)
mu2_list = np.linspace(0.5,2.5,M)
mu_list = []
for i in range(mu1_list.shape[0]):
for j in range(mu2_list.shape[0]):
mu_list.append([mu1_list[i],mu2_list[j]])
fig, ax = plt.subplots(1,1,figsize=(12,6))
def animate(k):
mu1,mu2 = mu_list[k]
x0,x1 = meshgrid(mu1,mu2)
u = FF(mu1,mu2,x0,x1)
ax_animal = ax.tricontourf(x0, x1, u, num_line, cmap='rainbow')
ax.add_artist(plt.Circle((1.5,0.5), mu1, fill=True, color='white'))
ax.set_title(r'$\mu_1=%.3f, \mu_2=%.3f,DALNN:u$'%(mu1,mu2),fontsize=15)
ani = animation.FuncAnimation(fig,animate,len(mu_list),interval=100)
ani.save("ZZtest.gif",writer='pillow')
plt.show()
圆形区域gif
import numpy as np
import matplotlib.pyplot as plt
from matplotlib import cm
import matplotlib as mpl
import matplotlib.animation as animation
n = 64
num_line = 100
def polar(r,theta):
return np.hstack([(r*np.cos(theta)).reshape(-1,1), (r*np.sin(theta)).reshape(-1,1)])
def obj(te_data):
x0 = te_data[:,0]
x1 = te_data[:,1]
para1 = te_data[:,2]
return np.sin(x0)*np.exp(x1) + np.exp(para1)
beta_test = np.linspace(0,0.128,20)
azimuths = np.radians(np.linspace(0, 360, 500))
zeniths = np.linspace(0, 1, 500)
r, theta = np.meshgrid(zeniths, azimuths)
norm = mpl.colors.Normalize(vmin=-12, vmax=12)
fig = plt.figure()
ax = plt.subplot(projection='polar')
def animate(k):
beta = beta_test[k]
inp = polar(r,theta)
te_data = np.hstack([inp,0*inp[:,0:1] + beta])
u = obj(te_data).reshape(azimuths.size, zeniths.size)
ax.clear()
ax.contourf(theta, r, u, num_line, norm=norm, alpha=1, cmap='rainbow')
ax.set_title(r'$\beta=%.3f$'%(beta))
ax.set_xlabel('x')
ax.axis('off')
ani = animation.FuncAnimation(fig,animate,beta_test.shape[0],interval=100)
ani.save("polar.gif",writer='pillow')
plt.show()
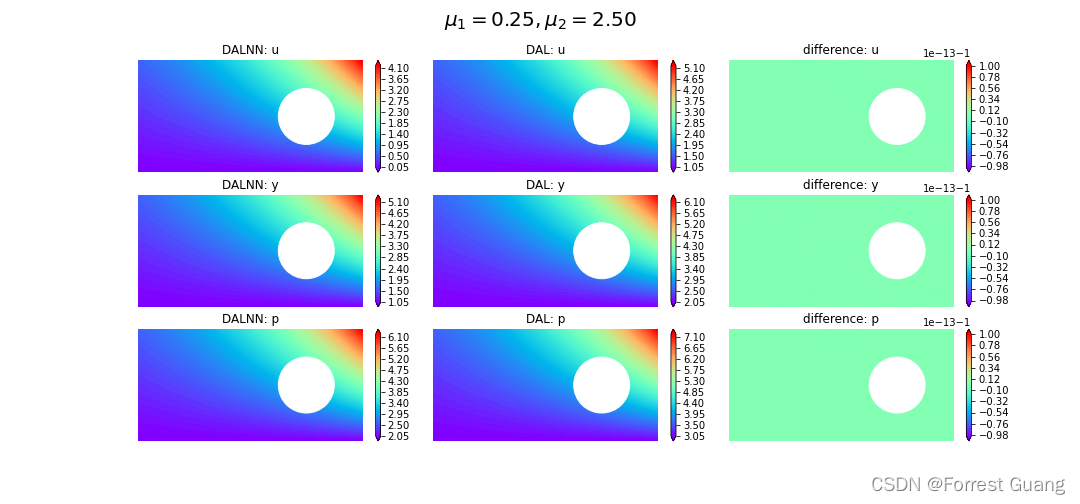
复杂区域多图
import numpy as np
import matplotlib.pyplot as plt
from matplotlib import cm
import matplotlib as mpl

mu1 = 0.25
mu2 = 2.5


num_line = 100
x0 = np.linspace(0,2,2*n)
x1 = np.linspace(0,1,n)
x0, x1 = np.meshgrid(x0,x1)

ind = ((x0-1.5)**2 + (x1-0.5)**2 >= mu1**2)
x0 = x0[ind].reshape(-1,1)
x1 = x1[ind].reshape(-1,1)
te_data_tra =np.hstack([x0,x1])
te_data = np.zeros([te_data_tra.shape[0],4])
te_data[:,0:2] = te_data_tra
te_data[:,2:3] = mu1
te_data[:,3:4] = mu2

def obj(te_data):
    x0 = te_data[:,0]
    x1 = te_data[:,1]
    mu1 = te_data[:,2]
    mu2 = te_data[:,3]

    return np.exp(x0)*x1*np.exp(np.sin(mu1) + np.cos(mu2))
x0 = x0.flatten()
x1 = x1.flatten()

u = obj(te_data)
y = u + 1
p = u + 2
u_np = u + 1
y_np = u + 2
p_np = u + 3
fig, ax = plt.subplots(3,3,figsize=(15,7))

for i in range(3):
    for j in range(3):
        ax[i,j].axis('equal')
        ax[i,j].set_xlim([0,2])
        ax[i,j].set_ylim([0,1])
        ax[i,j].axis('off')

ax00 = ax[0,0].tricontourf(x0, x1, u, num_line, cmap='rainbow',extend = 'both')
ax[0,0].add_artist(plt.Circle((1.5,0.5), mu1, fill=True, color='white'))
fig.colorbar(ax00,ax=ax[0,0],fraction = 0.023,pad = 0.04)
ax[0,0].set_title('DALNN: u')

ax10 = ax[1,0].tricontourf(x0, x1, y, num_line, alpha=1, cmap='rainbow',extend = 'both')
ax[1,0].add_artist(plt.Circle((1.5,0.5), mu1, fill=True, color='white'))
fig.colorbar(ax10,ax=ax[1,0],fraction = 0.023,pad = 0.04)
ax[1,0].set_title('DALNN: y')

ax20 = ax[2,0].tricontourf(x0, x1, p, num_line, alpha=1, cmap='rainbow',extend = 'both')
ax[2,0].add_artist(plt.Circle((1.5,0.5), mu1, fill=True, color='white'))
fig.colorbar(ax20,ax=ax[2,0],fraction = 0.023,pad = 0.04)
ax[2,0].set_title('DALNN: p')


ax01 = ax[0,1].tricontourf(x0, x1, u_np, num_line, cmap='rainbow',extend = 'both')
ax[0,1].add_artist(plt.Circle((1.5,0.5), mu1, fill=True, color='white'))
fig.colorbar(ax01,ax=ax[0,1],fraction = 0.023,pad = 0.04)
ax[0,1].set_title('DAL: u')

ax11 = ax[1,1].tricontourf(x0, x1, y_np, num_line, alpha=1, cmap='rainbow',extend = 'both')
ax[1,1].add_artist(plt.Circle((1.5,0.5), mu1, fill=True, color='white'))
fig.colorbar(ax11,ax=ax[1,1],fraction = 0.023,pad = 0.04)
ax[1,1].set_title('DAL: y')

ax21 = ax[2,1].tricontourf(x0, x1, p_np, num_line, alpha=1, cmap='rainbow',extend = 'both')
ax[2,1].add_artist(plt.Circle((1.5,0.5), mu1, fill=True, color='white'))
fig.colorbar(ax21,ax=ax[2,1],fraction = 0.023,pad = 0.04)
ax[2,1].set_title('DAL: p')


ax02 = ax[0,2].tricontourf(x0, x1, u-u_np, num_line, cmap='rainbow',extend = 'both')
ax[0,2].add_artist(plt.Circle((1.5,0.5), mu1, fill=True, color='white'))
fig.colorbar(ax02,ax=ax[0,2],fraction = 0.023,pad = 0.04)
ax[0,2].set_title('difference: u')

ax12 = ax[1,2].tricontourf(x0, x1, y-y_np, num_line, alpha=1, cmap='rainbow',extend = 'both')
ax[1,2].add_artist(plt.Circle((1.5,0.5), mu1, fill=True, color='white'))
fig.colorbar(ax12,ax=ax[1,2],fraction = 0.023,pad = 0.04)
ax[1,2].set_title('difference: y')

ax22 = ax[2,2].tricontourf(x0, x1, p-p_np, num_line, alpha=1, cmap='rainbow',extend = 'both')
ax[2,2].add_artist(plt.Circle((1.5,0.5), mu1, fill=True, color='white'))
fig.colorbar(ax22,ax=ax[2,2],fraction = 0.023,pad = 0.04)
ax[2,2].set_title('difference: p')

plt.suptitle(r'$\mu_1=%.2f, \mu_2=%.2f$'%(mu1,mu2),fontsize=20)
plt.savefig('mu.png')
fig.tight_layout()
plt.show()
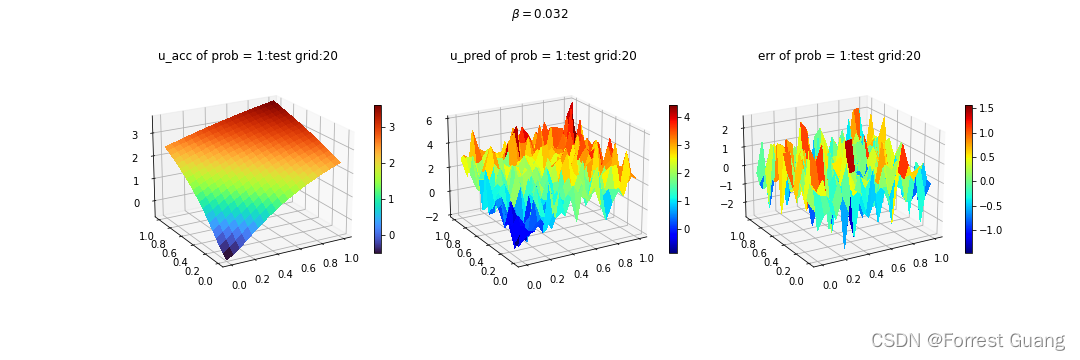
矩形区域3D
import numpy as np
import matplotlib.pyplot as plt
from matplotlib import cm
import matplotlib as mpl
def UU(X, order,prob):
if prob==1:
temp = 10*(X[:,0]+X[:,1])**2 + (X[:,0]-X[:,1])**2 + 0.5
if order[0]==0 and order[1]==0:
return np.log(temp)
if order[0]==1 and order[1]==0:
return temp**(-1) * (20*(X[:,0]+X[:,1]) + 2*(X[:,0]-X[:,1]))
if order[0]==0 and order[1]==1:
return temp**(-1) * (20*(X[:,0]+X[:,1]) - 2*(X[:,0]-X[:,1]))
if order[0]==2 and order[1]==0:
return - temp**(-2) * (20*(X[:,0]+X[:,1])+2*(X[:,0]-X[:,1])) ** 2 \
+ temp**(-1) * (22)
if order[0]==1 and order[1]==1:
return - temp**(-2) * (20*(X[:,0]+X[:,1])+2*(X[:,0]-X[:,1])) \
* (20*(X[:,0]+X[:,1])-2*(X[:,0]-X[:,1])) \
+ temp**(-1) * (18)
if order[0]==0 and order[1]==2:
return - temp**(-2) * (20*(X[:,0]+X[:,1])-2*(X[:,0]-X[:,1])) ** 2 \
+ temp**(-1) * (22)
class INSET():
def __init__(self,bound,nx,prob):
self.prob = prob
self.dim = 2
self.area = (bound[0,1] - bound[0,0])*(bound[1,1] - bound[1,0])
self.hx = [(bound[0,1] - bound[0,0])/nx[0],(bound[1,1] - bound[1,0])/nx[1]]
self.size = nx[0]*nx[1]
self.X = np.zeros([self.size,self.dim])
for j in range(nx[1]):
for i in range(nx[0]):
self.X[j*nx[0] + i,0] = bound[0,0] + (i + 0.5)*self.hx[0]
self.X[j*nx[0] + i,1] = bound[1,0] + (j + 0.5)*self.hx[1]
self.u_acc = UU(self.X,[0,0],prob).reshape(-1,1)
self.u_pred = UU(self.X,[0,0],prob).reshape(-1,1) + np.random.randn(self.u_acc.shape[0],1)
bound = np.array([0,1.0,0,1.0]).reshape(2,2)
size_te = 20
nx = [size_te,size_te]
prob = 1
inset = INSET(bound,nx,prob)
u_acc = inset.u_acc.reshape(nx[0],nx[1])
u_pred = inset.u_pred.reshape(nx[0],nx[1])
x = np.linspace(0,1,size_te)
y = np.linspace(0,1,size_te)
X,Y = np.meshgrid(x,y)
err = u_acc - u_pred
print(X.shape,Y.shape,err.shape)
fig = plt.figure(figsize=(15,5))
ax = fig.add_subplot(1, 3, 1, projection='3d')
ax.set_title('u_acc of prob = %d:test grid:%d'%(prob,size_te))
surf = ax.plot_surface(X, Y, u_acc, cmap='turbo', linewidth=1, antialiased=False)
plt.colorbar(surf,ax=ax,fraction=0.03)
ax.view_init(20, -120)
ax = fig.add_subplot(1, 3, 2, projection='3d')
ax.set_title('u_pred of prob = %d:test grid:%d'%(prob,size_te))
surf = ax.plot_surface(X, Y, u_pred, cmap='jet', linewidth=1, antialiased=False)
plt.colorbar(surf,ax=ax,fraction=0.03)
ax.view_init(20, -120)
ax = fig.add_subplot(1, 3, 3, projection='3d')
ax.set_title('err of prob = %d:test grid:%d'%(prob,size_te))
surf = ax.plot_surface(X, Y, err, cmap='jet', linewidth=1, antialiased=False)
plt.colorbar(surf,ax=ax,fraction=0.03)
ax.view_init(20, -120)
plt.suptitle(r'$\beta=0.032$')
plt.savefig('3D.png')


 2043
2043


 被折叠的 条评论
为什么被折叠?
被折叠的 条评论
为什么被折叠?
 到【灌水乐园】发言


