


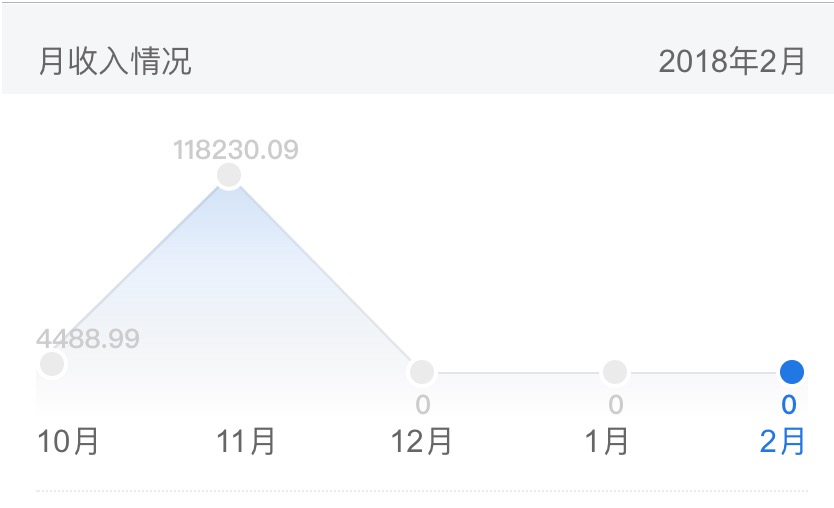
之前做移动端项目的时候,有要显示图表的需求, 但是由于设计师设计的太漂亮, 一般的第三方控件不加修改的话都不太满足, 如果引进了的话, 要修改的东西太多了, 也不好修改,废话不多说, 先上图:
至于怎么实现了,其实也蛮简单的,canvas自己一个个画的。
以下是源码:
/**
 * Created by freeson on 2017/10/24.
 */

export const lineChart = {

    circleDotOuterRadius: 8,
    circleDotInnerRadius: 6,
    dotX: [],
    dotY: [],
    config: null,
    selectedIndex: 0,
    screenWidth: 0,
    charMaxHeight: 0,

    onDestroyed: function () {
        this.dotX = [];
        this.dotY = [];
        this.config = null;
    },


    renderLineChart: function () {
        var context = this.config.context;
        context.clearRect(0, 0, this.config.width, this.config.height);
        this.drawLine(context);
        this.drawPath(context);
        var linearGradient = context.createLinearGradient(0, this.config.height, 0, 0);//图表的渐变颜色,从透明到设定值
        linearGradient.addColorStop(0.0, "transparent");
        linearGradient.addColorStop(0.5, 'rgba(53,130,226,0.1)');
        linearGradient.addColorStop(1, 'rgba(53,130,226,0.3)');
        context.fillStyle = linearGradient;
        context.fill();
        this.drawCircleDot(context);
        this.drawText(context);
    },

    //这个方法是画图表的路径
    drawPath(context) {
        context.beginPath();
        for (let i = 0; i < 7; ++i) {
            if (i === 0) {
                context.moveTo(this.dotX[i], this.dotY[i]);
            } else {
                context.lineTo(this.dotX[i], this.dotY[i]);
            }
        }
        context.closePath();
    },

    //这个方法是画最外面那条曲线
    drawLine(context) {
        context.strokeStyle = "#ebebeb";
        context.lineWidth = 1;
        for (let i = 1; i < 6; ++i) {
            if (i === 1) {
                context.moveTo(this.dotX[i] + 0.5, this.dotY[i] + 0.5);
            } else {
                context.lineTo(this.dotX[i] + 0.5, this.dotY[i] + 0.5);
                context.stroke();
            }
        }
    },

    //这个方法是画一个月份的圆点
    drawCircleDot(context) {
        let x = 0, y = 0;
        for (let i = 1; i < 6; ++i) {
            x = this.dotX[i];
            y = this.dotY[i];
            if (i === 1) {
                x = this.circleDotOuterRadius;
            } else if (i === 5) {
                x = x - this.circleDotOuterRadius;
            }
            context.fillStyle = "#ffffff";
            context.beginPath();
            context.arc(x, y, this.circleDotOuterRadius, 0, 2 * Math.PI, true);
            context.closePath();
            context.fill();
            if (this.config.selectedIndex + 1 == i) {
                context.fillStyle = "#1874e6";
            } else {
                context.fillStyle = "#ebebeb";
            }
            context.beginPath();
            context.arc(x, y, this.circleDotInnerRadius, 0, 2 * Math.PI, true);
            context.closePath();
            context.fill();
        }
    },

    //这个方法是画金额,就是如果月份金额是属于上升,金额画在圆点上方, 如果是下降的画, 画在圆点下方
    drawText(context) {
        if (!this.screenWidth) {
            let app = document.getElementById('app');
            if (app) {
                this.screenWidth = app.clientWidth;
            } else {
                this.screenWidth = window.screen.width;
            }
        }
        let font = this.screenWidth * 24 / 750;
        context.font = 'bold ' + font + 'px sans-serif';
        let data = this.config.data;
        let x = 0, y = 0;
        let beforeTextIsBottom = false;
        for (let i = 0; i < data.length; ++i) {
            x = this.dotX[i + 1];
            y = this.dotY[i + 1];
            let tempBefore = data[i - 1] * 100;
            let temp = data[i] * 100;
            if (i != 0 && temp < tempBefore) {
                y = y + Math.floor(font) + 8;
                beforeTextIsBottom = true;
                if (y > this.charMaxHeight) {
                    y = y - 8 - Math.floor(font) - 8;
                    // beforeTextIsBottom = false;
                }
            } else {
                if (i > 1 && temp == tempBefore) {
                    if (beforeTextIsBottom) {
                        y = y + Math.floor(font) + 8;
                        beforeTextIsBottom = true;
                    } else {
                        beforeTextIsBottom = false;
                        y = y - 8;
                    }
                } else {
                    beforeTextIsBottom = false;
                    y = y - 8;
                }
            }
            let len = String(data[i]).length;
            if (i != 0) {
                if (i === data.length - 1) {
                    x -= (font / 2) * len + font / 2;
                } else {
                    if (len == 1) {
                        x -= 3.5;
                    } else {
                        x -= 7 * (len - 1) / 2;
                    }
                }
            } else {
                if (len == 1) {
                    x += 3.5;
                }
            }

            if (this.config.selectedIndex == i) {
                context.fillStyle = "#1874e6";
            } else {
                context.fillStyle = "#cccccc";
            }

            context.fillText(String(data[i]), x, y);
        }
    },

    //这个方法是构造数据
    buildXYData(config) {
        let canvas = config.canvas;
        canvas.width = canvas.clientWidth;
        canvas.height = canvas.clientHeight;
        let context = canvas.getContext("2d");
        let width = canvas.width, height = canvas.height;
        config.width = width;
        config.height = height;
        if (window.devicePixelRatio) {
            canvas.height = canvas.height * window.devicePixelRatio;
            canvas.width = canvas.width * window.devicePixelRatio;
            context.scale(window.devicePixelRatio, window.devicePixelRatio);
        }

        config.context = context;
        this.config = config;

        this.dotX[0] = 0;
        this.dotX[1] = 0;
        this.dotX[2] = width * 0.25;
        this.dotX[3] = width * 0.5;
        this.dotX[4] = width * 0.75;
        this.dotX[5] = width;
        this.dotX[6] = width;

        this.dotY = [];
        this.dotY.push(height);//起点
        this.charMaxHeight = height;
        for (let i = 1; i < 6; ++i) {//基于底线(数据全为0)初始化数据
            this.dotY.push(height - 8);
        }
        this.dotY.push(height);//结束点

        let data = config.data;
        let max = 0, maxIndex = 0;
        let hasZero = false, zeroIndex = 0;
        for (let j = 0; j < data.length; ++j) {
            let temp = data[j] * 100;
            if (j != 0 && temp == 0) {
                hasZero = true;
                zeroIndex = j;
            }
            if (temp > max) {
                max = temp;
                maxIndex = j;
            }
        }
        if (max == 0) {
            return;
        }
        max /= 100;
        let maxPercentHeight = height * 0.84 - 8;
        if (hasZero) {
            let allZeroBefore = true;
            for (let k = 0; k < zeroIndex; ++k) {
                if (data[k] != 0) {
                    allZeroBefore = false;
                    break;
                }
            }
            if (!allZeroBefore) {
                maxPercentHeight = height * 0.68;
            }
        } else {
            for (let l = 1; l < data.length; ++l) {
                if (data[l] < data[l - 1]) {
                    maxPercentHeight = height * 0.68;
                    break;
                }
            }
        }
        let topDotY = height * 0.16;
        for (let n = 0; n < data.length; ++n) {
            if (n == maxIndex) {
                this.dotY[maxIndex + 1] = topDotY;//最高值的顶部,预留圆圈和文字(16%)
            } else {
                let percentHeight = ((data[n] / max) * maxPercentHeight).toFixed(2);
                this.dotY[n + 1] = parseInt((maxPercentHeight - percentHeight + topDotY).toFixed(2));
            }
        }
    },

    render: function (config) {
        this.buildXYData(config);
        this.renderLineChart();
    },

    //点击月份,更新选中状态
    updateSelected(selectedIndex) {
        this.config.selectedIndex = selectedIndex;
        this.renderLineChart();
    }

}
以下是xml布局(用的是vue框架):
<div class="line-container">
                    <div class="line-chart-container">
                        <canvas id="line-chart" class="line-chart"></canvas>
                    </div>
                    <div class="bottom-month-container" v-if="list.length!=0">
                        <span @click="monthClick(0)" :class="{blue:selectedMonth==0}">{{list[0].bar}}</span>
                        <div class="month-other-container">
                            <div><span @click="monthClick(1)" :class="{blue:selectedMonth==1}">{{list[1].bar}}</span>
                            </div>
                            <div><span @click="monthClick(2)" :class="{blue:selectedMonth==2}">{{list[2].bar}}</span>
                            </div>
                            <div><span @click="monthClick(3)" :class="{blue:selectedMonth==3}">{{list[3].bar}}</span>
                            </div>
                            <div><span @click="monthClick(4)" :class="{blue:selectedMonth==4}">{{list[4].bar}}</span>
                            </div>
                        </div>
                    </div>
                </div>
以下是用到到css:
            .line-container {
                height: pxToRem(300);
                position: relative;
                .line-chart-container {
                    height: pxToRem(260);
                    /*padding-bottom: pxToRem(30);*/
                    .line-chart {
                        width: 100%;
                        height: 100%;
                    }
                }
                .bottom-month-container {
                    font-size: pxToRem(28);
                    color: $grey;
                    position: relative;
                    display: flex;
                    .month-other-container {
                        flex: 1;
                        div {
                            float: left;
                            width: 25%;
                            text-align: right;
                        }
                    }

                    .blue {
                        color: $dark-blue;
                    }
                }
            }
以下在vue里面调用:
drawLineChart() {
                let canvas = document.getElementById("line-chart");
                let data = [];
                for (let i = 0; i < this.list.length; ++i) {
                    data.push(this.list[i].income);
                }
                lineChart.render({
                    canvas: canvas,
                    data: data,
                    selectedIndex: this.selectedMonth,//默认选中哪个月份
                });
            },
代码就是这么简单了, 试过很多中情况了,数据还能显示正确,当然可能还有我未发现的bug,大家看着修改就好, 很简单。
这个是用在移动端的, 在pc端大小可能要自己去调整。


 363
363

 被折叠的 条评论
为什么被折叠?
被折叠的 条评论
为什么被折叠?
 到【灌水乐园】发言


