


创建子图的好处:
- 每个子图可以单独操作,想画啥就画啥
- 各个子图之间可以共享坐标轴,便于同一量纲去比较数值的大小
fig,((ax1,ax2,ax3,ax4,ax5,ax6)) = plt.subplots(1,6,figsize=(22,4),sharex=True,sharey=True)
##设定子图间距 , left < right, top > bottom, 数字表示窗口大小的比例(如下则子图间距为窗口大小的1%)
plt.subplots_adjust(left=0, top= 0.96, right = 0.96, bottom = 0.04, wspace = 0.05, hspace = 0.1)
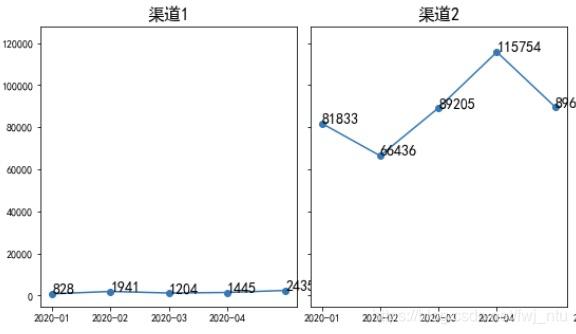
x1 = np.array(result.loc[result['dict_value']=='渠道1']['clue_time'])
y1 = np.array(result.loc[result['dict_value']=='渠道1']['only_mobiles'])
ax1.plot(x1,y1,'o-')
for x,y in zip(x1,y1):
ax1.text(x,y,'%.0f' % y,fontdict={'fontsize':14})
ax1.set_title("渠道1",fontdict={'fontsize':16})
plt.text()可以实现在画图中增加数据标签:
- x,y 是一组标量,可为数组对象,不可为Serise对象
- x,y 提供了需要展示的文本对应的位置,即通过x,y坐标轴定位
- s参数:是一个string对象,是需要展示在图上的内容
Signature: ax2.text(x, y, s, fontdict=None, withdash=, **kwargs)
Docstring:
Add text to the axes.
Add the text s to the axes at location x, y in data coordinates.
Parameters
x, y : scalars
The position to place the text. By default, this is in data
coordinates. The coordinate system can be changed using the
transform parameter.
s : str
The text.
fontdict : dictionary, optional, default: None
A dictionary to override the default text properties. If fontdict
is None, the defaults are determined by your rc parameters.
withdash : boolean, optional, default: False
Creates a~matplotlib.text.TextWithDashinstance instead of a
~matplotlib.text.Textinstance.
Returns
text :.Text
The created.Textinstance.
Other Parameter
**kwargs :~matplotlib.text.Textproperties.
Other miscellaneous text parameters.
Examples
Individual keyword arguments can be used to override any given
parameter::text(x, y, s, fontsize=12)
The default transform specifies that text is in data coords,
alternatively, you can specify text in axis coords ((0, 0) is
lower-left and (1, 1) is upper-right). The example below places
text in the center of the axes::
text(0.5, 0.5, ‘matplotlib’, horizontalalignment=‘center’,
… verticalalignment=‘center’, transform=ax.transAxes)
You can put a rectangular box around the text instance (e.g., to
set a background color) by using the keyword bbox. bbox is
a dictionary of~matplotlib.patches.Rectangle
properties. For example::
text(x, y, s, bbox=dict(facecolor=‘red’, alpha=0.5))
File: /Library/Frameworks/Python.framework/Versions/3.8/lib/python3.8/site-packages/matplotlib/axes/_axes.py
Type: method
👏👏👏再看看我们以前的文章😃😃😃
🌺 Excel中数据分析工具库-相关系数篇
🌺 干货,手把手教会你做相关性分析
🌺 5年数据分析路,小结。
🌺 用户细分及画像分析
🌺 K-近邻算法及实践
欢迎关注,微信公众号“数据分析师之家”
扫描二维码 关注我们
💁提供职业规划、简历指导、面试辅导服务哦
QQ交流群:753936858(原群已满,新群号)

数据分析之家联合JEE RAY品牌为粉丝派发福利
添加粉丝福利派发官,领取粉丝福利哦


 972
972

 被折叠的 条评论
为什么被折叠?
被折叠的 条评论
为什么被折叠?
 到【灌水乐园】发言


