


一、pyecharts 概述
自2013年6月百度 EFE ( Excellent FrontEnd )数据可视化团队研发的 ECharts 1.0发布到 GitHub 网站以来, ECharts 一直备受业界权威的关注并获得广泛好评,成为目前成熟且流行的数据可视化图表工具,被应用到诸多数据可视化的开发领域。 Python 作为数据分析领域最受欢迎的语言,也加入 ECharts 的使用行列,并研发出方便 Python 开发者使用的数据可视化工具,由此便诞生了 pyecharts 库。
1.1认识图表类

1.2认识配置项

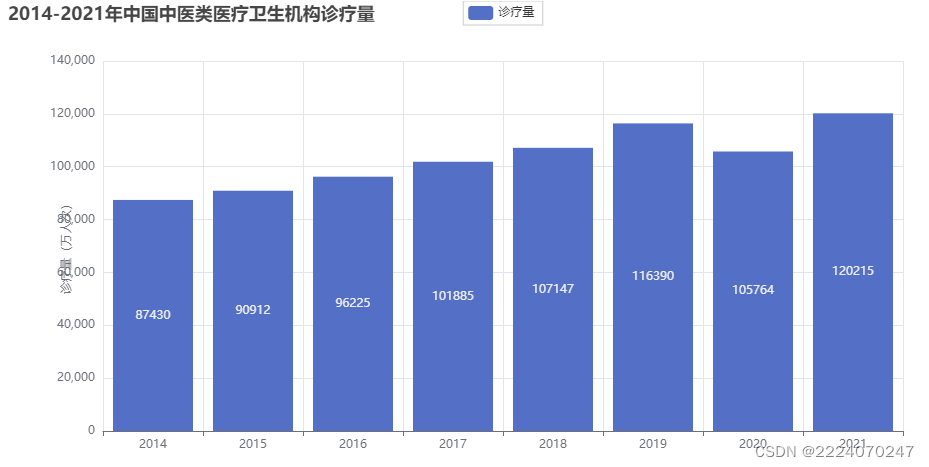
二、绘制柱形图
运行代码:
from pyecharts.charts import Bar, Line
import pyecharts.options as opts
year_x = ["2014", "2015", "2016", "2017", "2018", "2019","2020","2021"]
y1 = [87430,90912,96225,101885,107147,116390,105764,120215]#诊疗量
bar =(
    #添加x轴、y轴的数据系列名称
    Bar (init_opts=opts.InitOpts(width='1000px',height='500px'))
    .add_xaxis(year_x)
    .add_yaxis("诊疗量 ",y1 )
    #设置标题轴标签
    .set_global_opts(title_opts=opts.TitleOpts(title="2014-2021年中国中医类医疗卫生机构诊疗量"),
                    yaxis_opts=opts.AxisOpts(name="诊疗量(万人次)",
                    name_location="center",name_gap=30))
)
bar.render_notebook()
运行结果:
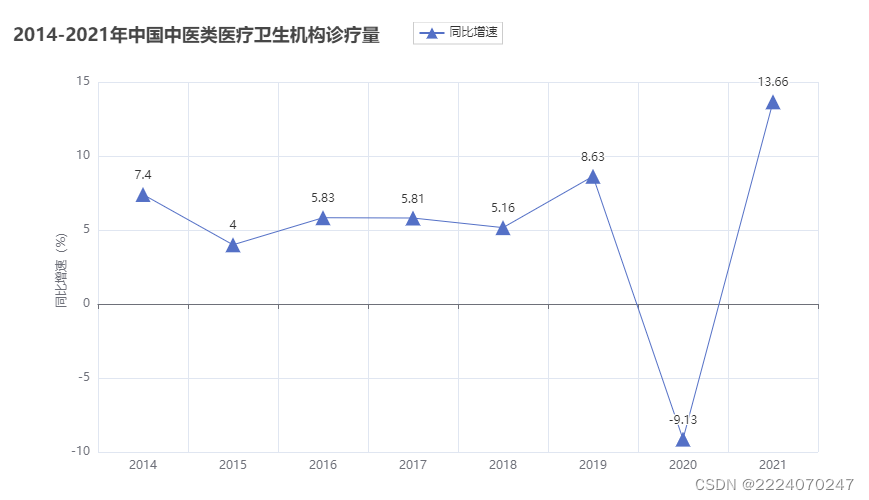
三、绘制折线图
3.1常用参数的含义
- series_name :表示系列的名称,显示于提示框和图例中。
- y_axis :表示系列数据。
- xaxis_index :表示 x 轴的索引,用于拥有多个 x 轴的单图表中。. yaxis _ index :表示 y 轴的索引,用于拥有多个 y 轴的单图表中。
- color :表示系列的注释文本的颜色。
- is_symbol_show :表示是否显示标记及注释文本,默认为 True 。
- symbol :表示标记的图形,可以取值为' circle '(圆形)、' rect '(矩形)、' roundRect '(圆角矩形)、' triangle '(三角形)、' diamond '(菱形)、' pin '(大头针)、' arrow '(箭头)、' none '(无)。
- symbol _ size :表示标记的大小,可以接收单一数值,也可以接收形如[ width , height ]的数组。
- stack :表示将轴上同一类目的数据堆叠放置。
- is_smooth :表示是否使用平滑曲线。
- is_step :表示是否显示为阶梯图。
3.2运行代码:
import pyecharts.options as opts
from pyecharts.charts import Line
line =(
    Line()
    #添加 x 轴、 y 轴的数据、系列名称
    .add_xaxis (['2014','2015','2016','2017','2018','2019','2020','2021'])
    .add_yaxis ('同比增速',[7.40,4.00,5.83,5.81,5.16,8.63,-9.13,13.66],symbol ='triangle',symbol_size =15)
    #设置标题轴标签
    .set_global_opts(title_opts=opts.TitleOpts(title="2014-2021年中国中医类医疗卫生机构诊疗量"),
                     yaxis_opts=opts.AxisOpts(name="同比增速(%)",name_location ="center",name_gap=30))
)
line.render_notebook ()
运行结果:
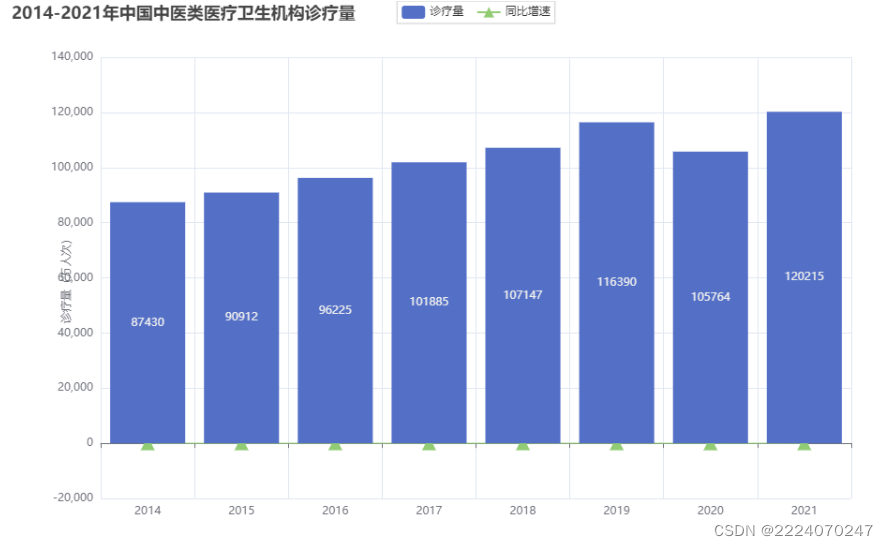
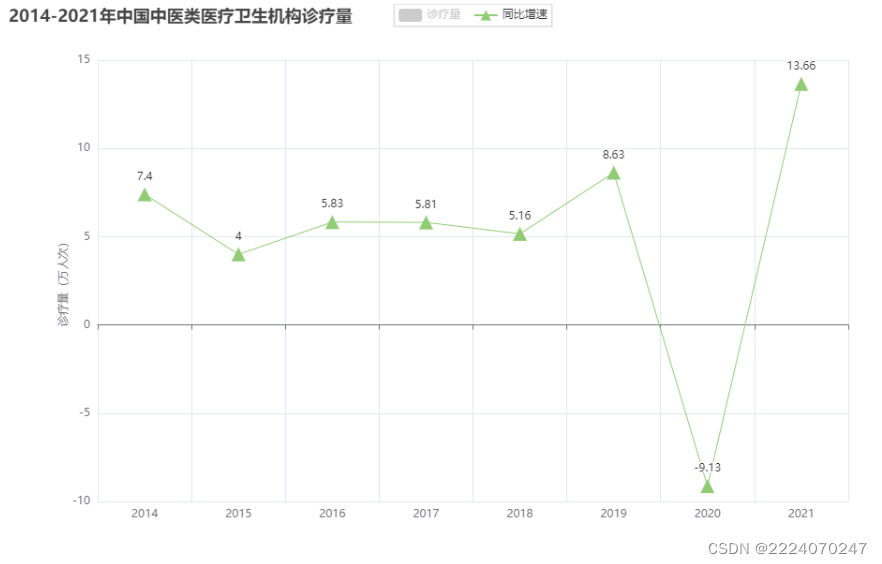
四、 使用grid绘制组合图形
#导入配置模块
from  pyecharts import options as  opts
from pyecharts.charts import Bar,Line,Grid
from pyecharts.globals import ThemeType #导入主题模块


#1.准备数据
year_x = ["2014", "2015", "2016", "2017", "2018", "2019","2020","2021"]
y1 = [87430,90912,96225,101885,107147,116390,105764,120215]#诊疗量
y2 = [7.40,4.00,5.83,5.81,5.16,8.63,-9.13,13.66]#同比增长
#2.绘制柱形图
bar =(
    #添加x轴、y轴的数据系列名称
    Bar()
    .add_xaxis(year_x)
    .add_yaxis("诊疗量 ",y1 )
    #设置标题轴标签
    .set_global_opts(title_opts=opts.TitleOpts(title="2014-2021年中国中医类医疗卫生机构诊疗量"),
                    yaxis_opts=opts.AxisOpts(name="诊疗量(万人次)",
                    name_location="center",name_gap=30))
    .set_series_opts(
    label_opts=opts.LabelOpts(is_show=True))#显示标签
)
#3.绘制折线图
line =(
    Line()
    #添加x轴、y轴的数据系列名称
    .add_xaxis (year_x)
    .add_yaxis ('同比增速',y2,symbol ='triangle',symbol_size =15)
    #设置标题轴标签
    .set_global_opts(title_opts=opts.TitleOpts(title="2014-2021年中国中医类医疗卫生机构诊疗量"),
                    yaxis_opts=opts.AxisOpts(name="同比增速(%)",
                    name_location ="center",name_gap=30))
)

#4.将折线图与柱状图进行组合—Overlap层叠
all=bar.overlap(line)

#5.组合图表
grid=(
    Grid(init_opts=opts.InitOpts(width="1000px",height='600px'))#画布配置
    .add(all,grid_opts=opts.GridOpts())
)


grid.render_notebook()
点击切换图表

如图
五. Bar、Line层叠图表
5.1.导入模块
from pyecharts.charts import Bar, Line
from pyecharts import options as opts
5.2准备数据
year_x = ["2014", "2015", "2016", "2017", "2018", "2019","2020","2021"]
y1 = [87430,90912,96225,101885,107147,116390,105764,120215]#诊疗量
y2 = [7.40,4.00,5.83,5.81,5.16,8.63,-9.13,13.66]#同比增长
5.3绘制柱形图
bar =(
    #添加x轴、y轴的数据系列名称
    Bar()
    .add_xaxis(year_x)
    .add_yaxis("诊疗量 ",y1,z=0,#因为折线图会被柱状图遮挡,所以把柱形图置底
               label_opts=opts.LabelOpts(is_show=False))
    .extend_axis(
      yaxis=opts.AxisOpts(
          name='诊疗量(万人次)',# 柱形图y轴名称
          type_='value',
          position='left',))# 柱形图y轴在左边显示
     .extend_axis(
      yaxis=opts.AxisOpts(
          name='同比增速(%)',# 折线图y轴名称
          type_='value',
          position='right',))# 折线图y轴在右边显示
#设置全局配置项
.set_global_opts(title_opts=opts.TitleOpts(title='2014-2021年中国中医类医疗卫生机构诊疗量'),
        #图例距离左边边距:45%
        legend_opts=opts.LegendOpts(pos_left='45%' ),
        #显示提示框组件
        tooltip_opts=opts.TooltipOpts(trigger='axis',axis_pointer_type='cross'),
        #显示工具栏
        toolbox_opts=opts.ToolboxOpts(is_show=True)
    )
)
5.4 绘制折线图
line = (
    Line()  #创建Line类的对象
         .add_xaxis(year_x) #添加x轴的数据
         .add_yaxis(
         series_name='同比增速(%)', #图例名:同比增速(%)
         y_axis=y2,  #y轴折线图数据
         yaxis_index=2,   #表示y轴的索引
             z=2
    )
)
5.5 渲染成html网页
bar.overlap(line).render("2014-2021年中国中医类医疗卫生机构诊疗量.html")运行结果:


 644
644


 被折叠的 条评论
为什么被折叠?
被折叠的 条评论
为什么被折叠?
 到【灌水乐园】发言


