<template>
<div id="main" class="echart-style">
</div>
</template>
<script setup lang="ts">
import * as echarts from 'echarts';
import { onMounted, ref } from 'vue';
let myChart = ref()
let option = ref({})
let data = ref<any>([])
for (let i = 0; i < 5; ++i) {
data.value.push(Math.round(Math.random() * 200));
}
onMounted(() => {
init()
})
const init = () => {
// 基于准备好的dom,初始化echarts实例
myChart.value = echarts.init(document.getElementById('main'));
// 绘制图表
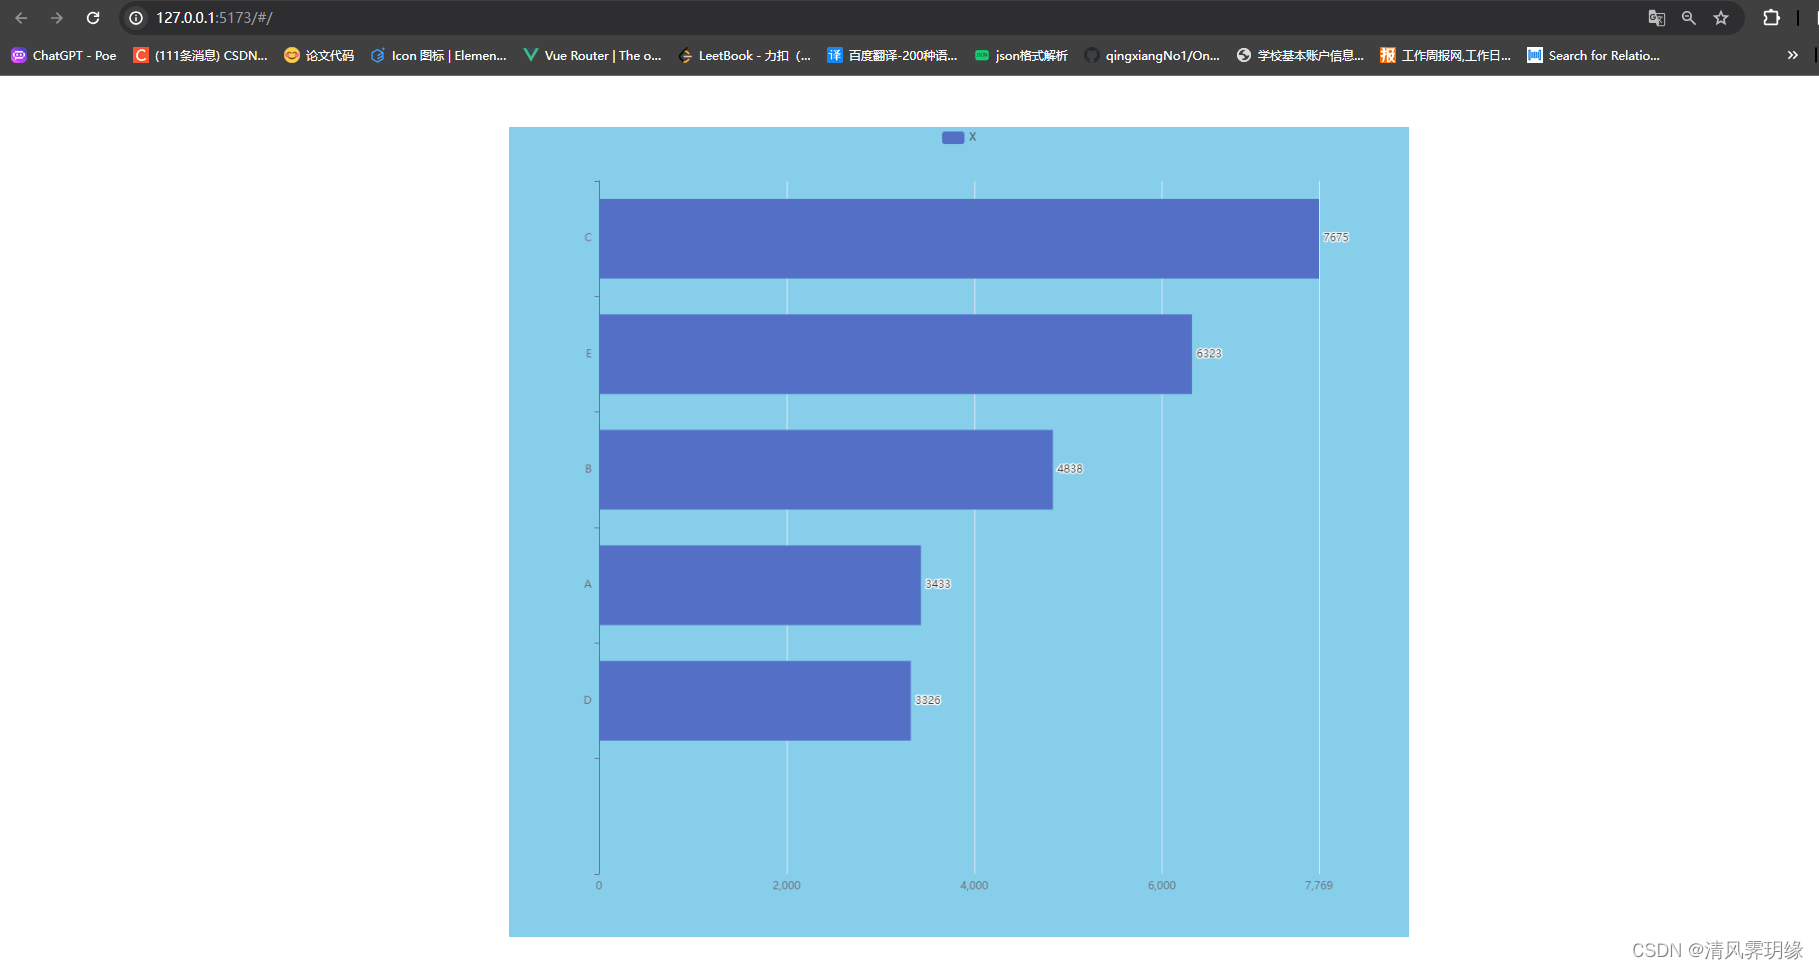
option.value = {
xAxis: {
max: 'dataMax'
},
yAxis: {
type: 'category',
data: ['A', 'B', 'C', 'D', 'E'],
inverse: true,
animationDuration: 300,
animationDurationUpdate: 300,
max:5// only the largest 3 bars will be displayed
},
series: [
{
realtimeSort: true,
name: 'X',
type: 'bar',
data: data.value,
label: {
show: true,
position: 'right',
valueAnimation: true
}
}
],
legend: {
show: true
},
animationDuration: 3000,
animationDurationUpdate: 3000,
animationEasing: 'linear',
animationEasingUpdate: 'linear'
};
myChart.value.setOption(option.value)
};
function update() {
data.value = option.value.series[0].data;
for (var i = 0; i < data.value.length; ++i) {
if (Math.random() > 0.9) {
data.value[i] += Math.round(Math.random() * 2000);
} else {
data.value[i] += Math.round(Math.random() * 200);
}
}
init()
}
setInterval(function () {
update();
}, 3000);
</script>
<style scoped>
.echart-style {
width: 1000px;
height: 900px;
background: skyblue;
}
</style>


 1771
1771


 被折叠的 条评论
为什么被折叠?
被折叠的 条评论
为什么被折叠?
 到【灌水乐园】发言


