


电影案例分析
import numpy as np
import pandas as pd
import matplotlib.pyplot as plt
movie = pd.read_csv("./data/IMDB-Movie-Data.csv")
movie.head()
前言
数据来源:kaggle
| Rank | Title | Genre | Description | Director | Actors | Year | Runtime (Minutes) | Rating | Votes | Revenue (Millions) | Metascore | |
|---|---|---|---|---|---|---|---|---|---|---|---|---|
| 0 | 1 | Guardians of the Galaxy | Action,Adventure,Sci-Fi | A group of intergalactic criminals are forced ... | James Gunn | Chris Pratt, Vin Diesel, Bradley Cooper, Zoe S... | 2014 | 121 | 8.1 | 757074 | 333.13 | 76.0 |
| 1 | 2 | Prometheus | Adventure,Mystery,Sci-Fi | Following clues to the origin of mankind, a te... | Ridley Scott | Noomi Rapace, Logan Marshall-Green, Michael Fa... | 2012 | 124 | 7.0 | 485820 | 126.46 | 65.0 |
| 2 | 3 | Split | Horror,Thriller | Three girls are kidnapped by a man with a diag... | M. Night Shyamalan | James McAvoy, Anya Taylor-Joy, Haley Lu Richar... | 2016 | 117 | 7.3 | 157606 | 138.12 | 62.0 |
| 3 | 4 | Sing | Animation,Comedy,Family | In a city of humanoid animals, a hustling thea... | Christophe Lourdelet | Matthew McConaughey,Reese Witherspoon, Seth Ma... | 2016 | 108 | 7.2 | 60545 | 270.32 | 59.0 |
| 4 | 5 | Suicide Squad | Action,Adventure,Fantasy | A secret government agency recruits some of th... | David Ayer | Will Smith, Jared Leto, Margot Robbie, Viola D... | 2016 | 123 | 6.2 | 393727 | 325.02 | 40.0 |
我们想知道这些电影数据中评分的平均分,导演的人数等信息,我们应该怎么获取?
movie["Rating"].mean()
6.723199999999999
np.unique(movie["Director"]).shape[0]
644
对于这一组电影数据,如果我们想Rating,Runtime (Minutes)的分布情况,应该如何呈现数据?
用pandas画图
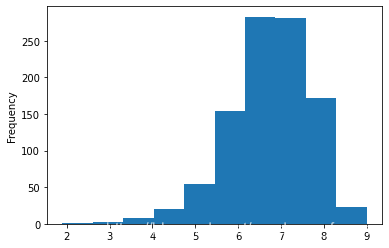
# Rating分布
# pandas画图已经无法满足我们的要求,只能完成一些简单的画图,如下
movie["Rating"].plot(kind="hist")
用matplotlib画图
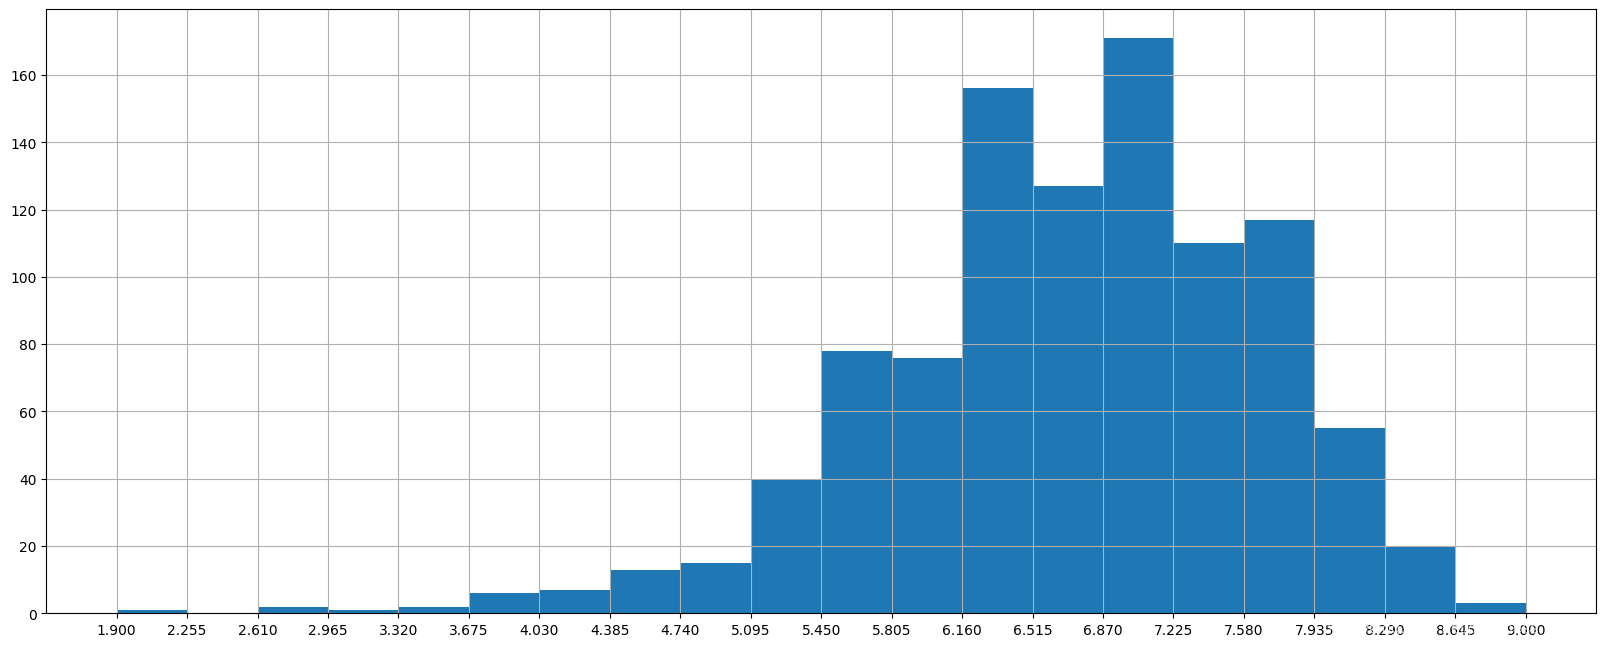
# Rating分布

# 1.创建画布
plt.figure(figsize=(20, 8), dpi=100)

# 2.绘制图像
plt.hist(movie["Rating"].values, bins=20)

# 2.1 添加刻度
max_ = movie["Rating"].max()
min_ = movie["Rating"].min()

t1 = np.linspace(min_, max_, num=21)

plt.xticks(t1)

# 2.2 添加网格
plt.grid()

# 3.显示
plt.show()
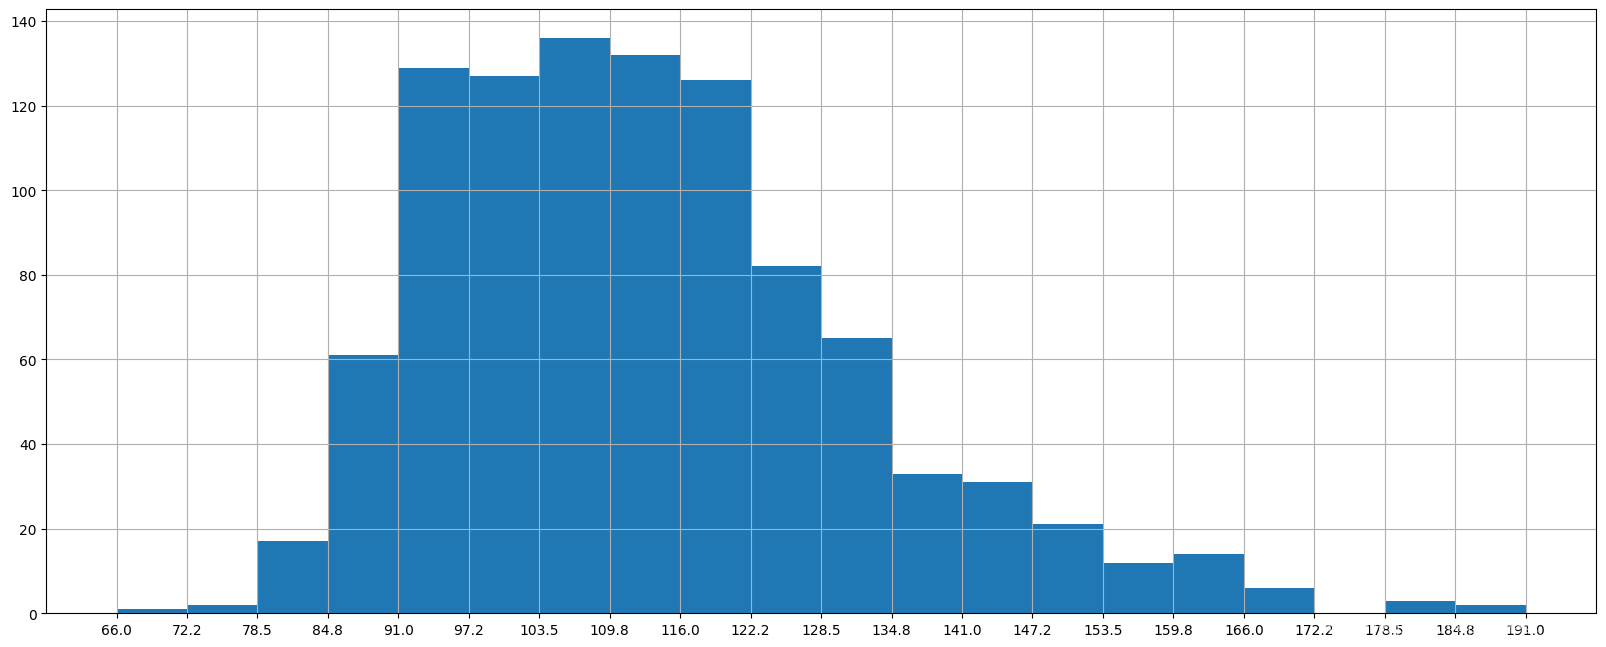
# Runtime (Minutes)分布

# 1.创建画布
plt.figure(figsize=(20, 8), dpi=100)

# 2.绘制图像
plt.hist(movie["Runtime (Minutes)"].values, bins=20)

# 2.1 添加刻度
max_ = movie["Runtime (Minutes)"].max()
min_ = movie["Runtime (Minutes)"].min()

t1 = np.linspace(min_, max_, num=21)

plt.xticks(t1)

# 2.2 添加网格
plt.grid()

# 3.显示
plt.show()
对于这一组电影数据,如果我们希望统计电影分类(genre)的情况,应该如何处理数据?
# 取出类别,用逗号分隔,形成二维数组
temp_list = [i.split(",") for i in movie["Genre"]]
# 取出类别
#用嵌套循环列表生成,先循环二维数组的每一维, 在每个数组中进行循环
# 最后去重
genre_list = np.unique([i for j in temp_list for i in j])
genre_list
array(['Action', 'Adventure', 'Animation', 'Biography', 'Comedy', 'Crime',
       'Drama', 'Family', 'Fantasy', 'History', 'Horror', 'Music',
       'Musical', 'Mystery', 'Romance', 'Sci-Fi', 'Sport', 'Thriller',
       'War', 'Western'], dtype='<U9')
# 用movie行数, 类别数 形成 零数组的行列数
zeros = np.zeros([movie.shape[0], genre_list.shape[0]])
# 将1列索引更改为字符串
temp_movie = pd.DataFrame(zeros, columns=genre_list)
temp_movie.head()
| Action | Adventure | Animation | Biography | Comedy | Crime | Drama | Family | Fantasy | History | Horror | Music | Musical | Mystery | Romance | Sci-Fi | Sport | Thriller | War | Western | |
|---|---|---|---|---|---|---|---|---|---|---|---|---|---|---|---|---|---|---|---|---|
| 0 | 0.0 | 0.0 | 0.0 | 0.0 | 0.0 | 0.0 | 0.0 | 0.0 | 0.0 | 0.0 | 0.0 | 0.0 | 0.0 | 0.0 | 0.0 | 0.0 | 0.0 | 0.0 | 0.0 | 0.0 |
| 1 | 0.0 | 0.0 | 0.0 | 0.0 | 0.0 | 0.0 | 0.0 | 0.0 | 0.0 | 0.0 | 0.0 | 0.0 | 0.0 | 0.0 | 0.0 | 0.0 | 0.0 | 0.0 | 0.0 | 0.0 |
| 2 | 0.0 | 0.0 | 0.0 | 0.0 | 0.0 | 0.0 | 0.0 | 0.0 | 0.0 | 0.0 | 0.0 | 0.0 | 0.0 | 0.0 | 0.0 | 0.0 | 0.0 | 0.0 | 0.0 | 0.0 |
| 3 | 0.0 | 0.0 | 0.0 | 0.0 | 0.0 | 0.0 | 0.0 | 0.0 | 0.0 | 0.0 | 0.0 | 0.0 | 0.0 | 0.0 | 0.0 | 0.0 | 0.0 | 0.0 | 0.0 | 0.0 |
| 4 | 0.0 | 0.0 | 0.0 | 0.0 | 0.0 | 0.0 | 0.0 | 0.0 | 0.0 | 0.0 | 0.0 | 0.0 | 0.0 | 0.0 | 0.0 | 0.0 | 0.0 | 0.0 | 0.0 | 0.0 |
# 用loc的索引方式,在两个表中分别取对应的值(temp_movie 和temp_list)
# 若相等则表示该电影类别取 1
for i in range(1000):
    temp_movie.loc[i, temp_list[i]] = 1
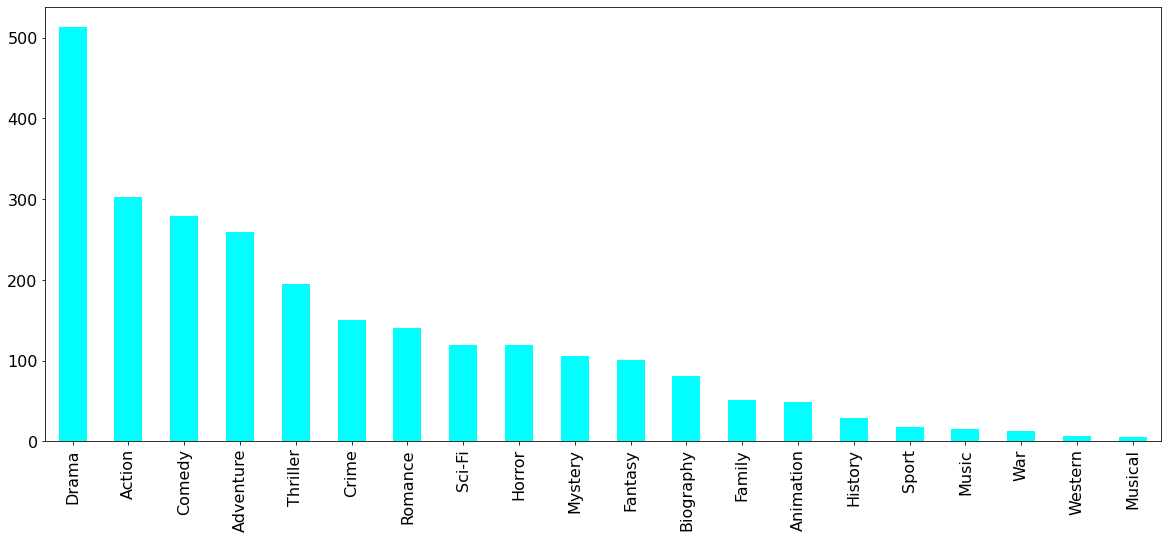
# 升序排列, 求出对应类别电影的和
genre = temp_movie.sum().sort_values(ascending=False)
genre
Drama        513.0
Action       303.0
Comedy       279.0
Adventure    259.0
Thriller     195.0
Crime        150.0
Romance      141.0
Sci-Fi       120.0
Horror       119.0
Mystery      106.0
Fantasy      101.0
Biography     81.0
Family        51.0
Animation     49.0
History       29.0
Sport         18.0
Music         16.0
War           13.0
Western        7.0
Musical        5.0
dtype: float64
# 用pandas的画图方法
genre.plot(kind="bar", colormap="cool", figsize=(20, 8), fontsize=16)


 169万+
169万+

 被折叠的 条评论
为什么被折叠?
被折叠的 条评论
为什么被折叠?
 到【灌水乐园】发言


