


作者:wogoyixikexie@gliet 2008-11-27
- //===================================================================
- ================如下是Attache device之后在PB的窗口出现的加载信息
- 从信息看来,驱动已经加载成功了,但是就是不能单步,现在不知道哪里出现了问题
- he Kernel Debugger is waiting to connect with target.
- The Kernel Debugger has been disconnected successfully.
- Warning: Debugger service map is set to none. If your image has debugging support it may not boot properly.
- Cannot access selected Device from service host.
- Debugger could not initialize connection.
- The Kernel Debugger is waiting to connect with target.
- The Kernel Debugger has been disconnected successfully.
- 0 PID:0 TID:0 Sp=ffffc7cc
- 173 PID:3ddf002 TID:3ddf266 OEMIoControl: Unsupported Code 0x10100b4 - device 0x0101 func 45
- 189 PID:3dc5b62 TID:3dc5b3e OEMIoControl: Unsupported Code 0x101008c - device 0x0101 func 35
- 205 PID:3dc5b62 TID:3dc5b3e OEMIoControl: Unsupported Code 0x10100d4 - device 0x0101 func 53
- 208 PID:3dc5b62 TID:3dc5b3e OEMIoControl: Unsupported Code 0x10100c4 - device 0x0101 func 49
- 240 PID:3dc5b62 TID:3dc5b3e OEMIoControl: Unsupported Code 0x10100c4 - device 0x0101 func 49
- 293 PID:3dc5b62 TID:3dc5b3e OEMIoControl: Unsupported Code 0x10100d0 - device 0x0101 func 52
- 293 PID:3dc5b62 TID:3dc5b3e OEMIoControl: Unsupported Code 0x10100f8 - device 0x0101 func 62
- 1342 PID:c3d5d80e TID:c3dc58ca INFO: CReg2440Uart::CReg2440Uart using processor frequency reported by the OAL (66608640).
- 1349 PID:c3d5d80e TID:c3dc58ca INFO: CReg2440Uart::CReg2440Uart using processor frequency reported by the OAL (66608640).
- 1373 PID:c3d5d80e TID:c3dc58ca PWR: Process Attach
- 1374 PID:c3d5d80e TID:c3dc58ca >PWR_Init(802ED64)
- 1374 PID:c3d5d80e TID:c3dc58ca HW_Init : HW_InitRegisters
- 1374 PID:c3d5d80e TID:c3dc58ca HW_Init : CreateEvent
- 1375 PID:c3d5d80e TID:c3dc58ca HW_Init : IOCTL_HAL_REQUEST_SYSINTR
- 1376 PID:c3d5d80e TID:c3dc58ca INFO: PwrButton: Mapped Irq 0x0 to SysIntr 0x17.
- 1377 PID:c3d5d80e TID:c3dc58ca HW_Init : CreateThread
- 1378 PID:c3d5d80e TID:c3dc58ca HW_Init : CeSetThreadPriority
- 1381 PID:c3d5d80e TID:c3dc58ca HW_Init : Done
- 1381 PID:c3d5d80e TID:c3dc58ca <PWR_Init:0x3b200
- 1385 PID:c3d5d80e TID:63d39fde >PWR_Open(0x3b200, 0x0, 0x3)
- 1385 PID:c3d5d80e TID:63d39fde PCF: HW_Open
- 1385 PID:c3d5d80e TID:63d39fde <PWR_Open:1
- 1385 PID:c3d5d80e TID:63d39fde >PWR_IOControl(0x321000, 0x0, 0, 0x803af48)
- 1386 PID:c3d5d80e TID:63d39fde <PWR_IOControl:1
- 1387 PID:c3d5d80e TID:63d39fde >PWR_Open(0x3b200, 0x0, 0x3)
- 1389 PID:c3d5d80e TID:63d39fde PCF: HW_Open
- 1390 PID:c3d5d80e TID:63d39fde <PWR_Open:2
- 1391 PID:c3d5d80e TID:63d39fde PWR_Close(0x3b200)
- 1391 PID:c3d5d80e TID:63d39fde PCF: HW_Close
- 1409 PID:c3d5d80e TID:c3dc58ca FMD::FMD_Init
- 1409 PID:c3d5d80e TID:c3dc58ca FMD::FMD_Init - pBSPArgs->nfsblk = 0x0
- 1409 PID:c3d5d80e TID:c3dc58ca FMD::FMD_Init - READ_REGISTER_BYTE(pNFSBLK) = 0x0
- 1410 PID:c3d5d80e TID:c3dc58ca FMD::FMD_Init IPL .....
- 1411 PID:c3d5d80e TID:c3dc58ca FMD::FMD_Init Done
- 1412 PID:c3d5d80e TID:c3dc58ca MID = 0xec, DID = 0x76 4th Cycle : 0x5a
- 1414 PID:c3d5d80e TID:c3dc58ca NUMBLOCKS : 512(0x200), SECTORSPERBLOCK = 256(0x100), BYTESPERSECTOR = 512(0x200)
- 1700 PID:c3d5d80e TID:63d79b6a FMD_OEMIoControl: unrecognized IOCTL (0x71c24).
- 2763 PID:c3d5d80e TID:c3dc58ca +CS8900:DriverEntry
- 4448 PID:c3d5d80e TID:c3dc58ca CamClockOn = 1
- 5703 PID:c3d5d80e TID:c3dc58ca Camera::Block TX Ended...
- 5703 PID:c3d5d80e TID:c3dc58ca CAMERA.DLL::InterruptThread Initialized.
- 5706 PID:c3d5d80e TID:63d39fde CAMERA: CIS_Open
- 5706 PID:c3d5d80e TID:63d39fde CIS: IOCTL_POWER_CAPABILITIES
- 5706 PID:c3d5d80e TID:63d39fde CAMERA: CIS_Open
- 5707 PID:c3d5d80e TID:63d39fde CAMERA: CIS_Close
- 6360 PID:c3b287ca TID:c3d73fc2 OEMIoControl: Unsupported Code 0x10100fc - device 0x0101 func 63
- 8753 PID:c3d5d80e TID:c3c1efda CamClockOn = 0
- ==================================================================
- ==在DNW有串口打印信息;;;;;;;;;;;;;;;;;;;;
- indows CE Kernel for ARM (Thumb Enabled) Built on Jun 24 2004 at 18:25:00
- ProcessorType=0920 Revision=0
- sp_abt=ffff5000 sp_irq=ffff2800 sp_undef=ffffc800 OEMAddressTable = 80215afc
- OEM name : LiYuTai Elec.Co.,Ltd.
- Website : www.hzlitai.com.cn
- Email : lyt_tech@yahoo.com.cn
- Tel : +86-571-56763523 56763526
- Function : ARMSYS2440 NK5.0 for L35T23
- UART config: 115.2kbps,8Bit,NP,UART0
- Build Date : 2007-4-23
- DCache: 8 sets, 64 ways, 32 line size, 16384 size
- ICache: 8 sets, 64 ways, 32 line size, 16384 size
- OALKitlStart : USB SERIAL
- Wait for connecting
- ----------我在PB Attach Device,就出现下面的串口打印语句--------
- KITLGlobalState == 0x61
- KITL: Leaving polling mode...
- VBridge:: VB_INITIALIZED returns [0]
- 请问这是怎么回事呢?
- 我看网上一些人的博客的贴图,在Attach Device以后不止这么多打印信息的
- 并且不会有这句KITL: Leaving polling mode...
- 从上面PB窗口的打印信息看,我的驱动已经加载完了。但是液晶屏幕是黑的,怎么回事呢?
- 并且不能在PB中单步,查询线程,DLL就可以。
- 请大家帮我分析一下,谢谢。
现在我把我一些图片发上来
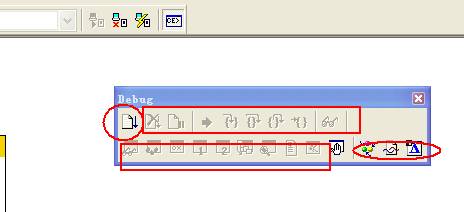
这是attach device之后,发现不能单步,只能查看线程。
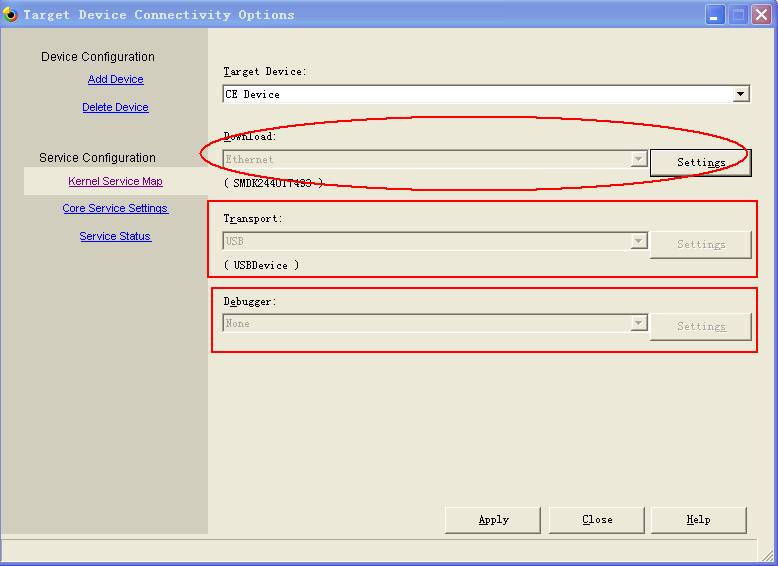
这是我设置KITL连接,是不是最下方那个debugger要选的?
这个不选就不能单步?
he Kernel Debugger is waiting to connect with target.
The Kernel Debugger has been disconnected successfully.
从以上两句可以看出,这个debugger要选的,不然肯定单步不了。
我再试试。做过的请指示一下,我到底错在哪里?
——哈哈,我发现虽然液晶屏幕暗淡,但是我仔细一看,其实已经有一些图像,并且我看状态栏的时间在运行,时间会变。
====================现在又有新情况
我每按一次运行,就会在PB窗口出现如下打印信息
Warning: Debugger service map is set to none. If your image has debugging support it may not boot properly.
Cannot access selected Device from service host.
Debugger could not initialize connection.
The Kernel Debugger is waiting to connect with target.
The Kernel Debugger has been disconnected successfully.
这个说明真是我没有选那个debugger的原因了。
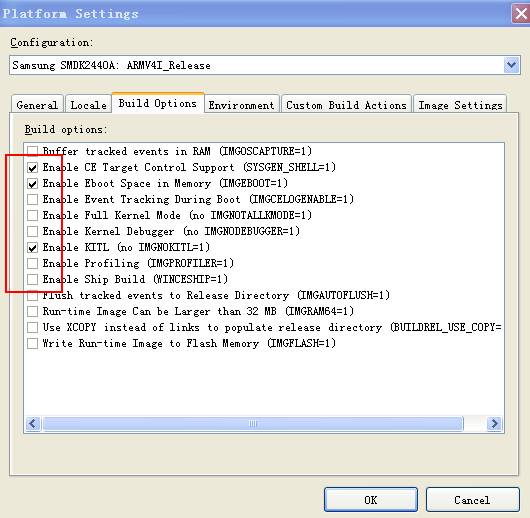
再贴个个setting设置
按照CSDN朋友们的提示,已经出现了单步的按钮。
我想拿LED驱动来尝试一下。没有想到我总是控制不了
现在把图片贴出来,再次求助。
下面这个图好像是个命令行窗口。怎么使用呢?

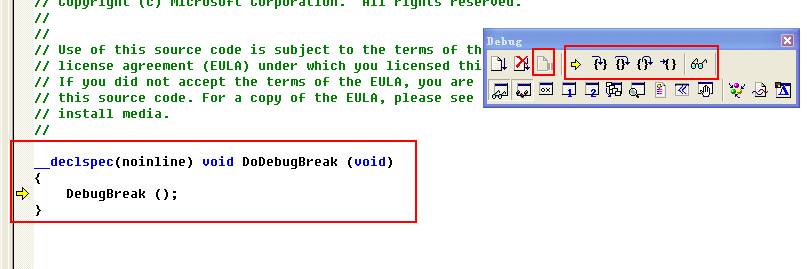
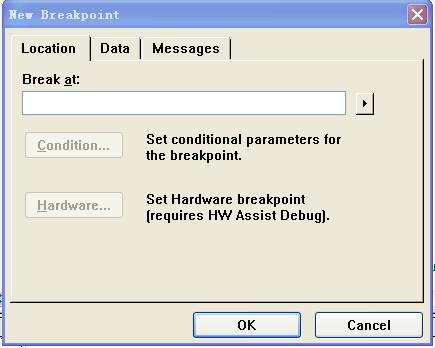
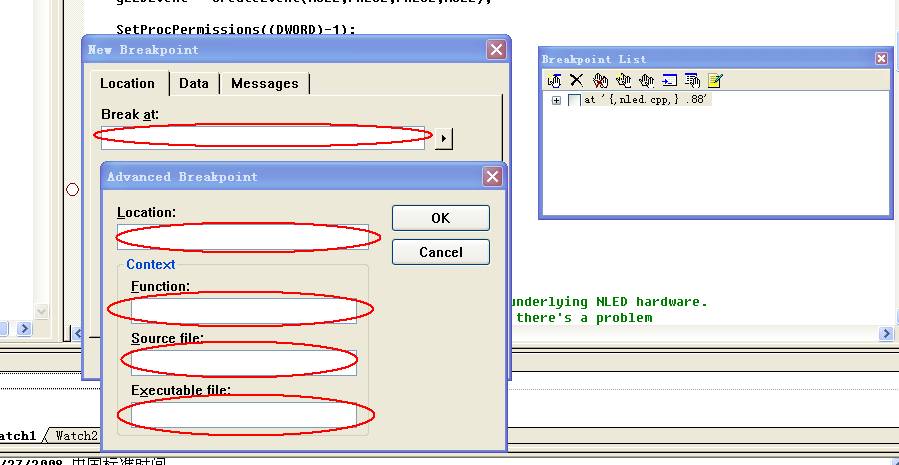
还有,我想在led驱动中设置断点,当我按F5开始的时候就跳到下面两张图那样了。

哈哈,快了,一定有诀窍。
搞定了再继续完成本博客。
=======================================================================
现在找到设置断点的地方了,但是不会设,下面的两个对话框到底是怎么填写的呢?
====================================================================


 3834
3834

 被折叠的 条评论
为什么被折叠?
被折叠的 条评论
为什么被折叠?
 到【灌水乐园】发言


