


SpringBoot项目部署
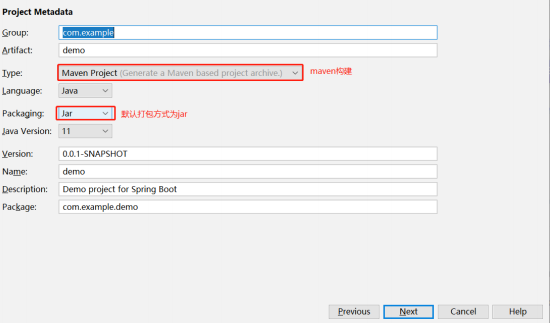
在如今的互联网背景下前后端分离开发已经成为互联网的主流趋势,SpringBoot构建web项目已经非常快速了,只需要将其打成一个jar包,然后通过java -jar jar包的名称就可以启动。
jar包
、
首先我们需要导入springBoot的maven依赖
<build>
        <plugins>
            <plugin>
                <groupId>org.springframework.boot</groupId>
                <artifactId>spring-boot-maven-plugin</artifactId>
            </plugin>
        </plugins>
    </build>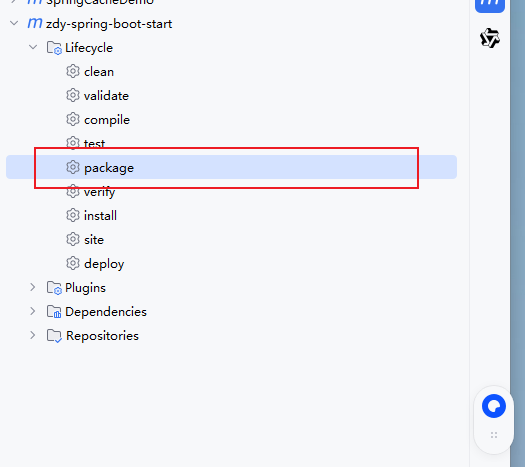
package完成后,会出现一个jar包
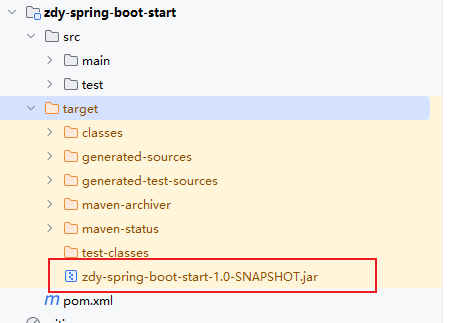
我们可以将jar包上传到Linux服务器上面,以jar运行(此处本地验证打包成功)
java -jar zdy-spring-boot-start-1.0-SNAPSHOT.jarwar包
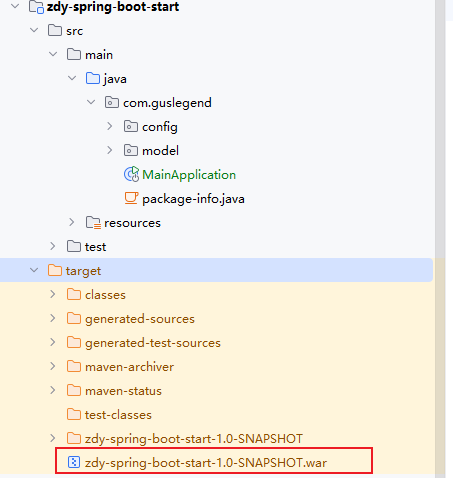
首先我们需要修改pom.xml配置文件
<packaging>jar</packaging>
//修改为
<packaging>war</packaging>
然后在pom.xml文件中添加依赖
<!--添加servlet-api的依赖,用来打war包 -->
        <dependency>
            <groupId>javax.servlet</groupId>
            <artifactId>javax.servlet-api</artifactId>
            <scope>provided</scope>
        </dependency>
还需要排除springboot内置的tomcat干扰
        <!--最终打成war包,排除内置的tomcat-->
        <dependency>
            <groupId>org.springframework.boot</groupId>
            <artifactId>spring-boot-starter-web</artifactId>
            <exclusions>
                <exclusion>
                    <groupId>org.springframework.boot</groupId>
                    <artifactId>spring-boot-starter-tomcat</artifactId>
                </exclusion>
            </exclusions>
        </dependency>
    </dependencies>
然后我们需要改造启动类
如果是war包发布,需要增加SpringBootServletInitializer子类,并重写其configure方法,或者将main函数所在的类继承SpringBootSerletInitializer,并重写configure方法。
当时打包为war时上传tomact服务器访问项目始终报错404就是忽略了这个。
@SpringBootApplication
public class MainApplication  extends SpringBootServletInitializer {

    public static void main(String[] args) {
        SpringApplication.run(MainApplication.class, args);
    }

    @Override
    protected SpringApplicationBuilder configure(SpringApplicationBuilder builder) {
        return builder.sources(MainApplication.class);
    }
}
war包和jar方式对比
SpringBoot 项目 jar 与 war 打包方式对比
启动与部署方式
jar 包:操作简单,通过java -jar xx.jar直接启动,使用最广泛;
war 包:需部署到 Tomcat 的 webapps 目录,随 Tomcat 启动而启动。
资源打包差异
jar 包:不会包含src/main/webapp下的内容(若路径错误会出现 404);
war 包:会将src/main/webapp下的内容打包进去。
适用场景
选 jar 包:提供 rest 服务的项目,命令行运行便捷;
选 war 包:含大量 css、js、html 且需频繁改动的项目(可直接替换静态资源,无需重新打包上传,效率更高)。
多环境部署
- 在项目运行中,包括多环境,如线上环境prod,开发环境dev,测试缓存test;
- 在不同的环境需要不同的配置,从而在不同的场景下去跑我们的程序;
- 例如prod和dev环境下需要连接不同的数据库,配置不同的日志输出;
- SpringBoot对此提供了支持,一方面是@Profile注解,另一方面还有多资源配置文件。
@Profile
@Profile注解的作用是指定类和方法在特定的Profile环境生效,任何@Compoent或@Configuration注解的类都可以使用@Profile注解;- 在使用DI来依赖注入的时候,能够根据@Profile标明的环境,将注入符合当前环境的相应的bean。
使用要求:
@Component或者@Configuration注解的类可以使用@profile;@Profile中需要指定一个字符串,约定生效的环境。
@Profile的使用位置:
- 修饰类
- 修饰方法
- 修饰注解
Profile激活
在实际使用中,注解中标识了prod,test,qa等多个环境,运行时使用哪个profile有spring.profiles.active控制,可以使用配置文件或命令行方式创建。
- 配置文件激活
spring:
  profiles:
active: dev- 命令行方式激活
java -jar spring-boot-config-0.1-SNAPSHOT.jar --spring.profiles.active=dev多Proflie的资源文件
一般为4个配置文件:
- application.properties 公共配置
- application-dev.properties 开发环境配置
- application-test.properties 测试环境配置
- application-prod.properties 生产环境配置
不同的properties配置文件也可以是在application.properties文件中来激活profile:spring.profiles.active = test。
SpringBoot监控
Auturator
- 其是spring boot的一个附加功能,可以帮助我们在应用程序生成环境是监控和管理应用程序;
- 可以使用HTTP的各种请求来监管,审计,收集应用的情况。
| HTTP 方法 | 路径 | 描述 |
| GET | /auditevents | 显示应用暴露的审计事件(如认证进入、订单失效) |
| GET | /beans | 描述应用程序上下文里全部的 Bean 及它们的关系 |
| GET | /conditions | (对应 1.0 的 /autoconfig)提供自动配置生效的条件情况,记录哪些条件通过 / 没通过 |
| GET | /configprops | 描述配置属性(包含默认值)如何注入 Bean |
| GET | /env | 获取全部环境属性 |
| GET | /env/{name} | 根据名称获取特定的环境属性值 |
| GET | /flyway | 提供 Flyway 数据库迁移信息 |
| GET | /liquibase | 显示 Liquibase 数据库迁移的详细信息 |
| GET | /health | 报告应用程序的健康指标(由 HealthIndicator 实现类提供) |
| GET | /heapdump | dump 一份应用的 JVM 堆信息 |
| GET | /httptrace | 显示 HTTP 踪迹,最近 100 个 HTTP request/response |
| GET | /info | 获取应用程序的定制信息(由 info 打头的属性提供) |
| GET | /logfile | 返回 log 文件内容(需配置 logging.file 或 logging.path) |
| GET | /loggers | 显示和修改配置的 loggers |
| GET | /metrics | 报告各种应用程序度量信息(如内存用量、HTTP 请求计数) |
| GET | /metrics/{name} | 报告指定名称的应用程序度量值 |
| GET | /scheduledtasks | 展示应用中的定时任务信息 |
| GET | /sessions | 若使用 Spring Session,展示应用中的 HTTP sessions 信息 |
| POST | /shutdown | 关闭应用程序(需配置 endpoints.shutdown.enabled=true) |
| GET | /mappings | 描述全部的 URI 路径,及它们和控制器(包含 Actuator 端点)的映射关系 |
| GET | /threaddump | 获取线程活动的快照 |
体验Actuator
使用Actuator功能与springBoot使用其他功能一样简单,只需要加入xml依赖
<dependency>
  <groupId>org.springframework.boot</groupId>
  <artifactId>spring-boot-starter-actuator</artifactId>
</dependency>
为了保证监控接口的安全性,需要添加spring-boot-start-secuity依赖,访问应用监控端点是,都需要输入验证信息。也可以选择不加,不进行安全管理。
编写配置文件
配置详情
Actuator 基础配置(Spring Boot 2.x)
- 默认开放端点:仅
/actuator/health、/actuator/info(为安全考虑)。 - 端点暴露配置:
- 开放所有端点:
management.endpoints.web.exposure.include=*- 开放部分端点:
management.endpoints.web.exposure.include=beans,trace- 自定义监控路径:
management.endpoints.web.base-path=/manage配置后访问地址变为 /manage/*。
常用端点功能说明
1. health
- 作用:检查应用运行状态(高频监控点),可返回数据库连接、磁盘空间等异常原因。
- 默认开放,访问:
http://localhost:8000/actuator/health,返回示例:
{
  "status": "UP",
  "components": {
    "db": {
      "status": "UP",
      "details": {
        "database": "MySQL",
        "result": 1,
        "validationQuery": "/* ping */ SELECT 1"
      }
    },
    "diskSpace": {
      "status": "UP",
      "details": {
        "total": 429496729600,
        "free": 295998197760,
        "threshold": 10485760
      }
    },
    "ping": {
      "status": "UP"
    },
    "redis": {
      "status": "UP",
      "details": {
        "version": "7.0.15"
      }
    }
  }
}- 内置健康指标:
DataSourceHealthIndicator(数据库)、DiskSpaceHealthIndicator(磁盘)等;可关闭指定指标:
management.health.redis.enabled=false2. info
- 作用:返回自定义配置的信息(以
info开头的配置)。 - 配置示例:
info.app.name=spring-boot-actuator
info.app.version=1.0.0- 访问:
http://localhost:8000/actuator/info,返回示例:
{
  "app": {
    "name": "SpringCacheDemo",
    "version": 1,
    "test": "test"
  }
}
3. beans
- 作用:展示应用中所有 Bean 的信息(别名、类型、作用域、依赖等)。
- 访问:
http://localhost:8000/actuator/beans,返回示例包含 Bean 名称、类型(如TomcatEmbeddedServletContainerFactory)等。
4. conditions
- 作用:查看自动配置的生效 / 未生效条件(排查配置问题)。
- 访问:
http://localhost:8000/actuator/conditions,返回positiveMatches(生效配置)、negativeMatches(未生效配置)及原因。
5. heapdump
- 作用:生成 GZip 压缩的 JVM 堆转储文件。
- 访问:
http://localhost:8000/actuator/heapdump,可通过 JDK 工具(如 VisualVM)分析内存泄漏。
6. mappings
- 作用:描述所有 URI 路径与控制器的映射关系。
- 访问:
http://localhost:8000/actuator/mappings,返回示例包含接口路径(如/hello)对应的控制器方法。
7. threaddump
- 作用:生成线程活动快照,用于排查线程问题(线程名、状态、堆栈等)。
- 访问:
http://localhost:8000/actuator/threaddump,返回线程的状态(如WAITING)、堆栈信息等。
8. shutdown
- 作用:关闭应用(需手动开启)。
- 开启配置:
management.endpoint.shutdown.enabled=true- 访问(仅支持 POST):
curl -X POST "http://localhost:8000/actuator/shutdown"- 返回示例:
{"message": "Shutting down, bye..."}Spring Boot Admin
- Spring Boot Admin 是一个针对spring-boot的actuator接口进行UI美化封装的监控工具;
- 他可以 返回在列表中浏览所有被监控spring-boot项目的基本信息比如:Spring容器管理的所有的bean、 详细的Health信息、内存信息、JVM信息、垃圾回收信息、各种配置信息(比如数据源、缓存列表 和命中率)等,Threads 线程管理,Environment 管理等。
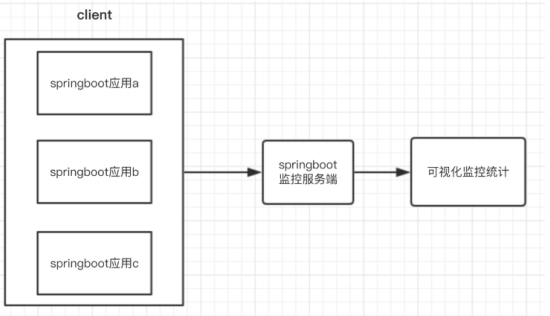
服务端
配置xml文件
        <dependency>
            <groupId>de.codecentric</groupId>
            <artifactId>spring-boot-admin-starter-server</artifactId>
            <version>2.7.10</version>
        </dependency>
需要在启动类上添加注解
@EnableAdminServer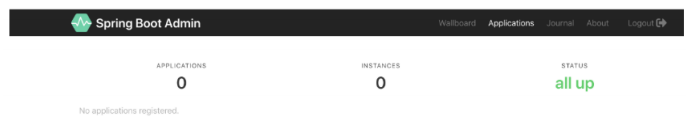
客户端
添加maven依赖
        <dependency>
            <groupId>de.codecentric</groupId>
            <artifactId>spring-boot-admin-starter-client</artifactId>
            <version>2.1.0</version>
        </dependency>
配置yml文件
server:
  port: 8080

# 自定义配置信息用于“/actuator/info”读取
info:
  name: 老王
  age: 100
  phone: 110

# 通过下面的配置启用所有的监控端点,默认情况下,这些端点是禁用的:
management:
  endpoints:
    web:
      exposure:
        include: "*"
  endpoint:
    health:
      show-details: always

# 将Client作为服务注册到Server,通过Server来监听项目的运行情况
spring:
  boot:
    admin:
      client:
        url: http://localhost:8081
# #application实例名
# application:
#   name: spring-boot-admin-client


 906
906

 被折叠的 条评论
为什么被折叠?
被折叠的 条评论
为什么被折叠?
 到【灌水乐园】发言


