QCustomplot 简单使用前言
其实我使用QCustomPlot已经有段时间了,现在基本能够画出QCustomPlot曲线了。目前根据项目需求我只画过折线图,后期如果有需要将尝试其他图形的使用。
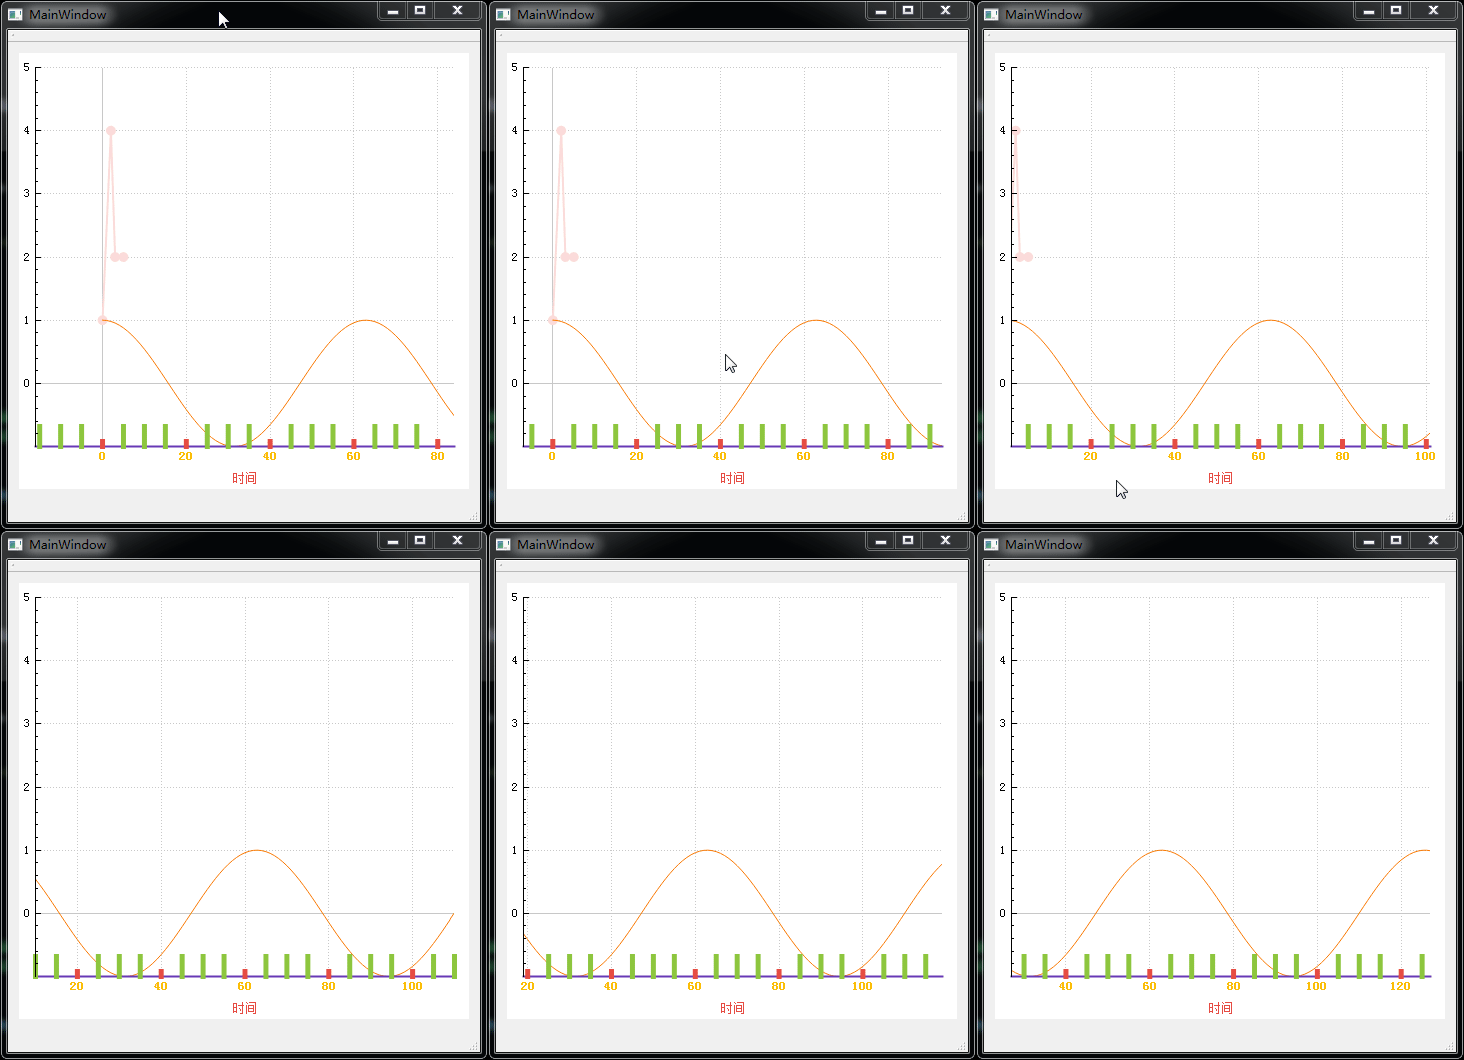
进入今天的正题:今天将尝试简单的动态曲线的使用。
QCustomplot 动态曲线设计思路
题外话: 其实动态曲线最重要的就是动起来,而动起来自然而然就能想到定时器。
1. 先画一条简单的曲线;
2. 再开启一个定时器,链接一个超时槽函数,此定时主要控制折线的更新频率;
3. 再定时器的槽函数里执行的操作:
      {添加数据;
       设置是否需要跟随滚动;
       修改坐标轴范围;
       重新渲染}
QCustomplot 动态曲线代码实现
#include "mainwindow.h"
#include "ui_mainwindow.h"

MainWindow::MainWindow(QWidget *parent) :
    QMainWindow(parent),
    ui(new Ui::MainWindow)
{
    ui->setupUi(this);

    m_plot = ui->plot;
    initCustomPlot();

    connect(&mDataTimer, SIGNAL(timeout()), this, SLOT(timerSlot()));
    mDataTimer.start(100);
}

MainWindow::~MainWindow()
{
    delete ui;
}


void MainWindow::timerSlot()
{

    // 添加值
    mGraph1->addData(mGraph1->dataCount(),  qCos(mGraph1->dataCount()/10.0));

    // 滚动及在坐标轴中显示
    m_plot->xAxis->rescale();
    mGraph1->rescaleValueAxis(true, false);

    // 修改坐标
    m_plot->xAxis->setRange(m_plot->xAxis->range().upper, 100, Qt::AlignRight);

    // 渲染
    m_plot->replot();
}

void MainWindow::initCustomPlot()
{
    // 基本属性
    m_plot->setInteractions( QCP::iRangeDrag | QCP::iRangeZoom | QCP::iSelectAxes |
                             QCP::iSelectLegend | QCP::iSelectPlottables);

    // 坐标轴
    m_plot->xAxis->setAntialiased(true); // 设置反锯齿

    // 设置 X 轴背景颜色
    QPen x_pen;
    x_pen.setColor(QColor(RED));
    x_pen.setWidth(1);
    m_plot->xAxis->setBasePen(x_pen);

    // 设置 x 轴底部的显示文字
    m_plot->xAxis->setLabel(QStringLiteral("时间"));
    m_plot->xAxis->setLabelColor(QColor(RED));
    m_plot->xAxis->setLabelPadding(10);
    //    bool mm =  m_plot->xAxis->setLayer(QString("demo"));
    //    qDebug() << "[" << __FUNCTION__ <<__LINE__ << "] :" <<  mm;
    //    m_plot->xAxis->setRangeLower(-5);
    //    m_plot->xAxis->setRangeUpper(15);
    m_plot->xAxis->setRange(-1, 1);

    //    m_plot->yAxis->setScaleRatio(m_plot->xAxis, 2);
    m_plot->xAxis->setScaleType(QCPAxis::stLinear); // 使用那种刻度
    //    m_plot->xAxis->setSelectableParts(QCPAxis::spAxisLabel); // 设置那些可以选中,基本属性中也可设置部分

    QPen x_select_pen;
    x_select_pen.setColor(QColor(PURPLE));
    x_select_pen.setWidth(2);
    m_plot->xAxis->setSelectedBasePen(x_select_pen); // 设置选中坐标轴背景的样式

    m_plot->xAxis->setSelectedLabelColor(QColor(CYAN));  // 选中 label 样式
    m_plot->xAxis->setSelectedParts(QCPAxis::spAxis|QCPAxis::spTickLabels);

    // 设置中间小刻度样式
    QPen x_select_sub_pen;
    x_select_sub_pen.setColor(QColor(OLIVE));
    x_select_sub_pen.setWidth(5);
    m_plot->xAxis->setSelectedSubTickPen(x_select_sub_pen);


    m_plot->xAxis->setSelectedTickLabelColor(QColor(YELLOW)); // 设置选中刻度 label 颜色
    m_plot->xAxis->setSubTickLength(20); // 设置刻度高度

    QPen x_select_tick_pen;
    x_select_tick_pen.setColor(QColor(RED));
    x_select_tick_pen.setWidth(5);
    m_plot->xAxis->setSelectedTickPen(x_select_tick_pen); // 设置选中小刻度样式

    m_plot->xAxis->setSubTicks(true); // 设置刻度是否显示

    // legend 图例设置
    m_plot->legend->setVisible(false);
    QPen legend_pen;
    legend_pen.setColor(QColor(DARKGRAY));
    legend_pen.setWidth(8);
    m_plot->legend->setBorderPen(legend_pen);

    m_plot->legend->setOuterRect(QRect(0,0, 200, 60)); // 不知道怎么用

    // 设置图例边框
    QPen legend_icon_pen;
    legend_icon_pen.setColor(QColor(MAUVE));
    legend_icon_pen.setWidth(3);
    m_plot->legend->setIconBorderPen(legend_icon_pen);

    // 设置图例左边 ICON 的 padding
    m_plot->legend->setIconTextPadding(10);
    m_plot->legend->setColumnSpacing(10);
    m_plot->legend->setIconSize(10, 50);
    m_plot->legend->setRowSpacing(50);

    // 设置选中图例的样式
    QPen legend_select_pen;
    legend_select_pen.setColor(QColor(GHOSTWHITE));
    legend_select_pen.setWidth(10);
    m_plot->legend->setSelectedBorderPen(legend_select_pen);


    // 数据,添加一条线
    QVector<double> x, y;
    x << 0 << 2 << 3 << 5;
    y << 1 << 4 << 2 << 2;

    m_plot->addGraph();
    m_plot->graph()->setName("Line1");


    m_plot->graph()->setLineStyle(QCPGraph::lsLine); // 设置样式为线
    m_plot->graph()->setScatterStyle(QCPScatterStyle(QCPScatterStyle::ssDisc, 8)); // 设置线与轴相交点的样式

    // 设置线的样式
    QPen graphPen;
    graphPen.setColor(QColor(REDLIGHT));
    graphPen.setWidthF(2);
    m_plot->graph()->setPen(graphPen);


    m_plot->graph()->setData(x, y); // 添加数据

    mGraph1 = m_plot->addGraph();
    //        mGraph1 = m_plot->addGraph(m_plot->xAxis, m_plot->axisRect()->axis(QCPAxis::atRight, 0));
    mGraph1->setPen(QPen(QColor(250, 120, 0)));

    // 渲染
    m_plot->replot();


}


 2374
2374


 被折叠的 条评论
为什么被折叠?


