摘要: ab命令会创建很多的并发访问线程,模拟多个访问者同时对某一URL地址进行访问。它的测试目标是基于URL的,因此,既可以用来测试Apache的负载压力,也可以测试nginx、lighthttp、tomcat、IIS等其它Web服务器的压力。 ab命令对发出负载的计算机要求很低,既不会占用很高CPU,也不会占用很多内存,但却会给目标服务器造成巨大的负载,其原理类似CC攻击。自己测试使用也须注意,否则一次上太多的负载,可能造成目标服务器因资源耗完,严重时甚至导致死机。
首先通过uptime查看当前负载情况, 通过watch uptime查看实时负载,观察负载下降情况
Apache服务自带了应该用于压力测试的工具ab(ApacheBench),对应做一些简单的压力测试,它完全能够胜任,本文主要介绍,在centos中不安装Apache的情况下,安装ab
1,ab运行的时候需要依赖包,我们先安装依赖包,直接yum安装就可以了
yum install apr-util
2, 下载apache的rpm包,分离ab
- <code class="hljs elixir" style="">[root<span class="hljs-variable" style="">@Tomcat</span> ~]<span class="hljs-comment" style="">
- [root<span class="hljs-variable" style="">@Tomcat</span> ~]<span class="hljs-comment" style="">
- [root<span class="hljs-variable" style="">@Tomcat</span> ab]<span class="hljs-comment" style="">
- [root<span class="hljs-variable" style="">@Tomcat</span> ab]<span class="hljs-comment" style="">
- [root<span class="hljs-variable" style="">@Tomcat</span> ab]<span class="hljs-comment" style="">
- [root<span class="hljs-variable" style="">@Tomcat</span> ab]<span class="hljs-comment" style="">
3,ab简单用法
参数很多,一般我们用 -c 和 -n 参数就可以了。
#ab -c 1000 -n 4000 http://www.yousite.com/index.html #具体到某页面
-n后面的4000代表总共发出4000个请求;-c后面的1000表示采用1000个并发(模拟1000个人同时访问),后面的网址表示测试的目标URL。
- <table border="1" width="700" cellspacing="1" cellpadding="1"><tbody><tr><td> </td></tr></tbody></table>
- [root@Tomcat ab]# ab -c 1000 -n 4000 http:
- This is ApacheBench, Version 2.0.40-dev <$Revision: 1.146 $> apache-2.0
- Copyright 1996 Adam Twiss, Zeus Technology Ltd, http:
- Copyright 2006 The Apache Software Foundation, http:
-
- Benchmarking 192.168.0.222 (be patient)
- Completed 400 requests
- Completed 800 requests
- Completed 1200 requests
- Completed 1600 requests
- Completed 2000 requests
- Completed 2400 requests
- Completed 2800 requests
- Completed 3200 requests
- Completed 3600 requests
- Finished 4000 requests
-
-
- Server Software: nginx/1.4.3
- Server Hostname: 192.168.0.222
- Server Port: 80
-
- Document Path: /docs/manager-howto.html
- Document Length: 73924 bytes
-
- Concurrency Level: 1000
- Time taken for tests: 0.875928 seconds
- Complete requests: 4000
- Failed requests: 0
- Write errors: 0
- Total transferred: 296732000 bytes
- HTML transferred: 295696000 bytes
- Requests per second: 4566.59 [#/sec] (mean)
- #最重要的指标之一,相当于LR中的每秒事务数,后面括号中的mean表示这是一个平均值,越大抗压越强
- Time per request: 218.982 [ms] (mean)
- #最重要的指标之二,相当于LR中的平均事务响应时间,后面括号中的mean表示这是一个平均值
- Time per request: 0.219 [ms] (mean, across all concurrent requests)
- Transfer rate: 330822.86 [Kbytes/sec] received
- #平均每秒网络上的流量,吞吐量,越大抗压越强
-
- Connection Times (ms)
- min mean[+/-sd] median max
- Connect: 0 0 4.5 0 29
- Processing: 1 17 14.5 17 653
- Waiting: 0 17 14.5 17 653
- Total: 15 18 15.2 17 674
-
- Percentage of the requests served within a certain time (ms)
- 50% 17
- 66% 18
- 75% 18
- 80% 18
- 90% 20
- 95% 22
- 98% 37
- 99% 40
- 100% 674 (longest request)
主要介绍里面的几个指标,我基本也就看这几个指标,简单测试足够了,如果要全面的监控nginx,需要用到专业的监控程序,如nagios
- <strong>下面开始解析这条命令语句:</strong>
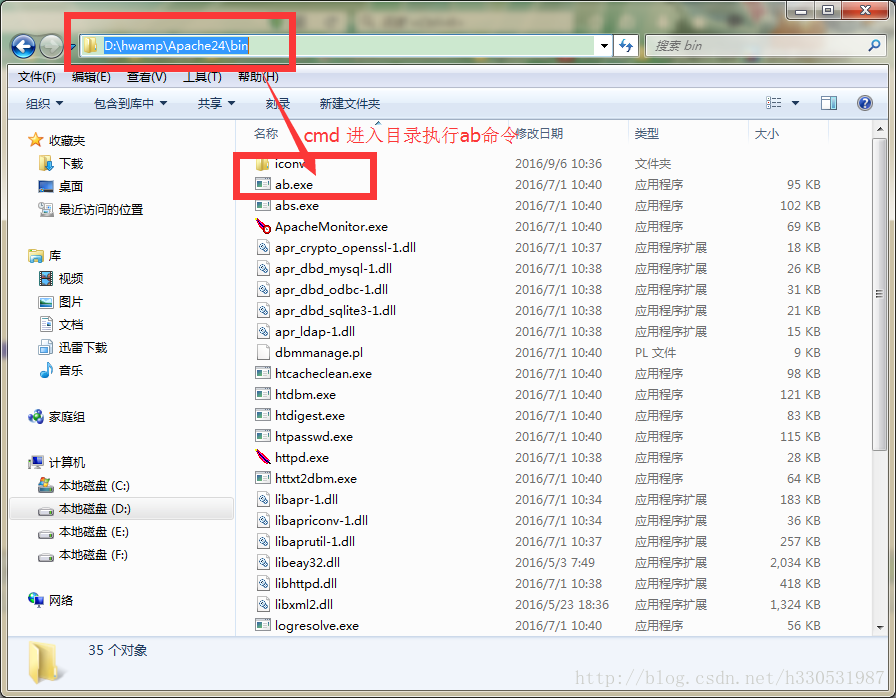
- 启动ab,并出入三个参数(PS D:\wamp\bin\apache\Apache2.2.21\bin> .\ab -n1000 -c10 http:
- -n1000 表示请求总数为1000
- -c10 表示并发用户数为10
- http:
- 测试结果也一目了然:
- 测试出的吞吐率为: Requests per second: 2015.93 [#/sec] (mean) ---除此之外还有其他一些信息----
- Server Software
- Server Hostname
- Server Port
- Document Path
- Document Length
- Concurrency Level
- Time taken for tests
- Complete requests
- Failed requests
- Total transferred
- HTML transferred
- Requests per second
- Time per request
- Time per requet(across all concurrent request)
- Transfer rate
- Percentage of requests served within a certain time(ms)


 1563
1563

 被折叠的 条评论
为什么被折叠?
被折叠的 条评论
为什么被折叠?
 到【灌水乐园】发言


