


今天继续做实验室的项目,没有javaweb编程经验与前端编程经验真是吃了好多亏,早知道学习一下jsp的架构了,现在纯jsp+servlet的形式写后台,还和前端进行了一系列耦合,真是蛋疼无比。
切入正题,echarts的时间轴与力导向图的搭配使用:
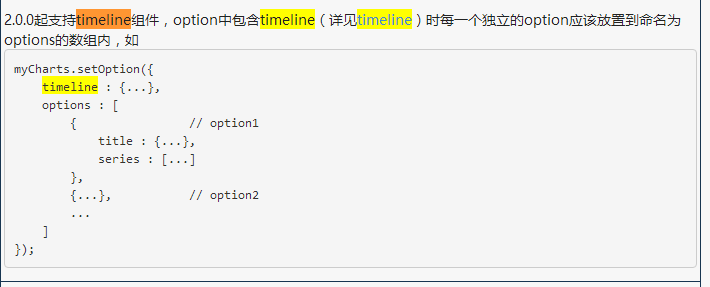
1.明确时间轴的data数目对应着后面的option数目
一个时间轴的data,就对应了后面的一个option,用官方的话来说:
2.知道时间轴的一些配置选项
这个大家自己去查阅官方参考手册就行,我列举几个我用到的:
autoplay和loop.
talk is cheap,show me the code:
下面直接上我的配置函数代码:
function newupdateTimeGraph(dataNodesMap,dataLinksMap,dates){

    var option_time = {
            timeline:{
                data:(function(){
                    var data=[];
                    for(var i=0;i<dates.length;i++){
                        data.push(dates[i]);
                       // console.log(dates[i]);
                    }
                    return data;
                })(),
                label : {
//                    formatter : function(s) {
//
//                        return s;
//                    }
                },
                autoPlay : false,
                playInterval : 3000
            },
            options:(function(){
                 var options=[];
                 for(var i=0;i<dates.length;i++){
                     var day=dates[i];
                     var dataNode=[];
                         dataNode=dataNodesMap[day];
                     var dataLinks=[];
                         dataLinks=dataLinksMap[day];
                     //console.log(dataNode);
                    //console.log(dataLinks);
                     if(i==0){
                         options.push({
                             title : {
                                    text: '传播关系图',
                                    x:'right',
                                    y:'bottom'
                                },

                                color:
                                    [
                                     "#00CCFF",
                                     "#FF0033"
                                     ],

                                tooltip : {
                                    trigger: 'item',
                                    formatter: '{b}'
                                },
                                toolbox: {
                                    show : true,
                                    x:'left',
                                    y:'bottom',
                                    feature : {
                                        //dataView : {show: true, readOnly: false},
                                        restore : {show: true},
                                        magicType: {show: true, type: ['force', 'chord']},
                                        saveAsImage : {show: true}
                                    }
                                },
                                legend: {
                                    x: 'left',
                                    data:['之前人物','变化人物']
                                },
                                series : [
                                    {
                                        type:'force',
                                        name : "参与关系",
                                        ribbonType: false,
                                        categories : [
                                            {
                                                name: '之前人物'
                                            },
                                            {
                                                name: '变化人物'
                                            }
                                        ],
                                        itemStyle: {
                                            normal: {
                                                label: {
                                                    show: true,
                                                    textStyle: {
                                                        color: '#333'
                                                    }
                                                },
                                                nodeStyle : {
                                                    brushType : 'both',
                                                    borderColor : 'rgba(250,215,0,0.4)',
                                                    borderWidth : 1
                                                },
                                                linkStyle: {
                                                    type: 'curve'
                                                }
                                            },
                                            emphasis: {
                                                label: {
                                                    show: false
                                                    // textStyle: null      // 默认使用全局文本样式,详见TEXTSTYLE
                                                },
                                                nodeStyle : {
                                                    //r: 30
                                                },
                                                linkStyle : {}
                                            }
                                        },
                                        useWorker: false,
                                        minRadius : 10,
                                        maxRadius : 25,
                                        gravity: 1.1,
                                        scaling: 1.5,
                                        roam: true,
                                        //linkSymbol: 'arrow',
                                        steps:2,
                                        large:true,
                                        nodes:dataNode,
                                        links:dataLinks,

                                    }
                                ]
                            }
                                 );
                     }else{
                         options.push({
                             series : [
                                       {
                                           nodes:dataNode,
                                           links:dataLinks,
                                       }
                                   ]
                               }
                                 );
                     }
                 }
                 return options;
           })()

    };
    var TimeChart = echarts.init(document.getElementById('commuTime'));
    TimeChart.setOption(option_time,true);
    TimeChart.on(echarts.config.EVENT.TIMELINE_CHANGED, function(paramA,paramB){

        //console.log(paramA);
        //console.log(paramB);
        var option=TimeChart.getOption();
        var day=dates[paramA.currentIndex];重新更新数据,防止数据覆盖
        var dataNode=[];
         dataNode=dataNodesMap[day];
        var dataLinks=[];
         dataLinks=dataLinksMap[day];
       // console.log(dataNode);

        option.series[0].nodes=dataNode;
        option.series[0].links=dataLinks;

        //console.log(option);
        TimeChart.setOption(option,true);

        TimeChart.resize();
    });


}
其中dataNodesMap和dataLinksMap是我提前准备好的key为天的Map数组,所有的key存在了dates数组里面,所以挨个配置好从0到dates.length-1的option就行。
这里注意一下,第一个option的参数设置后续的option似乎是可以沿用的,所以,直接填后面option的series的data就行。
这里我参考了这篇博客 进行配置
3.解决标题提到的问题:
问题描述是:
当我走第一遍流程的时候是没有问题的,但是如果我把指针往前拉一天,结果前一天的数据居然包含了后一天的数据……
问题描述有点类似于这个问题 而且没有答案。
解决办法就是针对每次的timeline的事件响应函数,手动重新读取正确数据并填充一下(如果你写了这个响应函数,理论上前面的option的series的数据都可以设置为空)。
解决的过程参考了这个博客 感谢几个博客博主的帮助,也希望我的这篇略显过时的文章对以后看到的人有用。


 578
578

 被折叠的 条评论
为什么被折叠?
被折叠的 条评论
为什么被折叠?
 到【灌水乐园】发言


