


主要是学习Canvas过程中的学习笔记。主要是分享一些代码出来。
代码中主要几个知识点会提前说明下:
- 正多边形的绘制,参考下面的坐标示例:
- 五角星参考图:
- 下面是学习代码。


<!DOCTYPE html>
<html lang="en">
<head>
<meta charset="UTF-8">
<meta name="viewport" content="width=device-width, initial-scale=1.0">
<title>直线绘图</title>
<script>
function $$(id){
return document.getElementById(id);
}
window.onload = function(){
/**
* 传统的画法
* 语法:
* cxt.moveTo(x1,y1);//直线的起点,即将画笔移到该点(x1,y1)位置上,开始绘图。
* cxt.lineTo(x2,y2);//直线的终点,即画笔从(x1,y1)开始,一直画到(x2,y2)
*/
var cnv = $$("canvas");
var cxt = cnv.getContext("2d");
cxt.moveTo(50,100);
cxt.lineTo(150,50);
cxt.lineTo(250, 100);
cxt.lineTo(150,150);
cxt.lineTo(50,100);
cxt.stroke();
/**
* 描边矩形:Canvas中将strokeStyle和strokeRect方法配合使用来画一个“描边矩形”
* 语法:
* cxt.strokeStyle = 属性值;
* cxt.strokeRect(x,y,width,height);
* 说明:
* 1、strokeStyle是context对象的一个属性。属性取值有三种,即颜色值、
* 渐变色、图案。用法有一下几种:
* cxt.strokeStyle="#FF0000";//十六进制颜色值
* cxt.strokeStyle="red";//颜色关键字
* cxt.strokeStyle="rgb(255,0,0)";//rgb颜色值
* cxt.strokeStyle="rgba(255,0,0,1)";//rgba颜色值
*
* 2、strokeRect是context的方法,用于确定矩形的坐标,其中xy为矩形最
* 左上角的坐标。width为矩形宽度,height为高度。默认情况下width
* 和height都是以px为单位的。
*
* 3、必须注意一点,strokeStyle属性必须在strokeRect()方法之前定义,
* 否则无效。
*/
cxt.strokeStyle="red";
cxt.strokeRect(300,75,50,50);
/**
* 填充矩阵:Canvas中将fillStyle属性和fillRect()方法配合来画一个填充矩阵。
* 语法:
* cxt.fillStyle=属性值;
* cxt.fillRect(x,y,width,height);
* 说明:
* 1、fillStyle是context对象的一个属性,同strokeStyle一样取值有三种,
* 即颜色值、渐变色、图案。用法参考strokeStyle.
* 2、fiilRect()是context对象的方法。参数说明和用法和strokeRect一直,
* 可参考使用。
*/
cxt.fillStyle="HotPink";
cxt.fillRect(400,75,50,50);
/**
* rect()方法画矩形:
* 语法:
* rect(x,y,width,height);
* 说明:
* 1、xy表示表示矩形最左上角的坐标,width为矩形宽度,height为高度。
* 2、strokeRect()、fillRect()和rect()都可以画矩形,参数也相同,不同
* 在于前两个调用直接,立即会把矩形绘制出来。而rect()调用后不会把矩
* 阵绘制出来,只有在使用rect()之后再调用stroke()或者fill()方法,
* 才会绘制出来。
* (1)rect()和stroke()
* cxt.strokeStyle="red";
* cxt.rect(50,50,80,80);
* cxt.stroke();
* 上述等价于:
* cxt.strokeStyle="red";
* cxt.strokeRect(50,50,80,80);
* (2)、rect()和fill()
* cxt.fillStyle="red";
* cxt.rect(50,50,80,80);
* cxt.fill();
* 上述等价于:
* cxt.fillStyle="red";
* cxt.fillRect(50,50,80,80);
*/
cxt.strokeStyle="#red";
cxt.rect(500,75,50,50);
cxt.stroke();
cxt.fillStyle="#FFE8E8";
cxt.rect(500,75,50,50);
cxt.fill();
/**
* 清空矩阵:Canvas使用clearRect()方法清空“指定矩形区域”
* 语法:
* cxt.clearRect(x,y,width,height);
* 说明:
* 1、x和y表示清空矩阵区域的最左上角坐标。width表示宽度,height为高度
* 2、清空区域小于rect的区域的时候,只会将rect中间掏空,当大于rect区域并
* 覆盖的时候,则会清除掉所以的rect。
*
*/
cxt.fillStyle="#FFE8E8";
cxt.rect(580,50,100,100);
cxt.fill();
cxt.clearRect(590,60, 80,80);
/**
* 多边形:Canvas中没有专门绘制三角形或者多边形的方法,都是通过moveTo()和lineTo()
* 去逐步实现的。
*
*/
var cnv1 = $$("canvas1");
var cxt1 = cnv1.getContext("2d");
cxt1.moveTo(40,60);
cxt1.lineTo(100,60);
cxt1.lineTo(100,30);
cxt1.lineTo(150,75);
cxt1.lineTo(100,120);
cxt1.lineTo(100,90);
cxt1.lineTo(40,90);
cxt1.lineTo(40,60);
cxt1.stroke();
//给箭头做填充
cxt1.fillStyle="HotPink";
cxt1.fill();
/**
* 绘制正多边形
* n: 表示n边形
* dx/dy: 表示n边形中心坐标
* size:表示n边形的大小
*
*/
function createPolygon(cxt, n, dx, dy, size){
//用于开始一条新路径
cxt.beginPath();
var degree = (2*Math.PI)/n;
for(var i=0;i<n;i++){
var x=Math.cos(i*degree);
var y=Math.sin(i*degree);
cxt.lineTo(x*size + dx,y*size+dy);
}
//关闭路径
cxt.closePath();
}
createPolygon(cxt1, 3, 200,75,50);
cxt1.fillStyle = "HotPink";
cxt1.fill();
createPolygon(cxt1, 4, 300,75,50);
cxt1.fillStyle = "HotPink";
cxt1.fill();
createPolygon(cxt1, 5, 400,75,50);
cxt1.fillStyle = "HotPink";
cxt1.fill();
createPolygon(cxt1, 6, 500,75,50);
cxt1.fillStyle = "HotPink";
cxt1.fill();
cxt1.beginPath();
for(var i=0;i<5;i++){
cxt1.lineTo(Math.cos((18+i*72)*Math.PI/180)*50 +600,
-Math.sin((18+i*72)*Math.PI/180)*50+75);
cxt1.lineTo(Math.cos((54+i*72)*Math.PI/180)*25+600,
-Math.sin((54+i*72)*Math.PI/180)*25+75);
}
cxt1.closePath();
cxt1.stroke();
cxt1.fillStyle = "red";
cxt1.fill();
var cnv2 = $$("canvas2");
var cxt2 = cnv2.getContext("2d");
/**
* 训练题:绘制调色板
* 方格调色板
*
*/
for(var i=0;i<6;i++){
for(var j=0;j<6;j++){
cxt2.fillStyle="rgb("+Math.floor(255-42.5*i) + ", " +
Math.floor(255-42.5*j)+",0)";
cxt2.fillRect(j*25,i*25,25,25);
}
}
/**
* 训练题:绘制调色板
* 渐变调色板
*
*/
var cnv3 = $$("canvas3");
var cxt3 = cnv3.getContext("2d");
var r=255,g=0,b=0;
for(var i=0;i<150;i++){
if(i<25){
g+=10;
}else if(i>25&&i<50){
r-=10;
}else if(i>50&&i<75){
g-=10;
b+=10;
}else if(i>75&&i<100){
r+=10;
}else{
b-=10;
}
cxt3.fillStyle="rgb("+r+", "+g+", "+b+")";
cxt3.fillRect(3*i,0,3,cnv.height);
}
}
</script>
</head>
<body>
<canvas id="canvas" width="700" height="170" style="border:1px dashed">
</canvas>
<p>绘制多边形</p>
<canvas id="canvas1" width="700" height="170" style="border:1px dashed">
</canvas>
<p>训练题:绘制调色板</p>
<canvas id="canvas2" width="700" height="170" style="border:1px dashed">
</canvas>
<p>训练题:渐变调色板</p>
<canvas id="canvas3" width="700" height="170" style="border:1px dashed">
</body>
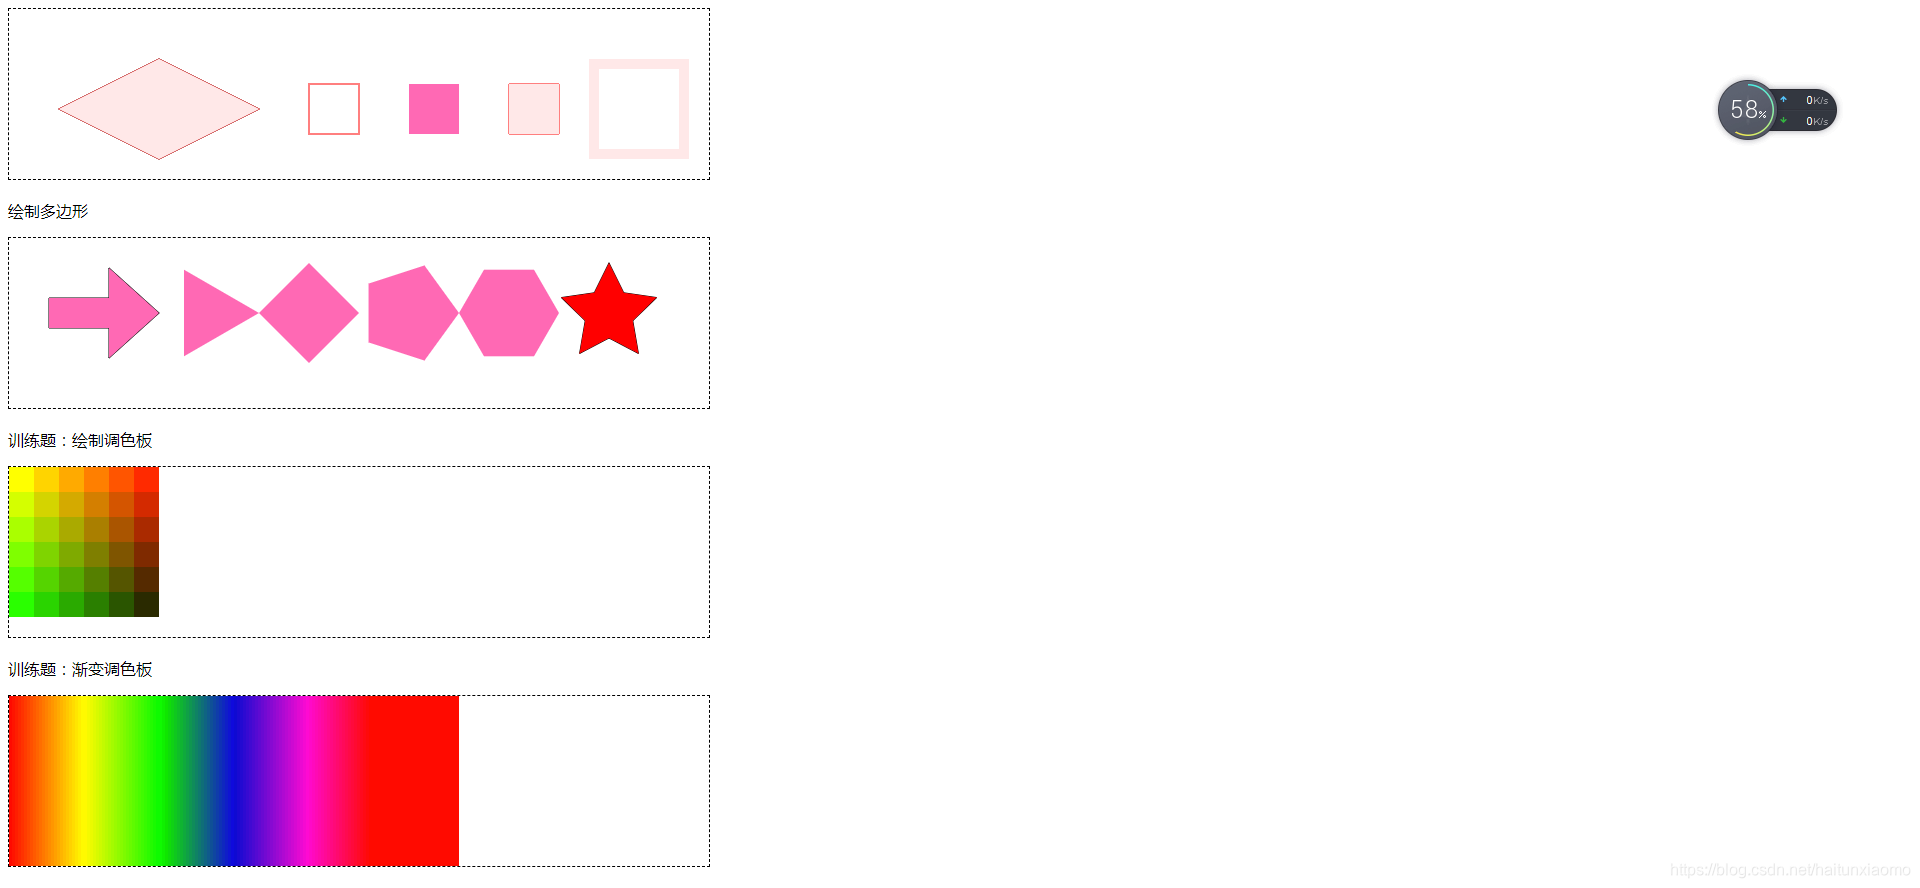
</html>运行结果:


 3938
3938


 被折叠的 条评论
为什么被折叠?
被折叠的 条评论
为什么被折叠?
 到【灌水乐园】发言


