


 该代码演示如何使用Matplotlib在交互模式下创建并动态更新一个柱状图。它首先创建一个柱状图,然后在循环中生成随机数据并更新柱子的高度,每次更新后暂停0.1秒,清除并重新绘制图像。
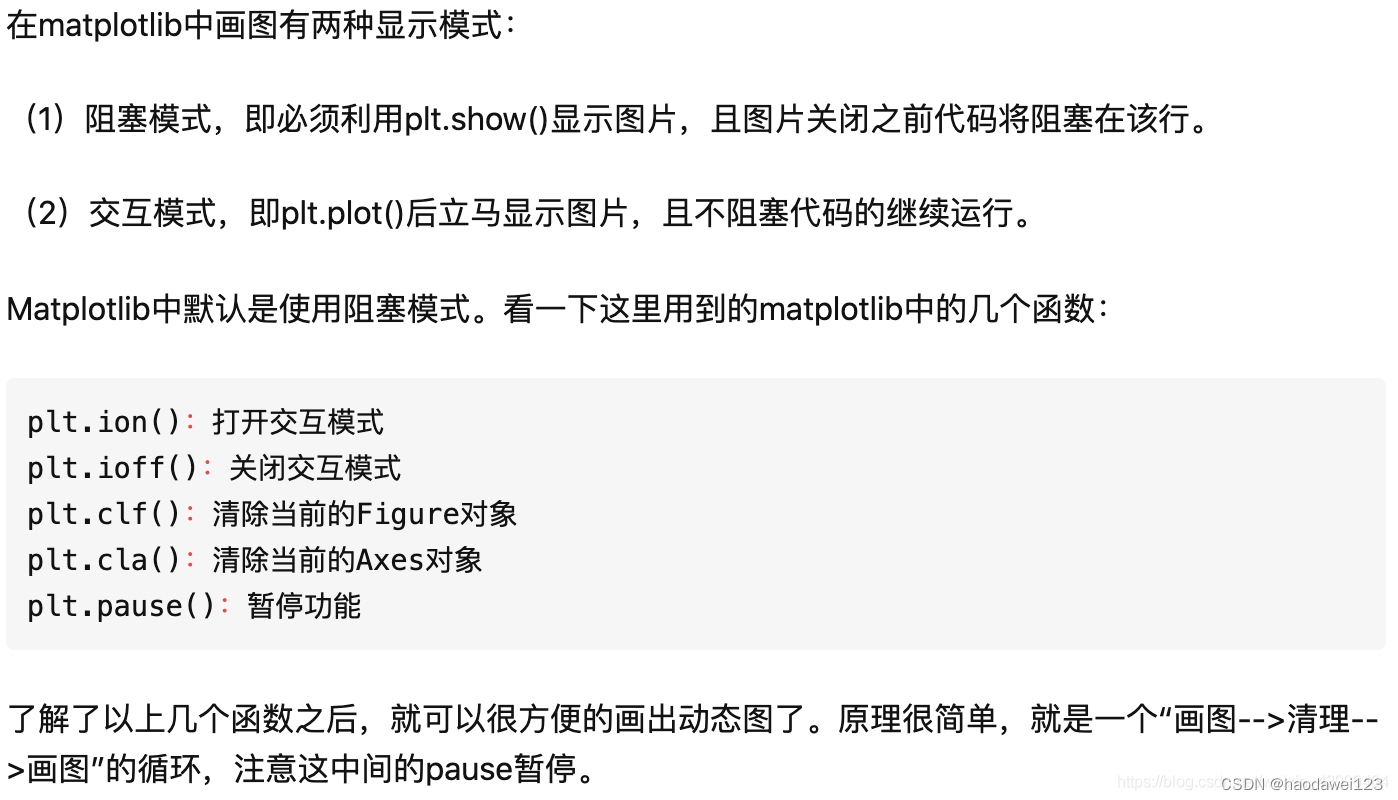
plt.ion()打开交互开关
plt.ioff()关闭交互开关
plt.pause(0.1)暂停0.1秒
plt.clf()#清除当前的Figure图像
plt.cla()#清除当前的Axex图像
import matplotlib.pyplot as plt
import numpy as np
import time
from matplotlib.backends.backend_tkagg import FigureCanvasTkAgg
import PySimpleGUI as sg
import matplotlib
# 创建一个点数为 8 x 6 的窗口, 并设置分辨率为 80像素/每英寸
plt.figure(figsize=(10, 10), dpi=80)
# 再创建一个规格为 1 x 1 的子图
# plt.subplot(1, 1, 1)
# 柱子总数
N = 10
# 包含每个柱子对应值的序列
values = (56796,42996,24872,13849,8609,5331,1971,554,169,26)
# 包含每个柱子下标的序列
index = np.arange(N)
# 柱子的宽度
width = 0.45
# 绘制柱状图, 每根柱子的颜色为紫罗兰色
plt.bar(index, values, width, label="num", color="#87CEFA")
# 设置横轴标签
plt.xlabel('clusters')
# 设置纵轴标签
plt.ylabel('number of reviews')
# 添加标题
plt.title('Cluster Distribution')
# 添加纵横轴的刻度
plt.xticks(index, ('mentioned1cluster', 'mentioned2cluster', 'mentioned3cluster', 'mentioned4cluster', 'mentioned5cluster', 'mentioned6cluster', 'mentioned7cluster', 'mentioned8cluster', 'mentioned9cluster', 'mentioned10cluster'))
# plt.yticks(np.arange(0, 10000, 10))
# 添加图例
plt.legend(loc="upper right")

plt.legend(loc="upper right")
plt.ion()#连续绘图,打开交互模式,plt.ioff()关闭交互模式
plt.show()
for i in range(50):
    ss=np.random.randint(-2000,2000,10)
    values+=ss
    print(values)


    plt.bar(index, values, width, label="num", color="#87CEFA")
    plt.pause(0.1)#暂停0.1秒
    if i<49:#不做个判断最后会删掉图像
        plt.clf()#清除当前的Figure图像
        plt.cla()#清除当前的Axex图像


 411
411

 被折叠的 条评论
为什么被折叠?
被折叠的 条评论
为什么被折叠?
 到【灌水乐园】发言


