


利用pyhanlp进行词频统计和词云图的绘制
python3.8环境,首先下载好visual studio,否则后续pip可能会报错。
https://visualstudio.microsoft.com/zh-hans/visual-cpp-build-tools/
我只勾选了c++和MSVC+Win11

pip install pyhanlp
导入需要的模块
事先建立python3.6的虚拟环境,安装好pyhanlp
#conda下
E:
jupyter notebook
import pandas as pd
import matplotlib.pyplot as plt
from pyhanlp import *
from wordcloud import WordCloud, STOPWORDS
import numpy as np
from PIL import Image
import collections

%matplotlib inline
font = {'family' : 'SimHei',
         'weight' : 'bold',
         'size'   : '16'}
plt.rc('font', **font)               # 设置字体的更多属性,
plt.rc('axes', unicode_minus=False)  # 解决坐标轴负数的负号显示问题

%config InlineBackend.figure_format = "retina"
如果下载 https://file.hankcs.com/hanlp/data-for-1.7.5.zip失败可手动下载到指定目录,并进行重命名。
读入数据
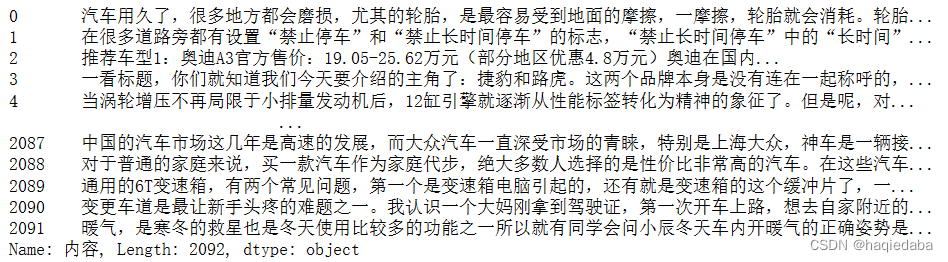
df = pd.read_excel("E:/corpus_data/今日头条新闻数据/今日头条-汽车.xlsx",engine='openpyxl')
df.iloc[0]

df["内容"]
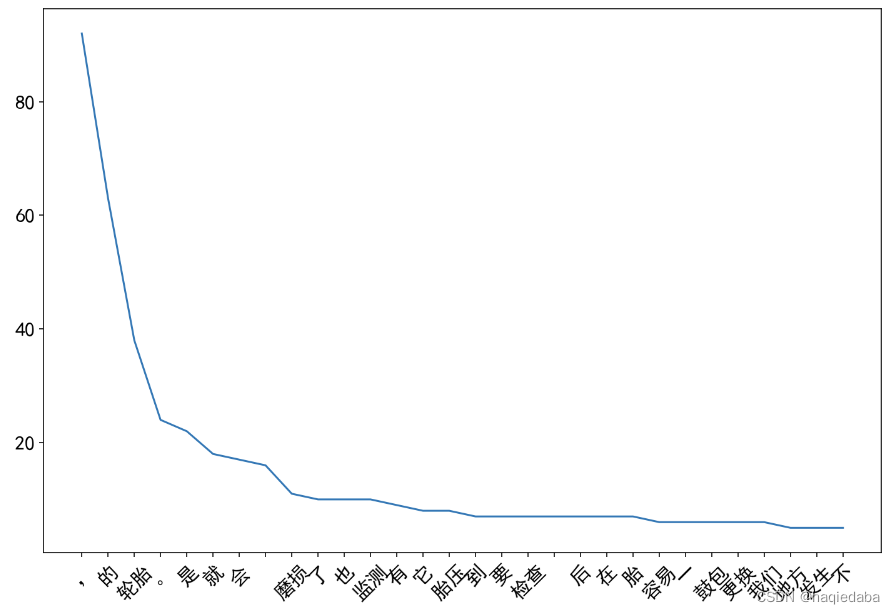
词频统计
data = HanLP.segment(df["内容"][0])

count = collections.Counter([term.word for term in data])

# word_list = sorted(count.items(), key = lambda x:x[1], reverse = True)
word_list = count.most_common(30)

word,freq = zip(*word_list)

plt.figure(figsize=(12,8))
plt.plot(word[:30],freq[:30])
plt.xticks(rotation=45)
plt.show()
画词云图
customer_stopwords = [word.strip() for word in open('stopwords.txt',encoding='utf-8')]
stopwords = set()
stopwords.update(customer_stopwords)
car_mask = np.array(Image.open("car.png"))
# WordCloud 文档:http://amueller.github.io/word_cloud/index.html
def wordcloudplot(freq_dict):
    wordcloud = WordCloud(font_path='C:\\Windows\\Fonts\\msyh.ttc',
                          background_color="white",   #可以选择black或white
                          margin=5, width=1800, height=800, # 长宽度控制清晰程度
                          stopwords=stopwords,
                          mask=car_mask,
                          contour_width=3,
                          contour_color='steelblue')
    wordcloud = wordcloud.generate_from_frequencies(freq_dict)
    # Open a plot of the generated image
    plt.imshow(wordcloud)
    plt.axis("off")
    plt.show()
wordcloudplot(dict(count))

import wordcloud
print(wordcloud.__file__)
# 去除停用词
count_dict = dict(count)
res = {}
for key in count_dict:
    if key not in stopwords:
        res[key] = count_dict[key]
wordcloudplot(res)

import pyhanlp
print(pyhanlp.__file__)
print(HanLP.segment("坚定不移反对腐败"))
得到:[坚定不移/vl, 反对/v, 腐败/an]


 2万+
2万+


 被折叠的 条评论
为什么被折叠?
被折叠的 条评论
为什么被折叠?
 到【灌水乐园】发言


