


摘要
作者通过人对一幅画中是否有目标的响应时间定义图像的搜索难度。同时还分析图像属性,如图像尺寸、文件大小、边缘长度,超像素个数对视觉搜索难度产生的影响。文中采用卷积神经网络和回归模型对图像搜索难度进行预测,与ground-truth对比,取得较好效果。模型正确排名75%图对(这个后面说明与采用的评估方法有关)。模型同时对未出现在训练集的新类有很好的泛化效果。文中实验部分使用该模型用于弱监督目标定位(8%性能提升)和半监督目标分类(1%的性能提升)。
2.人如何量化图像目标搜索难度
文中定义目标搜索难度:人需要确定图像中目标是否存在的响应时间。响应时间依赖于图像中的以下因素:图像中与目标不相关的物体个数、目标个数、目标尺寸、目标位置、类标签的类别、目标在其中的上下文关系。基于上面这些因素作者选择PASCAL VOC 2012数据集(包含20类,每张图片标记了目标的bounding boxes)。下面会具体介绍如何获得搜索目标人的响应时间.
2.1测量响应时间做法:
1. 提问标记者这张图中是否存在某个类
2. 向标记者显示图片
3. 记录从显示图片至回答“Yes” or "No"花费的时间
该时间就是该图目标搜索难度值。图片标签使用736人标记,这些人回答准确率都在90%以上.
数据后处理和数据清洗:
每张图像有六个标签,由不同的标记者生成,剔除响应时间大于20s,减均值,除标准差,归一化。若标记者标记个数少于3个,剔除该标记者的标签,因为没有代表性。若标记者标记个数少于10个且平均响应时间大于10s,剔除该标记者的标签。剩余每张图像的标签可能少于6个,可能还存在错误的标记,考虑到标记者回答准确率都在90%以上,说明这张图像确实搜索难度较大,增加错误的标记惩罚,增加困难分数。剔除异常值后在对每张图片去几何平均值(通常算数平均值大于几何平均值)。
评估标记者标记的一致性:
选取56张图片,58名可信任标记者(标记准确率大于90%)。假设X表示其中一个标记者生成的标签包含N = 56张图片的标签、Y表示所有标记者标记均值,第i(1<=i<=N)个值分别用Xi、Yi表示。X与Y中的对应元素组成一个元素对集合XY,其包含的元素为(Xi, Yi)(1<=i<=N)。当集合XY中任意两个元素(Xi, Yi)与(Xj, Yj)的排行相同时,若出现情况1或2时(情况1:Xi>Xj且Yi>Yj,情况2:Xi < Xj且 Yi < Yj),这两个元素就被认为是一致的。当出现情况3或4时(情况3:Xi>Xj且Yi < Yj,情况4:Xi < Xj且Yi > Yj),这两个元素被认为是不一致的。当出现情况5或6时(情况5:Xi=Xj,情况6:Yi=Yj),这两个元素既不是一致的也不是不一致的。下面公式C表示符合情况1或者情况2图像对个数,D表示符合情况3或者情况4图像对个数。
Kenddallτ
可以评估两变量之间的一致性。
下表 Kenddallτ 均值0.562说明标记者标记的图像对与所有标记者的标记均值,80%的图像对是一致的。作者评估这个参数为了表明标记者的标签是可靠。
| - | Mean | Minimum | Maximum |
|---|---|---|---|
| Kendall τ | 0.562 ± 0.127 | 0.182 | 0.818 |
2.2 评估构成图像搜索难度的因素
给定PASCAL VOC 2012数据集(包含20类,每张图片标记了目标的bounding boxes以及视角,及人工标记的搜索困难分数)。作者评估了如下表图像属性与搜索难度的相关性。表格最后一项作者综合所有属性训练Support Vector Regression( ν - SVR)1,回归值与ground-truth最一致,即 Kenddallτ 是最高的。
| Image property | Kenddallτ |
|---|---|
| (i) number of objects | 0.32 |
| (ii) mean area covered by objects | −0.28 |
| (iii) non-centeredness | 0.29 |
| (iv) number of different classes | 0.33 |
| (v) number of truncated objects | 0.22 |
| (vi) number of occluded objects | 0.26 |
| (vii) number of difficult objects | 0.20 |
| (viii) combine (i) to (vii) with ν-SVR | 0.36 |
2.3 评估类标签的搜索难度
作者统计了相同类的搜索困难分数,与当前性能最好深度卷积网络2进行比较,说明人与机器判断分歧不是很大。
| Class | Score | mAP | Class | Score | mAP |
|---|---|---|---|---|---|
| bird | 3.081 | 92.5% | bicycle | 3.414 | 90.4% |
| cat | 3.133 | 91.9% | boat | 3.441 | 89.6% |
| aeroplane | 3.155 | 95.3% | car | 3.463 | 91.5% |
| dog | 3.208 | 89.7% | bus | 3.504 | 81.9% |
| horse | 3.244 | 92.2% | sofa | 3.542 | 68.0% |
| sheep | 3.245 | 82.9% | bottle | 3.550 | 54.4% |
| cow | 3.282 | 76.3% | tv monitor | 3.570 | 74.4% |
| motorbike | 3.355 | 86.9% | dining table | 3.571 | 74.9% |
| train | 3.360 | 95.5% | chair | 3.583 | 64.1% |
| person | 3.398 | 95.2% | potted plant | 3.641 | 60.7% |
3.建模预测图像目标搜索难度
3.1回归模型
作者选用两个深度网络3,VGG-f4, VGG-verydeep-165提取特征,然后用Support Vector Regression( ν - SVR)6或者KRR7拟合ground-truth.
3.2 Baselines
3.3 实验分析
| Model | MSE | Kenddallτ |
|---|---|---|
| Random scores | 0.458 | 0.002 |
| Image area | - | 0.052 |
| Image file size | - | 0.106 |
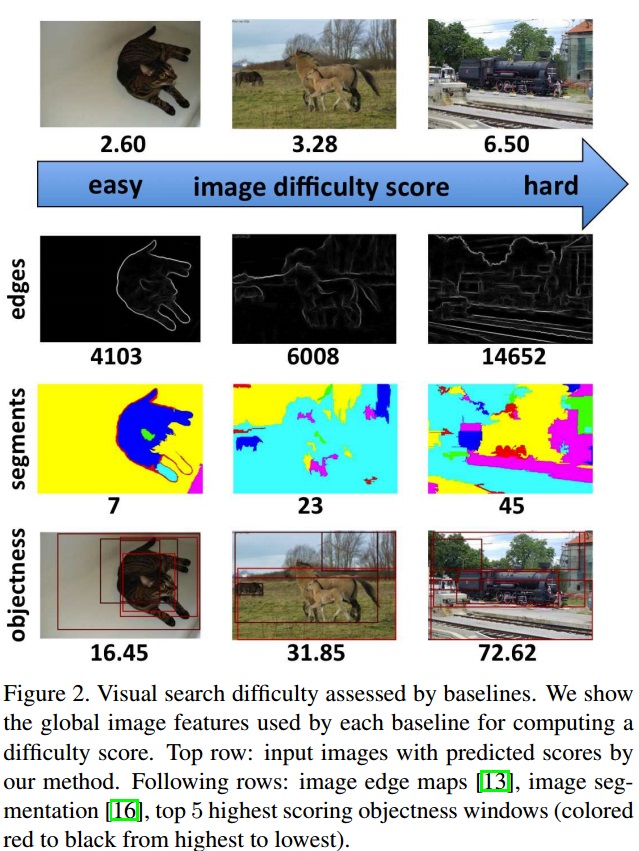
| Objectness [1, 2] | - | 0.238 |
| Edge strengths [13] | - | 0.240 |
| Number of segments [16] | - | 0.271 |
| Combination with ν-SVR | 0.264 | 0.299 |
| VGG-f + KRR | 0.259 | 0.345 |
| VGG-f + ν-SVR | 0.236 | 0.440 |
| VGG-f + pyramid + ν-SVR | 0.234 | 0.458 |
| VGG-f + pyramid + flip + ν-SVR | 0.233 | 0.459 |
| VGG-vd + ν-SVR | 0.235 | 0.442 |
| VGG-vd + pyramid + ν-SVR | 0.232 | 0.467 |
| VGG-vd + pyramid + flip + ν-SVR | 0.231 | 0.468 |
| VGG-f + VGG-vd + pyramid + flip + ν-SVR | 0.231 | 0.472 |
NOTE: Objectness 表示一张图里面有多个采样窗口,每个窗口通过objectness measure得到objectness score,通过求和所有窗口objectness score得到一张图片的搜索困难分数。
分析结论:
- 中层特征(如Objectness、Edge strengths、Number of segments)相比于低层特征(Image area、Image file size),在图像搜索难度上有更强的相关性。
- 结合深度网络预测的分数与ground-truth计算 Kenddallτ 相比baseline的 Kenddallτ 都高。
- 最后一项结合两个深度网络、金字塔、图像水平镜像、Support Vector Regression( ν - SVR)8算出的 Kenddallτ 达到0.434,即72%图像对是标记对的, 接近于人工标记 Kenddallτ 的平均值0.562(即80%图像标记正确)。
- 跨类预测 Kenddallτ 达到0.427与未跨类预测 Kenddallτ 值0.472相比,两者差距较小,说明特征具有鲁棒性。
4.应用
4.1弱监督目标定位
主要想法:与传统的MIL不同的,该实验首先评估图像的搜索困难分数,用较容易识别的图像训练SVM,逐渐添加难度较大的图片,作者把这套模型称为Easy-to-Hard MIL.(弱监督是不知道图片中目标位置信息)
实验流程:用到VGG-f + VGG-vd + pyramid + flip + ν-SVR模型用于评估一幅图像的搜索困难分数,根据分数把数据集分成3份,每份迭代三次。首先提取图像的proposal,然后在PASCAL VOC 2012数据集上用DCNN(ILSVRC预训练好)提取倒二层的特征训练线性SVM。
| Model | Iteration 1 | Iteration 2 | Iteration 3 | Iteration 4 | Iteration 5 | Iteration 6 | Iteration 7 | Iteration 8 | Iteration 9 |
|---|---|---|---|---|---|---|---|---|---|
| Standard MIL | 26.5% | 29.9% | 31.8% | 32.7% | 33.3% | 33.6% | 33.9% | 34.3% | 34.4% |
| Easy-to-Hard MIL | 31.1% | 36.1% | 36.8% | 38.9% | 40.1% | 40.8% | 42.1% | 42.4% | 42.8% |
Table 5. CorLoc results for standard MIL versus Easy-to-Hard MIL.
Q:这部分不是很理解对比传统方法为什么能提升+8.4%的性能?
4.2半监督目标分类
所谓的半监督是只有图像中是否存在某个类,并没有位置信息。
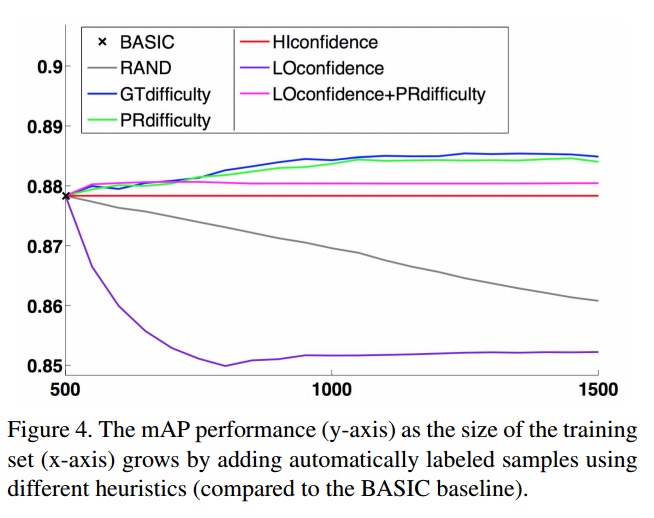
试验流程:模型同样选用CNN提取特征,线性SVM分类。数据集分成三份:一份标记的训练集,一份未标记的训练集,一份未标记的测试集。使用启发式算法从未标记数据集逐渐增加到标记的训练集。
启发式策略:
(i)RAND:随机挑选样本.
(ii)GTdifficulty:在grouth-truth里选择前k个搜索困难分数较低的样本.
(iii)PRdifficulty:根据模型评分搜索困难分数选择前k个分数较低的样本.
(iv)HIconfidence:选取离超平面最远的前k个样本.
(v)LIconfidence:选取离超平面最近的前k个样本.
(vi)LOconfidence+PRdifficulty:选取离差超平面最近的前K个样本,根据搜索困难评分在选取前k个分数较低的样本.
结果分析:
- 随机挑选启发式到时性能下降.
- 根据搜索困难分数的启发式可以提高超平面的分类准确率.
- J. Shawe-Taylor and N. Cristianini. Kernel Methods for Pattern Analysis. Cambridge University Press, 2004. ↩
- K. Chatfield, K. Simonyan, A. Vedaldi, and A. Zisserman. Return of the devil in the details: Delving deep into convolutional nets. In Proceedings ofBMVC, 2014. ↩
- A. Vedaldi and K. Lenc. MatConvNet – Convolutional Neural Networks for MATLAB. In Proceeding of ACMMM,2015. ↩
- K. Chatfield, K. Simonyan, A. Vedaldi, and A. Zisserman.Return of the devil in the details: Delving deep into convolutional nets. In Proceedings of BMVC, 2014. ↩
- K. Simonyan and A. Zisserman. Very deep convolutional networks for large-scale image recognition. CoRR,abs/1409.1556, 2014. ↩
- J. Shawe-Taylor and N. Cristianini. Kernel Methods for Pattern Analysis. Cambridge University Press, 2004. ↩
- J. Shawe-Taylor and N. Cristianini. Kernel Methods for Pattern Analysis. Cambridge University Press, 2004 ↩
- J. Shawe-Taylor and N. Cristianini. Kernel Methods for Pattern Analysis. Cambridge University Press, 2004. ↩


 1324
1324

 被折叠的 条评论
为什么被折叠?
被折叠的 条评论
为什么被折叠?
 到【灌水乐园】发言


