


文章目录
1. GeoServer发布单个图层的矢量切片
1.1 安装插件
下载插件
geoserver-2.13.3-vectortiles-plugin(需查找当前对应的GeoServer版本)
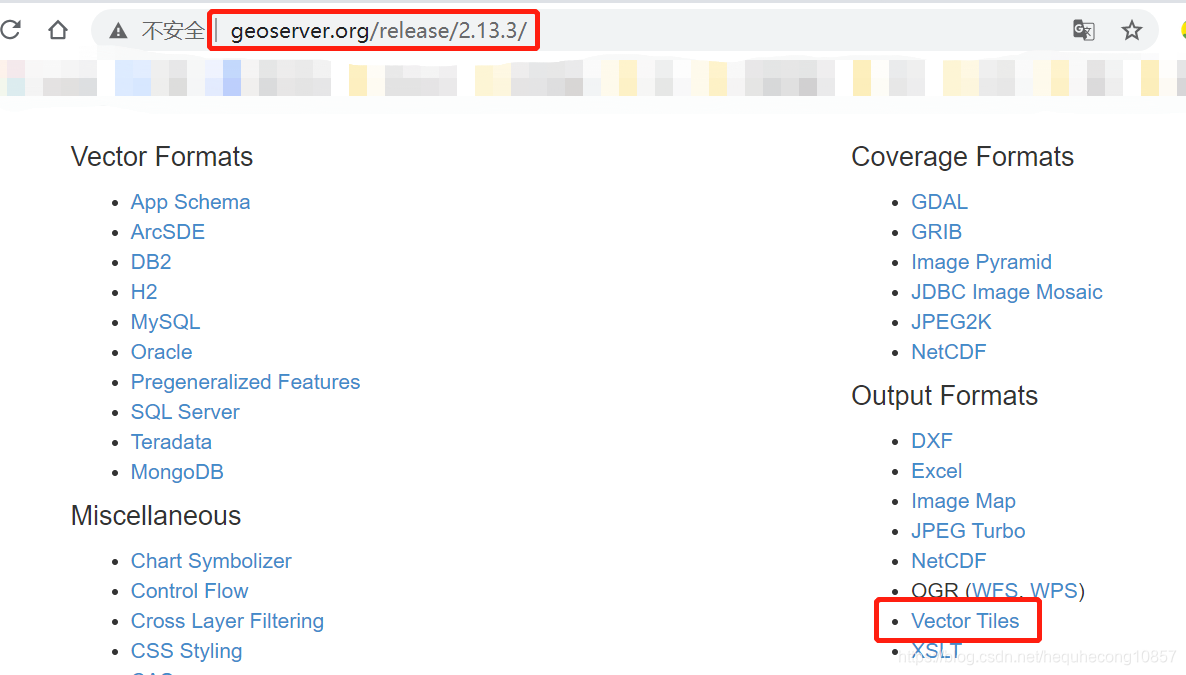
链接:http://geoserver.org/download/
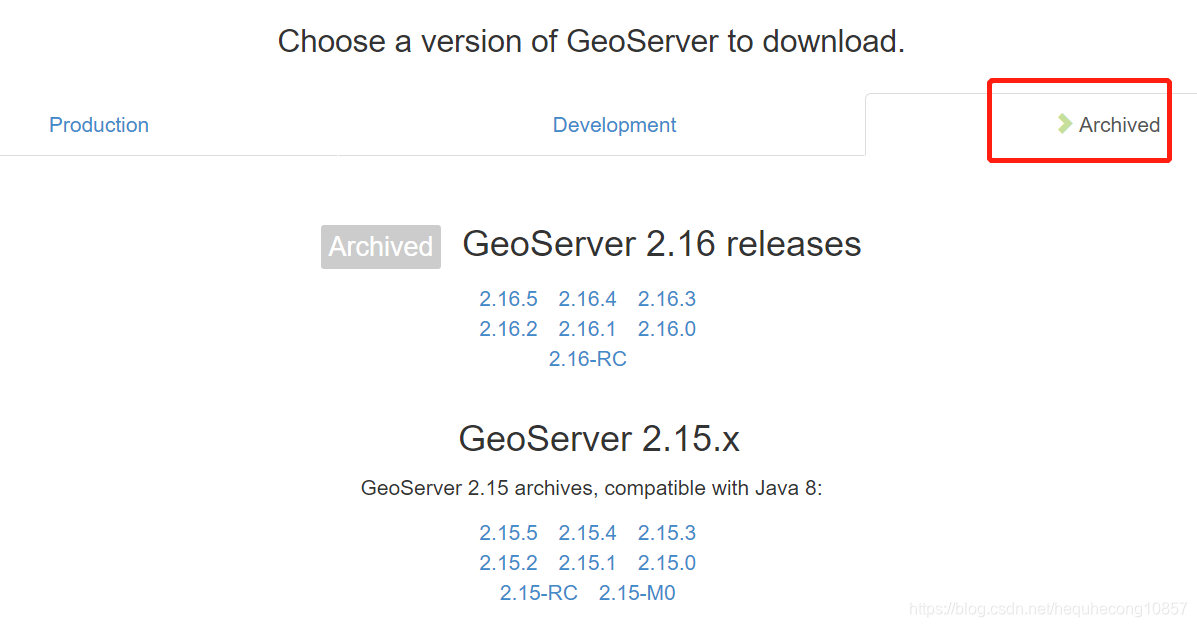
找到当前对应的GeoServer版本,点击Vector Tiles插件进入下载,解压后拷贝到geoserver\WEB-INF\lib路径下,重启GeoServer
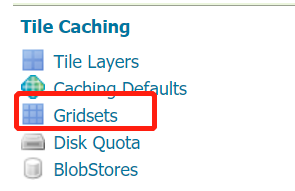
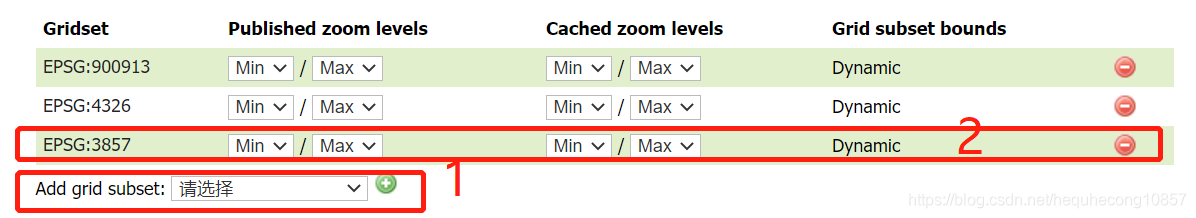
1.2 创建Gridsets
Mapbox GL只支持坐标为EPSG:3857的矢量切片,而GeoServer(version 2.13.3)默认没有该坐标系的Gridsets,需要自己手动创建
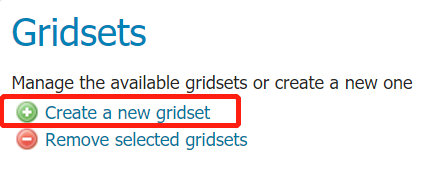
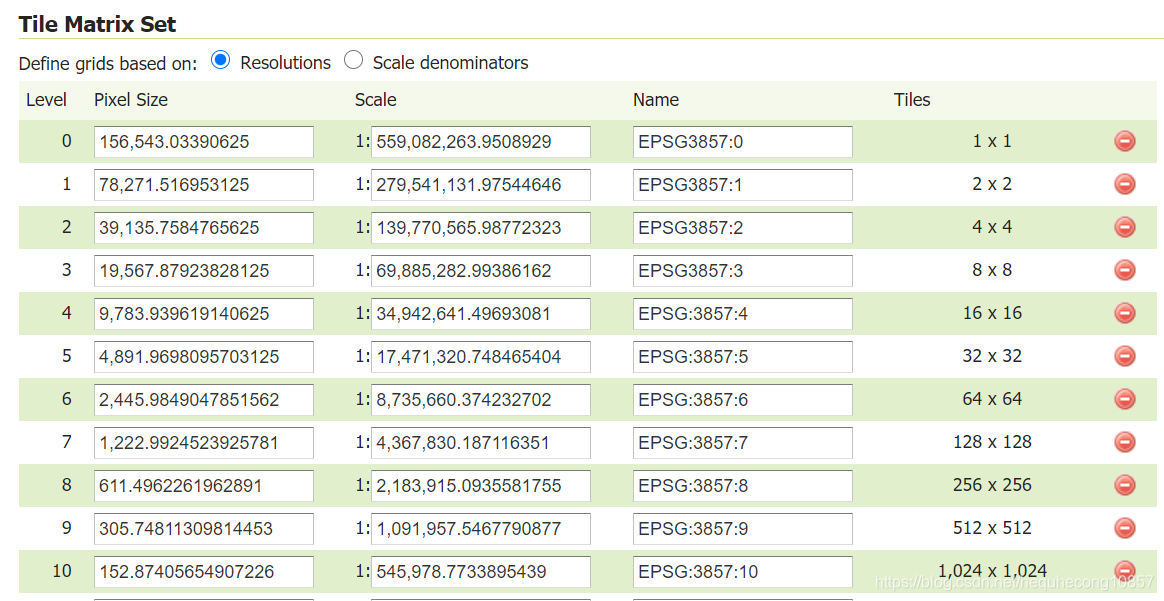
创建名为EPSG:3857的Gridsets:
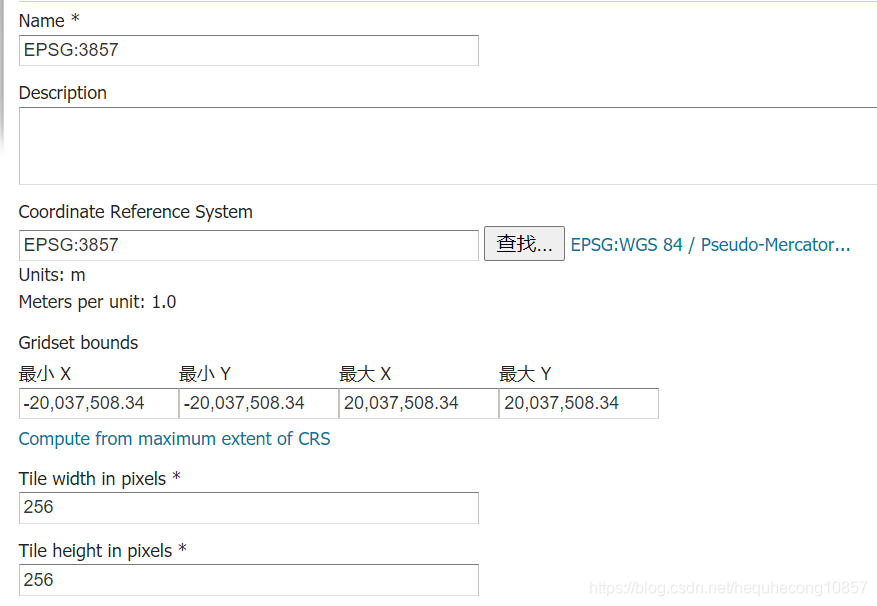
缩放层级可自行控制,我在此处共设置了22层。
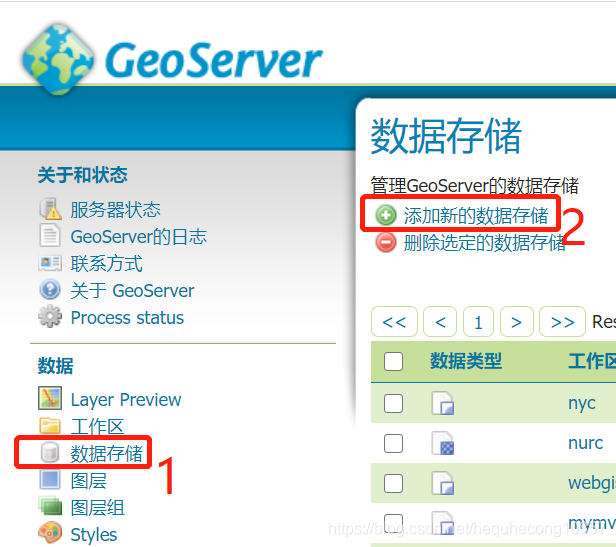
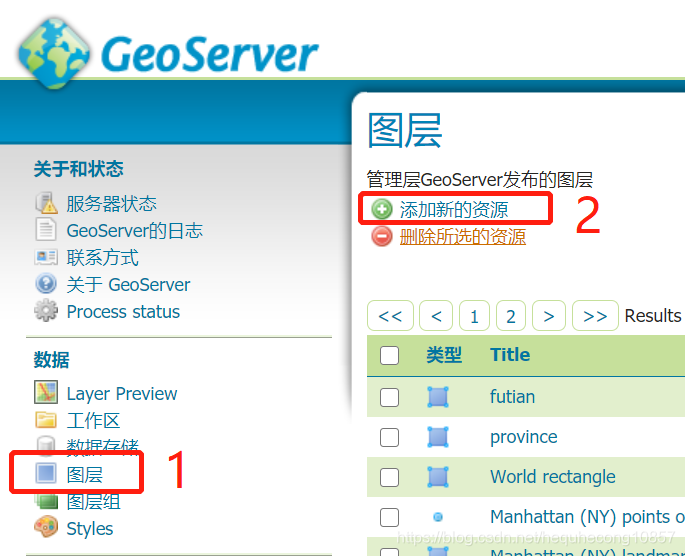
1.3 发布单个图层矢量切片
添加新的数据存储
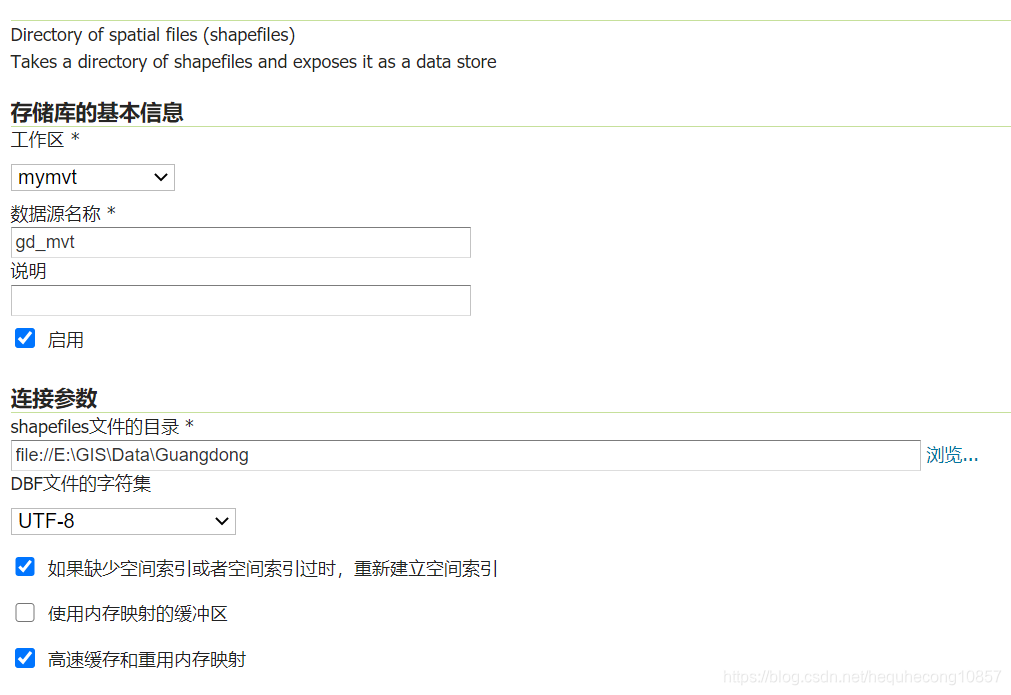
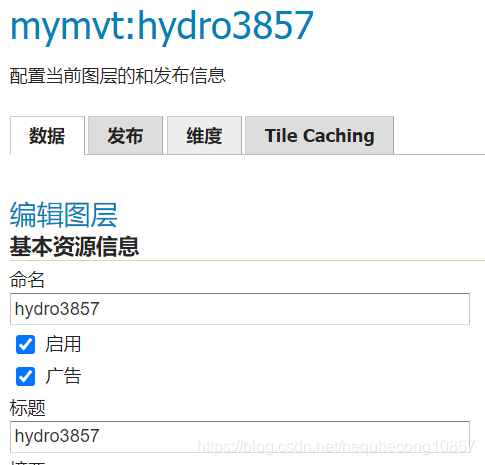
添加图层
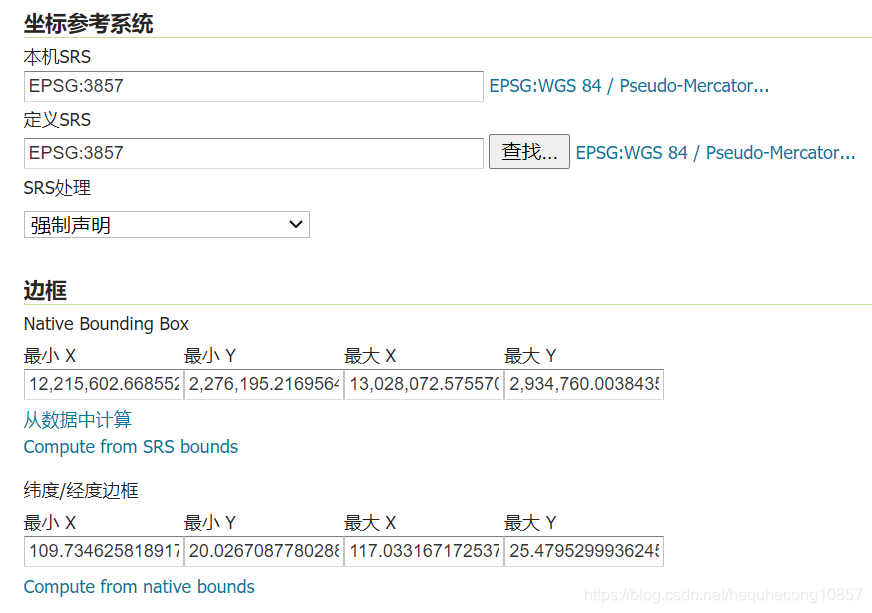
选择EPSG:3857坐标系,计算边框的范围
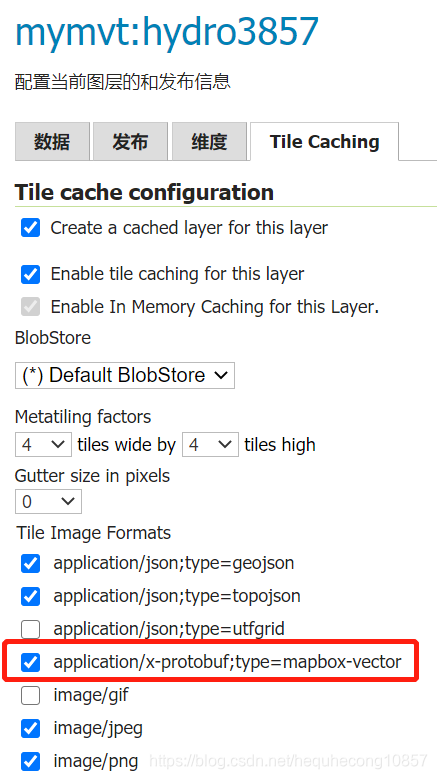
选择pbf格式
通过Add grid subset选项,添加先前创建的坐标系为EPSG:3857的Gridset。
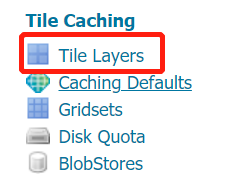
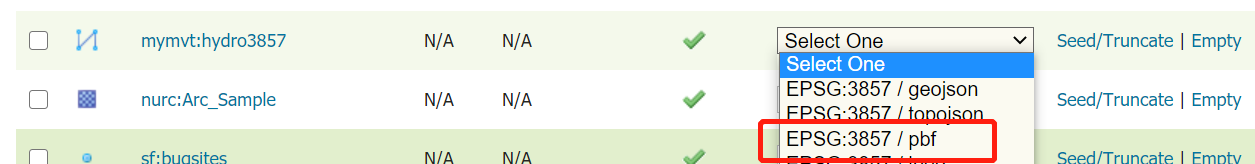
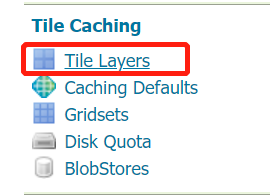
进入Tile Layers
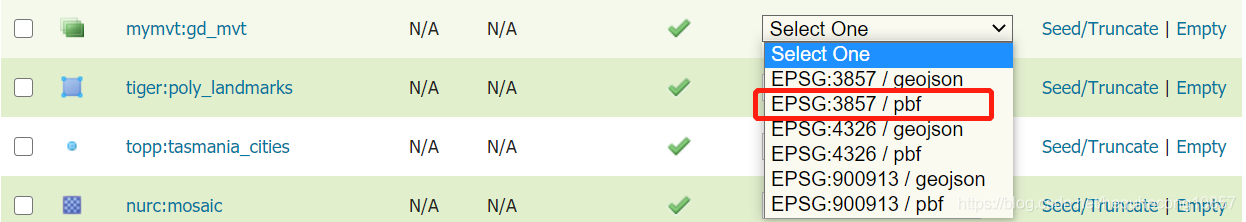
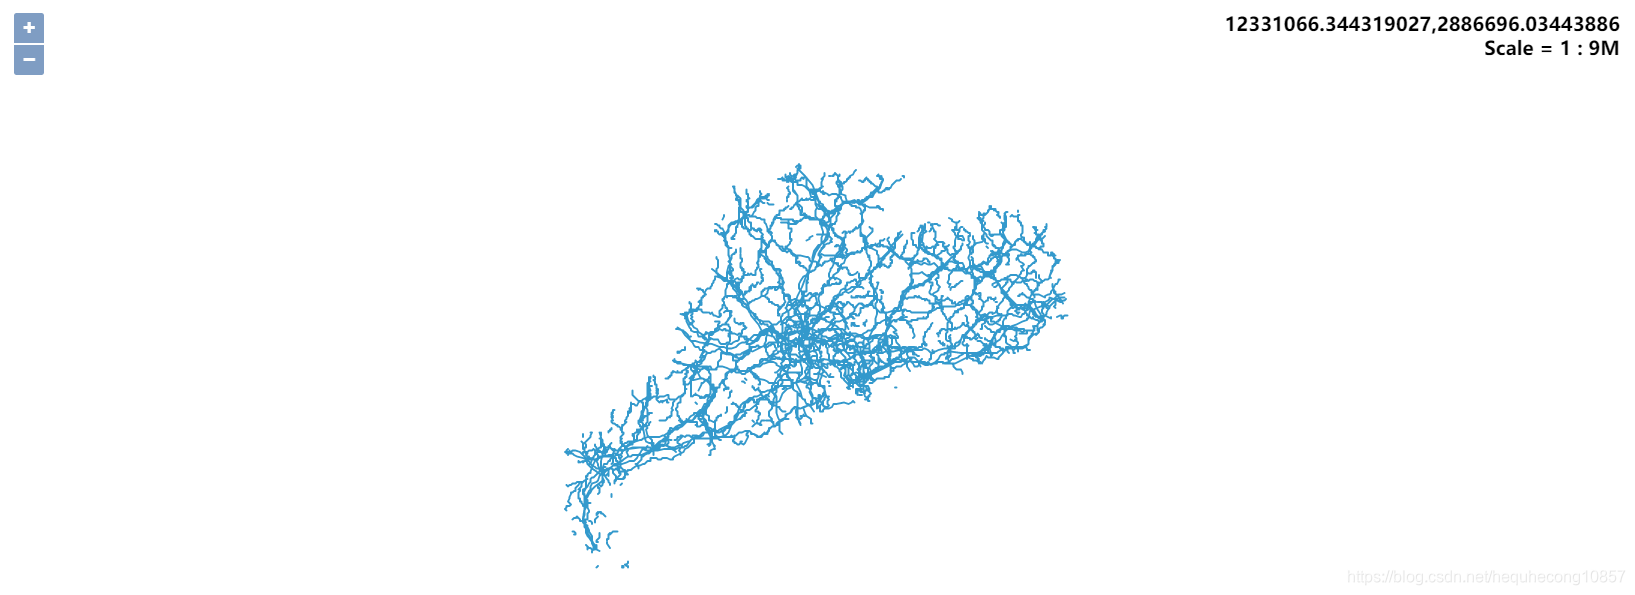
找到该图层,选择EPSG:3857 / pbf,预览能够正常显示,表示该矢量切片发布成功
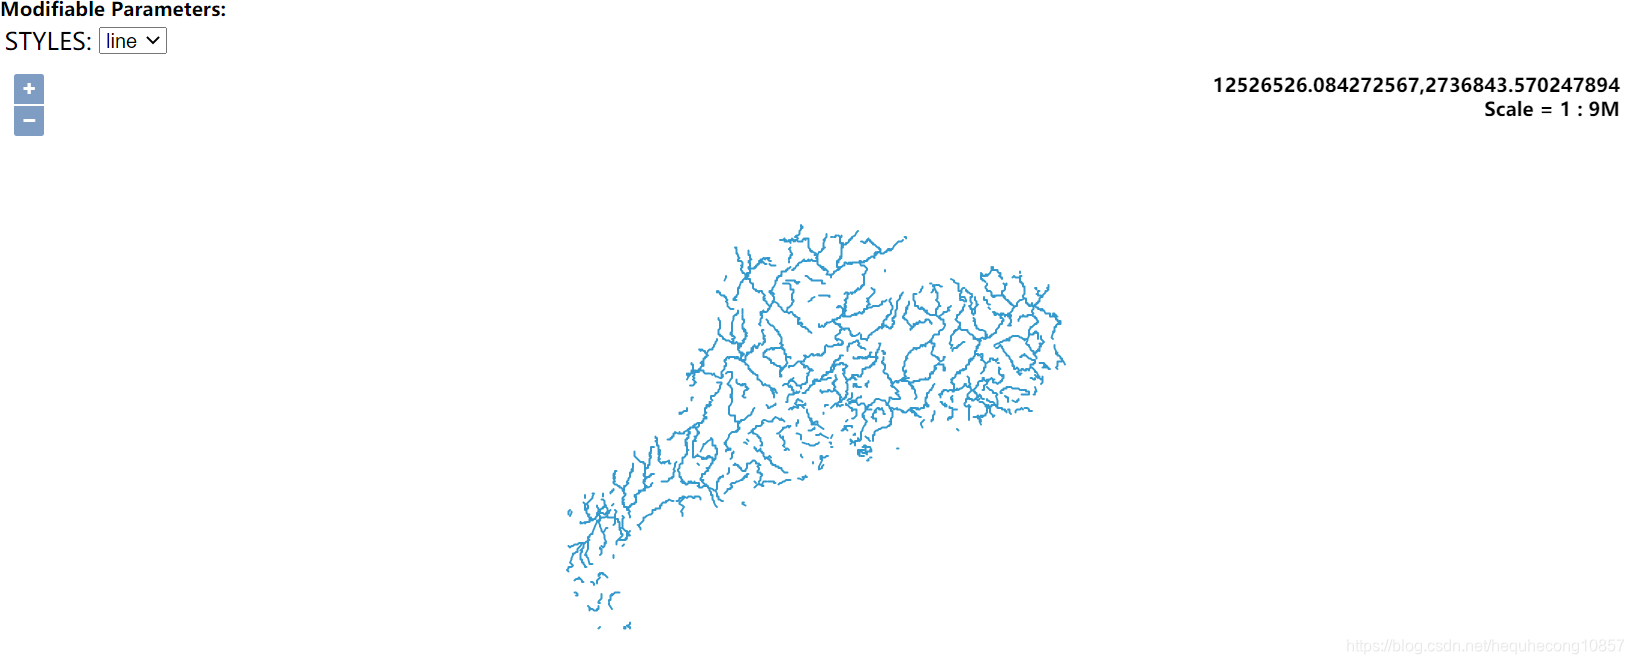
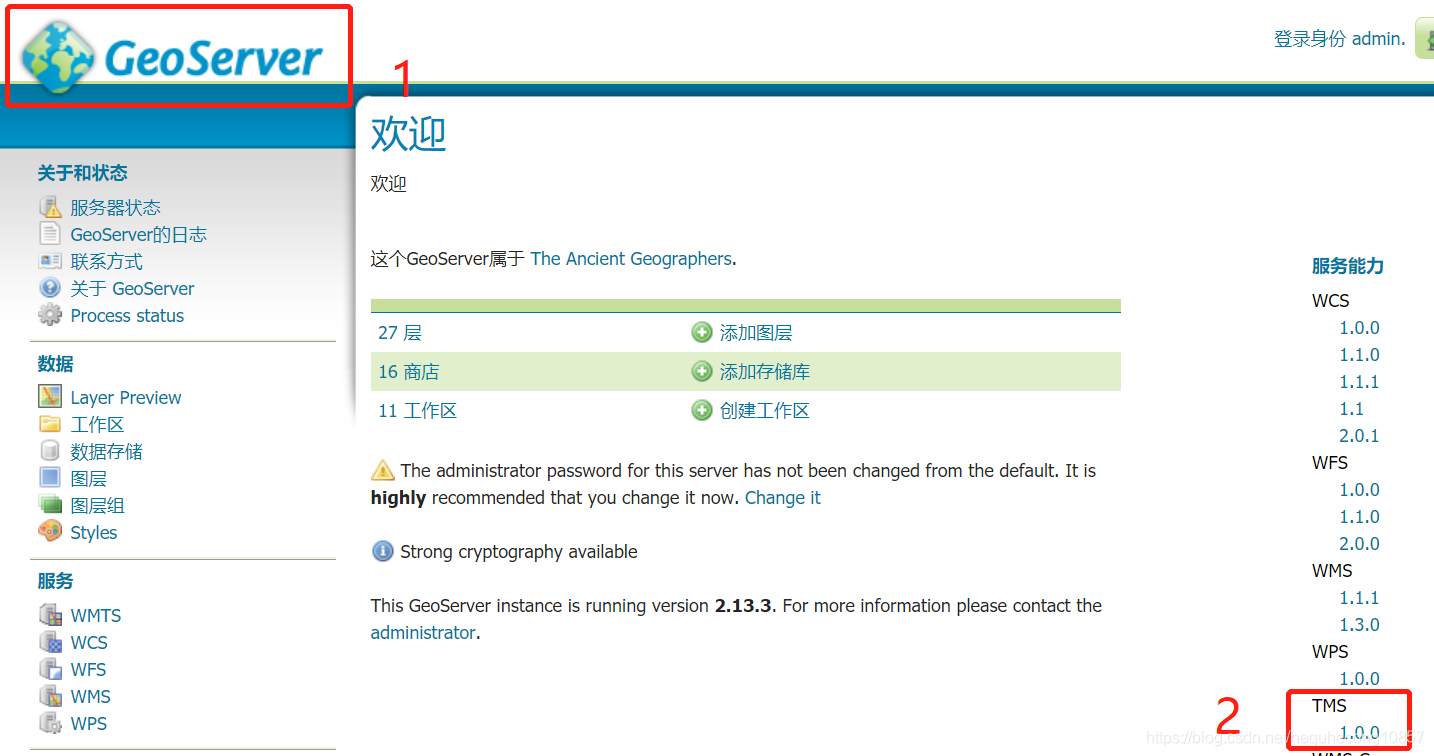
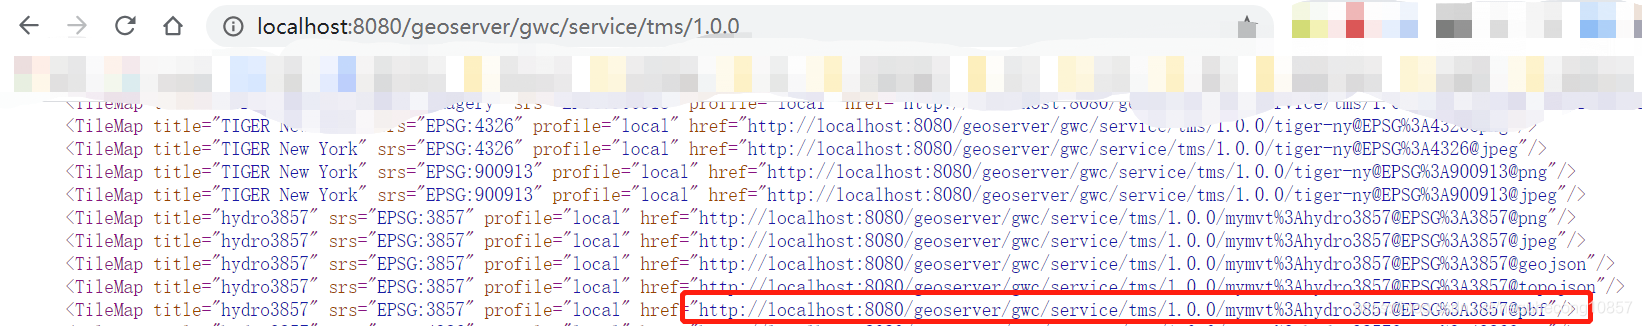
进入GeoServer首页,点击进入TMS服务页面,找到对应的pbf链接,放入代码中即可。
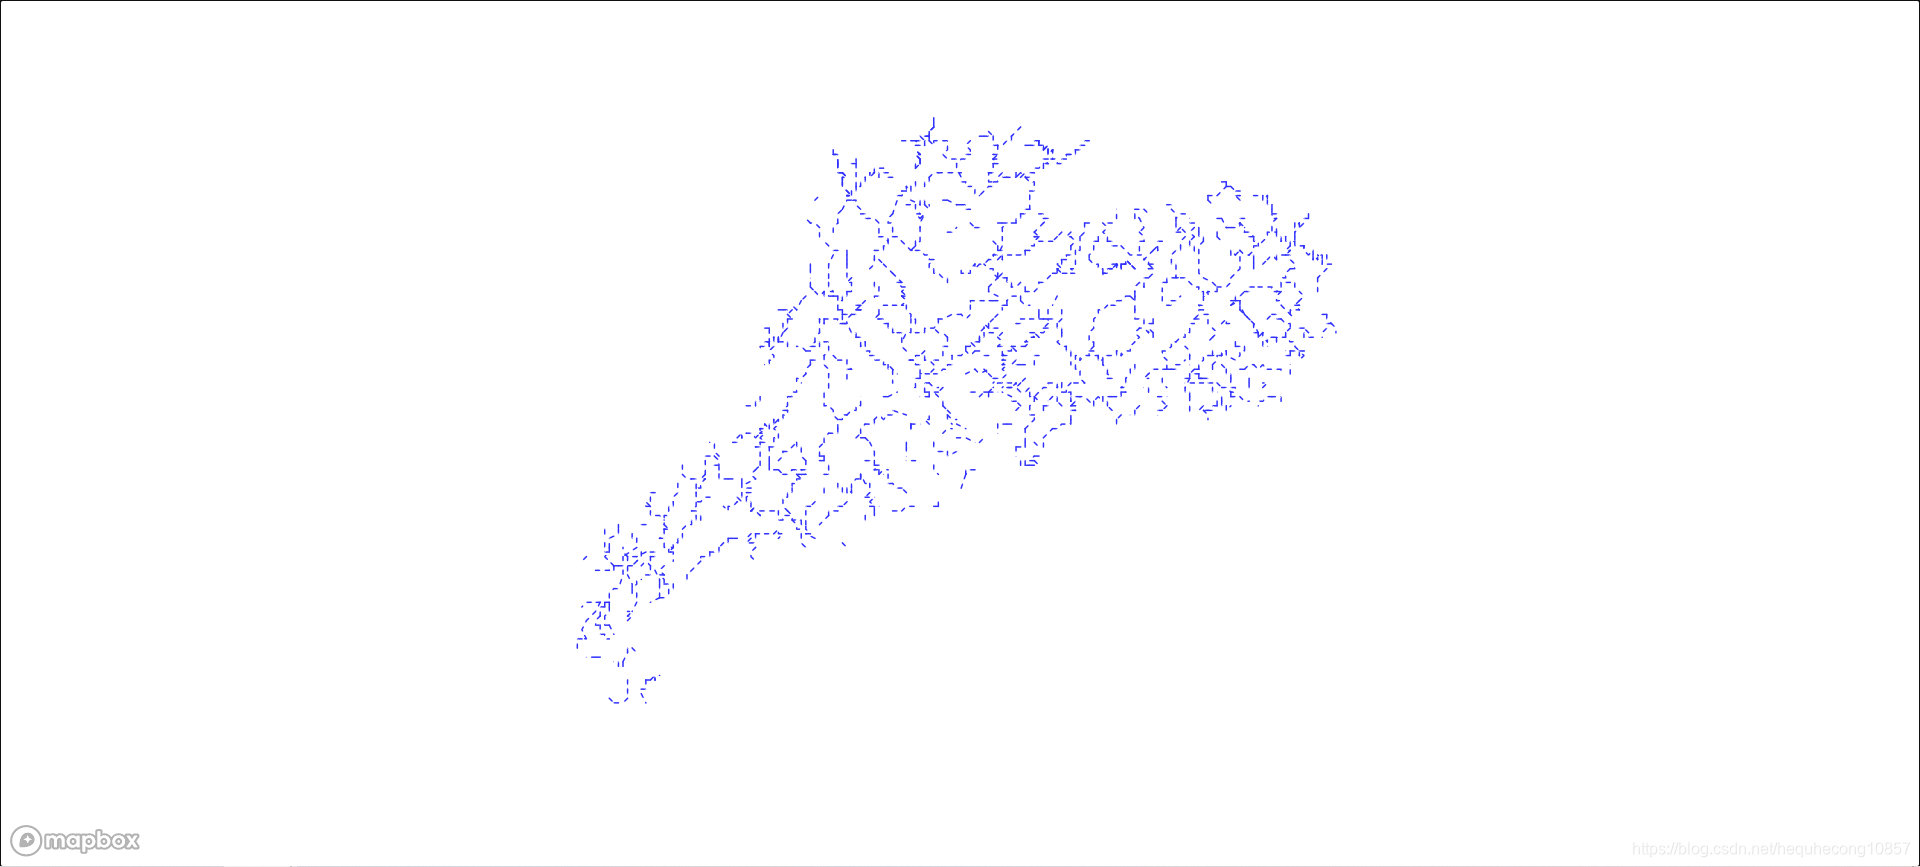
2. Mapbox GL 加载单个图层的矢量切片
<!DOCTYPE html>
<html>

<head>
  <meta charset='utf-8' />
  <title>加载第三方矢量切片</title>
  <meta name='viewport' content='initial-scale=1,maximum-scale=1,user-scalable=no' />
  <script src="https://api.mapbox.com/mapbox-gl-js/v2.1.0/mapbox-gl.js"></script>
  <link href="https://api.mapbox.com/mapbox-gl-js/v2.1.0/mapbox-gl.css" rel="stylesheet" />

  <style>
    body {
      margin: 0;
      padding: 0;
    }

    #map {
      position: absolute;
      top: 0;
      bottom: 0;
      width: 100%;
    }
  </style>
</head>

<body>
  <div id='map'></div>
  <script>
    mapboxgl.accessToken = 'your accessToken';
    var mapStyle = {
      "version": 8,
      "sources": {
        "composite": {
          "url": "mapbox://mapbox.mapbox-streets-v8",
          "type": "vector"
        },
        "os": {
          "type": "vector",
          "scheme": "tms",
          "tiles": [  "http://localhost:8080/geoserver/gwc/service/tms/1.0.0/mymvt%3Ahydro3857@EPSG%3A3857@pbf/{z}/{x}/{y}.pbf"
          ]
        },
      },
      "sprite": "mapbox://sprites/mapbox/streets-v8",
      "glyphs": "mapbox://fonts/mapbox/{fontstack}/{range}.pbf",
      "layers": [{
          "id": "background",
          "type": "background",
          "paint": {
            "background-color": "#ffffff"
          },
          "interactive": true
        },
        {
          "id": "hydro",
          "type": "line",
          "source": "os",
          "source-layer": "hydro3857",
          "layout": {
            "line-join": "round",
            "line-cap": "round"
          },
          "paint": {
            "line-color": "#3031ff",
            "line-width": 1,
            "line-dasharray": [1.5, 3]
          }
        },
      ]
    };

    var map = new mapboxgl.Map({
      container: 'map',
      style: mapStyle,
      zoom: 3,
      center: [112.08, 27.54]
    });
  </script>

</body>

</html>
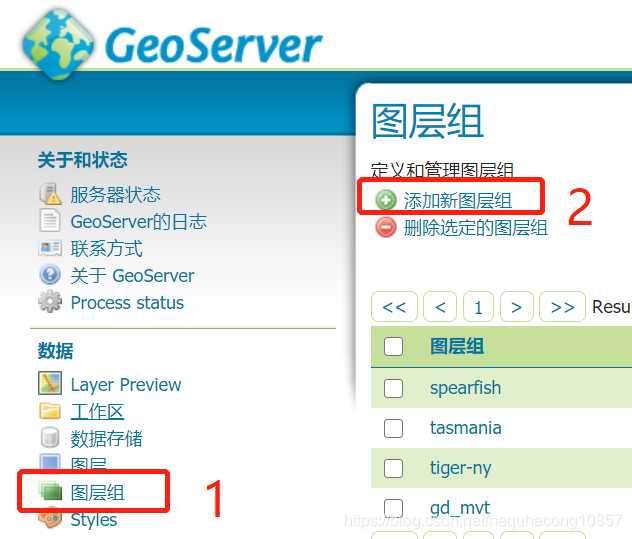
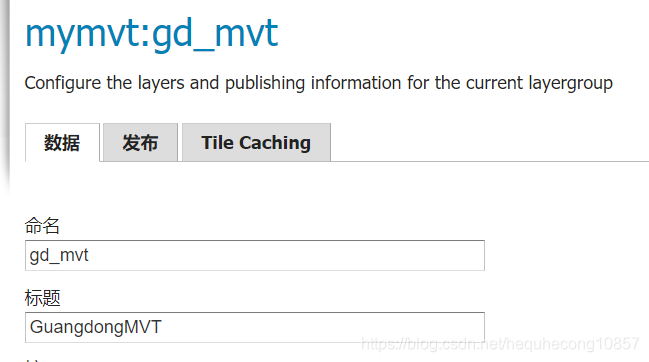
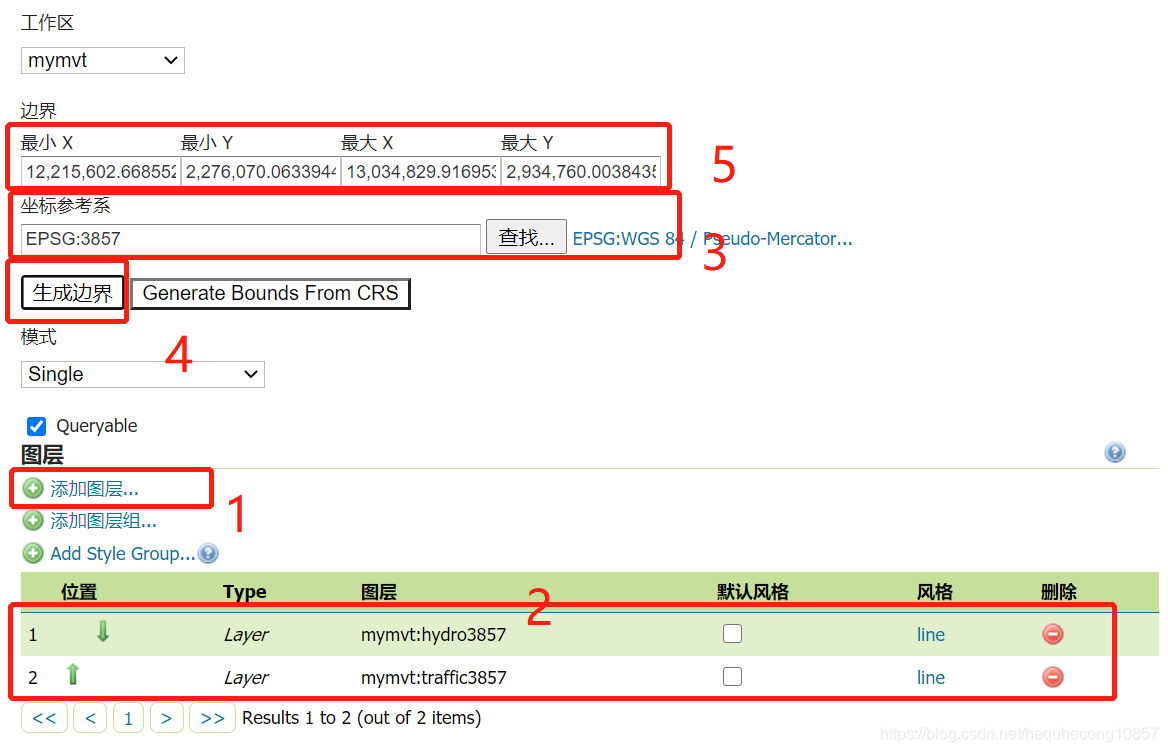
3. 图层组矢量切片发布与Mapbox GL 加载
创建图层组
先添加图层,调整图层顺序,设置坐标系,最后生成边界。
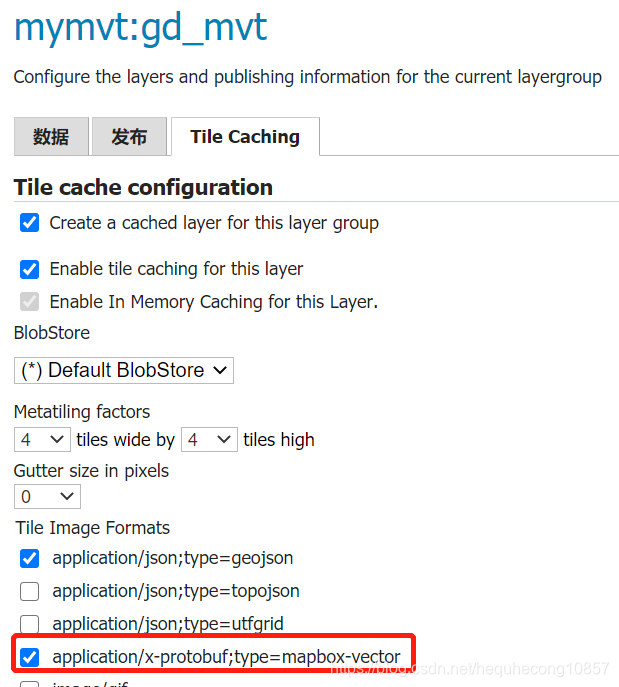
选择pbf格式
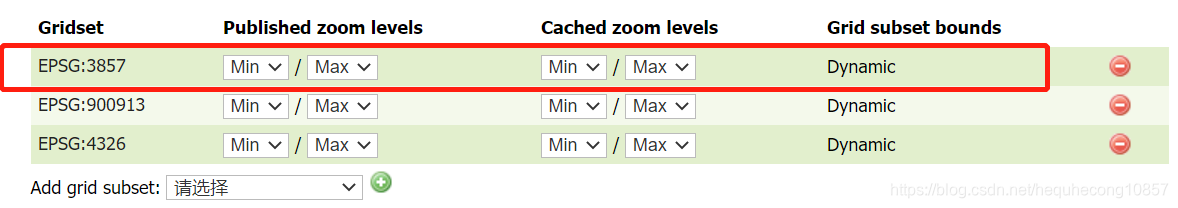
添加EPSG:3857的Gridsets
进入Tile Layers,找到EPSG:3857 / pbf 看能否正常发布
找到名为图层组名称的url链接,放入代码中

<!DOCTYPE html>
<html>

<head>
  <meta charset='utf-8' />
  <title>加载第三方矢量切片</title>
  <meta name='viewport' content='initial-scale=1,maximum-scale=1,user-scalable=no' />
  <script src="https://api.mapbox.com/mapbox-gl-js/v2.1.0/mapbox-gl.js"></script>
  <link href="https://api.mapbox.com/mapbox-gl-js/v2.1.0/mapbox-gl.css" rel="stylesheet" />

  <style>
    body {
      margin: 0;
      padding: 0;
    }

    #map {
      position: absolute;
      top: 0;
      bottom: 0;
      width: 100%;
    }
  </style>
</head>

<body>
  <div id='map'></div>
  <script>
    mapboxgl.accessToken = 'your accessToken ';
    var mapStyle = {
      "version": 8,
      "sources": {
        "composite": {
          "url": "mapbox://mapbox.mapbox-streets-v8",
          "type": "vector"
        },
        "os": {
          "type": "vector",
          "scheme": "tms",
          "tiles": [ "http://localhost:8080/geoserver/gwc/service/tms/1.0.0/mymvt%3Agd_mvt@EPSG%3A3857@pbf/{z}/{x}/{y}.pbf"
          ]
        },
      },
      "sprite": "mapbox://sprites/mapbox/streets-v8",
      "glyphs": "mapbox://fonts/mapbox/{fontstack}/{range}.pbf",
      "layers": [{
          "id": "background",
          "type": "background",
          "paint": {
            "background-color": "#ffffff"
          },
          "interactive": true
        },
        {
          "id": "traffic",
          "type": "line",
          "source": "os",
          "source-layer": "traffic3857",
          "layout": {
            "line-join": "round",
            "line-cap": "round"
          },
          "paint": {
            "line-color": "#C1FFC1",
            "line-width": 2
          },
          "interactive": true
        },
        {
          "id": "hydro",
          "type": "line",
          "source": "os",
          "source-layer": "hydro3857",
          "layout": {
            "line-join": "round",
            "line-cap": "round"
          },
          "paint": {
            "line-color": "#3031ff",
            "line-width": 1,
            "line-dasharray": [1.5, 3]
          }
        },
      ]
    };

    var map = new mapboxgl.Map({
      container: 'map',
      style: mapStyle,
      zoom: 3,
      center: [112.08, 27.54]
    });
  </script>

</body>

</html>
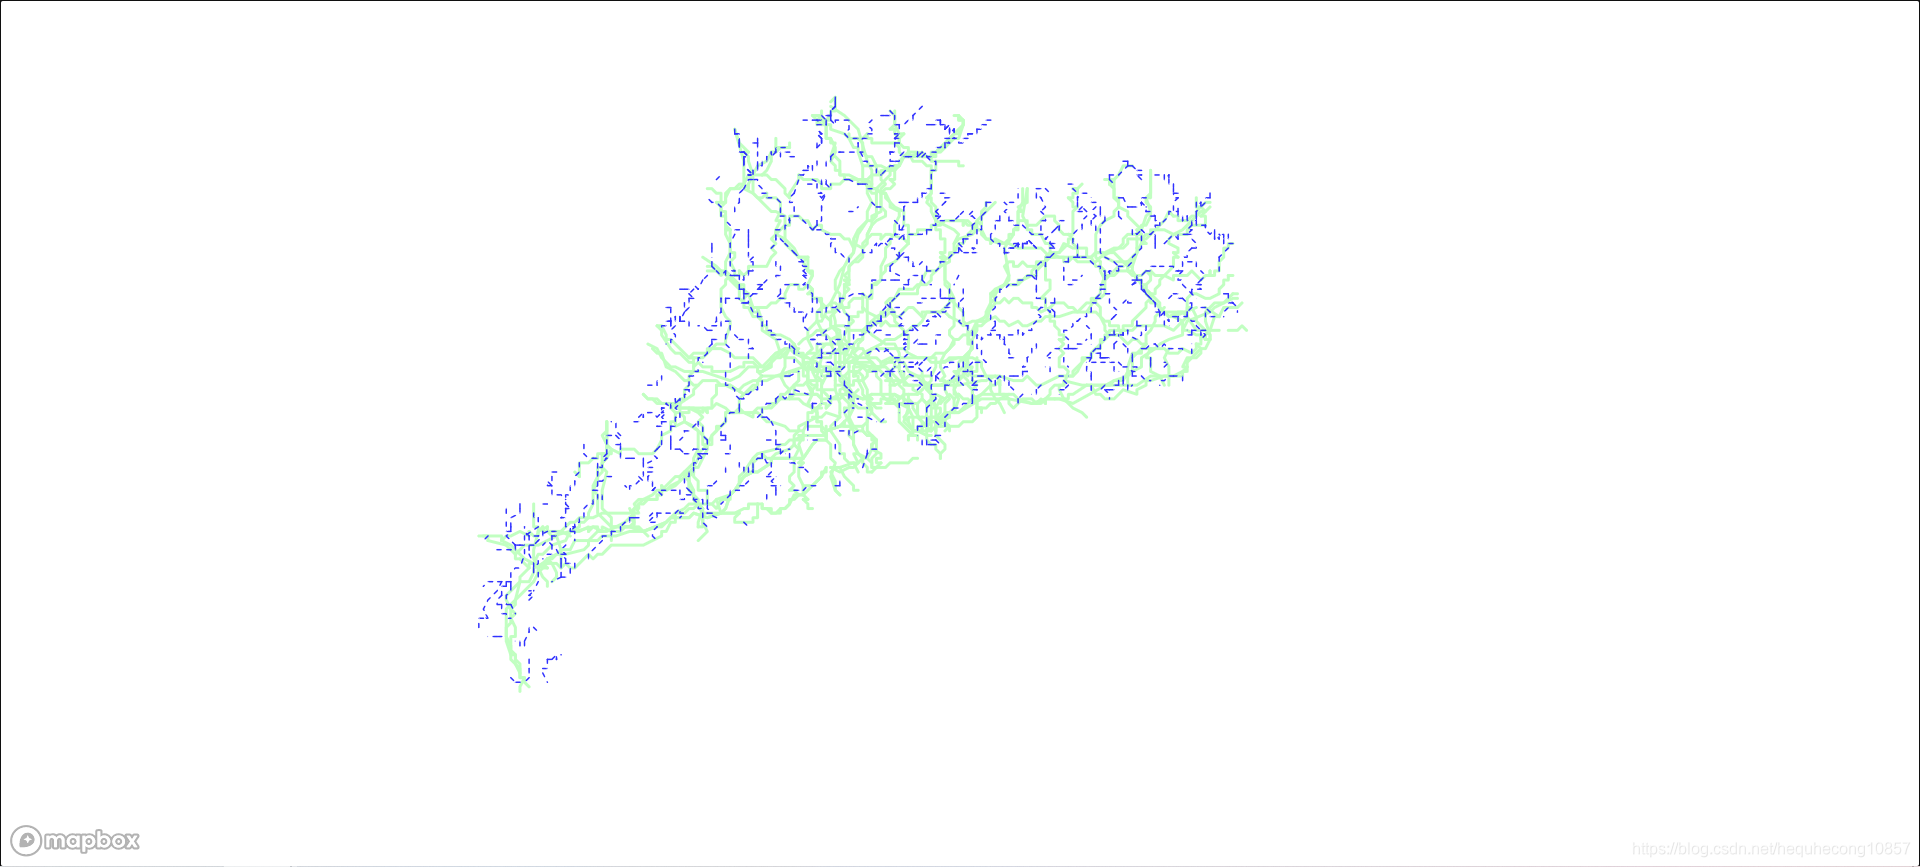
大功告成,结束!
参考文章
1. geoserver发布矢量切片(pbf,geojson,png等)
2. 在vue中使用leaflet加载矢量切片(pbf)
3. GeoServer发布mapbox vector tile (MVT)并在地图上展示(符号化)
4. 利用geoserver发布矢量切片服务,进行切图到本地以及使用leaflet加载显示
5. 利用geoserver发布矢量切片,mapbox进行调用


 1223
1223

 被折叠的 条评论
为什么被折叠?
被折叠的 条评论
为什么被折叠?
 到【灌水乐园】发言


