


分享一下我老师大神的人工智能教程!零基础,通俗易懂!http://blog.csdn.net/jiangjunshow
也欢迎大家转载本篇文章。分享知识,造福人民,实现我们中华民族伟大复兴!
iPhone下的图形框架并不是很多。其中比较知名的就两个s7graphview和CorePlot。巧的是两个都是Google的。前者使用简单,但功能单一,只能画曲线图。后者是开源项目,项目仍在不断更新中,用起来可就复杂多了,而且各个版本会有差异,包括属性、方法,甚至是类名都有改变。
关于Core Plot使用的中文网上资料,不是缺乏,而是根本没有。唯一的一篇介绍得比较详细的文章是“UsingCore Plot in an iPhone Application”, 原文是英文的:http://www.switchonthecode.com/tutorials/using-core-plot-in-an-iphone-application。
但时间真的是太老了,居然是09年5月发表的,原文很多地方已经不再适用。因此我费了好大的劲,才把原文中的代码跑通了,不敢独享,与各位共享之。
一、下载安装Core Plot框架
原文介绍的是“源代码”版本。首先下载并安装Mercurial(很简单,在http://www.selenic.com/mercurial/wiki/有标准Mac安装包下载),再使用命令:
hg clone http://core-plot.googlecode.com/hg/core-plot
即可把Core Plot项目源代码下载到指定目录core-plot下。
截至本文发表时止,Core Plot已经提供了Mac标准安装器CorePlotInstaller_0.2.2.zip ,你可以直接用安装器安装,可以很方便地把Core Plot直接以SDK的方式安装到本机。SDK的使用方法见后一篇博文《Core Plot SDK的用法》。
二、如何在项目中使用Core Plot
由于iOS的限制,Core Plot以静态库的形式链接到iPhone应用。在core-plot/framework目录下存在CorePlot-CocoaTouch.xcodeproj文件,这就是一个静态库项目。关于静态库的使用,前一篇博文《封装自己的控件库:iPhone静态库的应用》已经有介绍,使用方法都是一样的。
1、新建Windows-base Application项目。
2、使用Add->Existing Files…,把CorePlot-CocoaTouch.xcodeproj添加到新项目中。
3、把libCorePlot-CocoaTouch.a最右边的“add to target”小框勾上。
4、选择Target “info->General”,添加对项目CorePlot-CocoaTouch的依赖(引用)。
5、选择新项目的“info->Build”,在“Header Search Paths”中添加CorePlot头文件搜索路径,如: /Users/kmyhy/core-plot/framework。注意要选中“Recursive”小勾(英文原文中没有提这一点)。同时,在OtherLinker Flags中要增加两个选项:-ObjC和-all_load(英文原文中遗漏了第2个选项)。
6、新建一个ViewController,如TestViewController。在本例中,我们勾选了“WithXib”选项。在英文原文中,要求在Interface Build中把xib的View对象由UIView改为CPLayerHostingView(其实应当是CPGraphHostingView)。但在这里,其实没有必要,只需在源代码中修改就可以了。
7、.h文件:
#import <UIKit/UIKit.h>
#import "CorePlot-CocoaTouch.h"
@interface TestViewController : UIViewController <CPPlotDataSource>{
CPXYGraph *graph;
}
@end
8、.m文件:
#import "TestViewController.h"
@implementation TestViewController
-(NSUInteger)numberOfRecordsForPlot:(CPPlot*)plot {
return 51;
}
-(NSNumber *)numberForPlot:(CPPlot*)plot field:(NSUInteger)fieldEnum recordIndex:(NSUInteger)index{
double val = (index/5.0)-5;
if(fieldEnum== CPScatterPlotFieldX)
{ return [NSNumber numberWithDouble:val]; }
else
{
if(plot.identifier== @"X Squared Plot")
{ return[NSNumber numberWithDouble:val*val]; }
else
{ return[NSNumber numberWithDouble:1/val]; }
}
}
- (void)viewDidLoad {
//[super viewDidLoad];
graph = [[CPXYGraph alloc] initWithFrame: self.view.bounds];
//原来的CPLayerHostingView由CPGraphHostingView所代替
self.view = [[CPGraphHostingView alloc]initWithFrame:[UIScreen mainScreen].bounds];
CPGraphHostingView*hostingView = (CPGraphHostingView *)self.view;
hostingView.hostedGraph = graph;
graph.paddingLeft = 20.0;
graph.paddingTop = 20.0;
graph.paddingRight = 20.0;
graph.paddingBottom = 20.0;
CPXYPlotSpace *plotSpace= (CPXYPlotSpace *)graph.defaultPlotSpace;
plotSpace.xRange = [CPPlotRange plotRangeWithLocation:CPDecimalFromFloat(-6)
length:CPDecimalFromFloat(12)];
plotSpace.yRange = [CPPlotRange plotRangeWithLocation:CPDecimalFromFloat(-5)
length:CPDecimalFromFloat(30)];
CPLineStyle *lineStyle= [CPLineStyle lineStyle];
//CPLineStyle的lineColor和lineWidth已经变为只读属性
// lineStyle.lineColor = [CPColor blackColor];
// lineStyle.lineWidth = 2.0f;
CPXYAxisSet *axisSet =(CPXYAxisSet *)graph.axisSet;
//majorIntervalLength的类型由NSDecimalNumber 改变为 NSDecimal
axisSet.xAxis.majorIntervalLength = [[NSDecimalNumber decimalNumberWithString:@"5"] decimalValue];
axisSet.xAxis.minorTicksPerInterval = 4;
axisSet.xAxis.majorTickLineStyle =lineStyle;
axisSet.xAxis.minorTickLineStyle =lineStyle;
axisSet.xAxis.axisLineStyle =lineStyle;
axisSet.xAxis.minorTickLength = 5.0f;
axisSet.xAxis.majorTickLength = 7.0f;
//axisLableOffset属性由labelOffset所代替
axisSet.xAxis.labelOffset=3.0f;
// axisSet.xAxis.axisLabelOffset = 3.0f;
axisSet.yAxis.majorIntervalLength = [[NSDecimalNumber decimalNumberWithString:@"5"] decimalValue];
axisSet.yAxis.minorTicksPerInterval = 4;
axisSet.yAxis.majorTickLineStyle =lineStyle;
axisSet.yAxis.minorTickLineStyle =lineStyle;
axisSet.yAxis.axisLineStyle =lineStyle;
axisSet.yAxis.minorTickLength = 5.0f;
axisSet.yAxis.majorTickLength = 7.0f;
//axisLableOffset属性由labelOffset所代替
axisSet.yAxis.labelOffset=3.0f;
// axisSet.yAxis.axisLabelOffset = 3.0f;
//CPPlotSpace的bounds属性不再有效
CPScatterPlot*xSquaredPlot = [[[CPScatterPlot alloc]
initWithFrame:self.view.bounds] autorelease];
//initWithFrame:graph.defaultPlotSpace.bounds]autorelease];
xSquaredPlot.identifier = @"XSquared Plot";
//CPLineStyle的lineColor和lineWidth已经变为只读属性
// xSquaredPlot.dataLineStyle.lineWidth = 1.0f;
// xSquaredPlot.dataLineStyle.lineColor = [CPColorredColor];
xSquaredPlot.dataSource = self;
[graph addPlot:xSquaredPlot];
CPPlotSymbol*greenCirclePlotSymbol = [CPPlotSymbol ellipsePlotSymbol];
greenCirclePlotSymbol.fill = [CPFill fillWithColor:[CPColor greenColor]];
greenCirclePlotSymbol.size = CGSizeMake(2.0, 2.0);
xSquaredPlot.plotSymbol =greenCirclePlotSymbol;
//CPPlotSpace的bounds属性不再有效
CPScatterPlot*xInversePlot = [[[CPScatterPlot alloc]
initWithFrame:self.view.bounds] autorelease];
//initWithFrame:graph.defaultPlotSpace.bounds]autorelease];
xInversePlot.identifier = @"XInverse Plot";
//CPLineStyle的lineColor和lineWidth已经变为只读属性
// xInversePlot.dataLineStyle.lineWidth = 1.0f;
// xInversePlot.dataLineStyle.lineColor = [CPColorblueColor];
xInversePlot.dataSource = self;
[graph addPlot:xInversePlot];
}
- (void)dealloc {
[super dealloc];
}
@end
仔细查看代码,你会发现原文中的代码被我做了一些修改和调整。
附一张Core Plot框架的类层次图,便于理解代码中各个对象的使用:
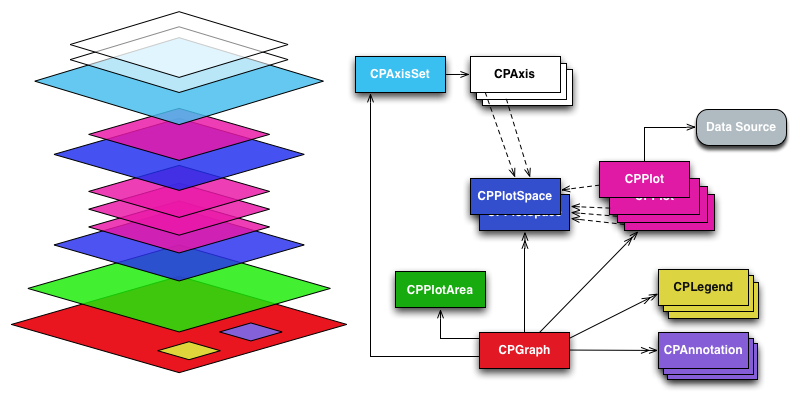
注意,右边各个类的颜色和左边各个层次的颜色是对应的。
给我老师的人工智能教程打call!http://blog.csdn.net/jiangjunshow


 2536
2536


 被折叠的 条评论
为什么被折叠?
被折叠的 条评论
为什么被折叠?
 到【灌水乐园】发言


