


目录
一、简介
Makie 是 Julia 编程语言的数据可视化生态系统,具有高性能和可扩展性。它适用于 Windows、Mac 和 Linux。使用 Julia 的内置包管理器添加一个或多个 Makie 后端包 GLMakie.jl (OpenGL)、CairoMakie.jl (Cairo) 或 WGLMakie.jl (WebGL)、RPRMakie (RadeonProRender)。每个后端都重新导出 Makie,因此无需单独安装。Makie 是整个绘图生态系统的名称,Makie.jl是描述绘图如何工作的主要包。要实际渲染和保存绘图,我们需要一个知道如何将绘图转换为图像或矢量图形的后端。
您可以使用三个主要后端来渲染图(有关更多信息,请查看后端):
-
CairoMakie.jl 适用于渲染矢量图形或高质量的 2D 图像并且不需要交互性或 3D 渲染。 -
GLMakie.jl 适用于需要交互式窗口和真正的 3D 渲染但没有矢量输出。 -
WGLMakie.jl它类似于GLMakie.jl但在网络浏览器中工作,而不是本机窗口。
本教程使用 CairoMakie,但代码可以在任何后端执行。请注意,CairoMakie 可以创建图像但不能进行图片显示。
要在使用 CairoMakie 时查看绘图命令的输出,我们建议您使用支持 png 或 svg 输出的 IDE,例如 VSCode、Atom/Juno、Jupyter、Pluto 等,或者尝试使用查看器包,例如 ElectronDisplay.jl,或者直接将绘图保存到文件中。Julia REPL 本身没有显示绘图的能力。
二、简单绘图
可绘制的统计图请参考:Plotting functions
1. 折线图
using CairoMakie

x = range(0, 10, length=100)
y = sin.(x)
lines(x, y)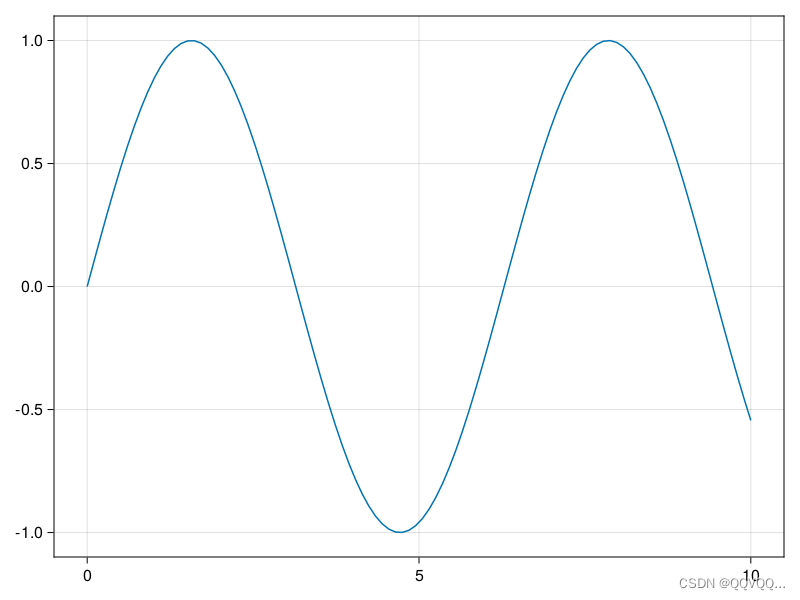
2. 散点图
using CairoMakie

x = range(0, 10, length=100)
y = sin.(x)
scatter(x, y)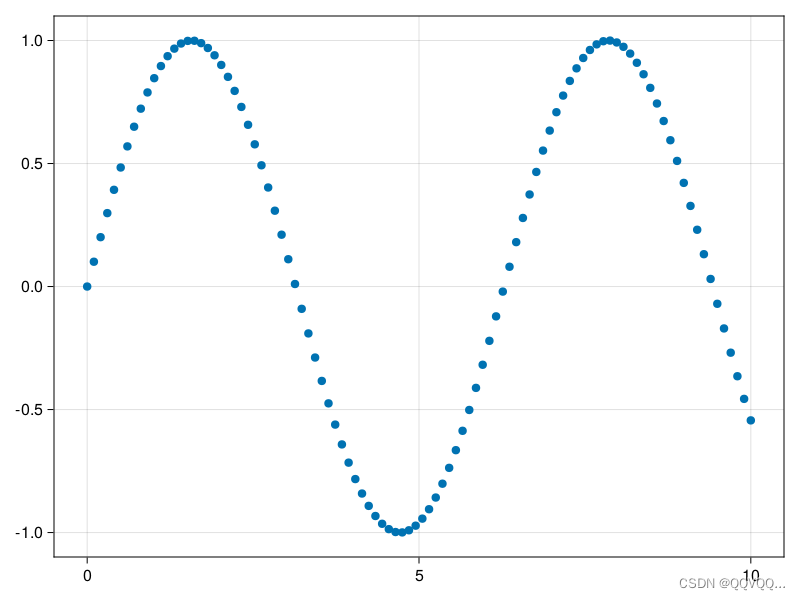
3. 直方图
using CairoMakie

data =randn(100)
hist(data)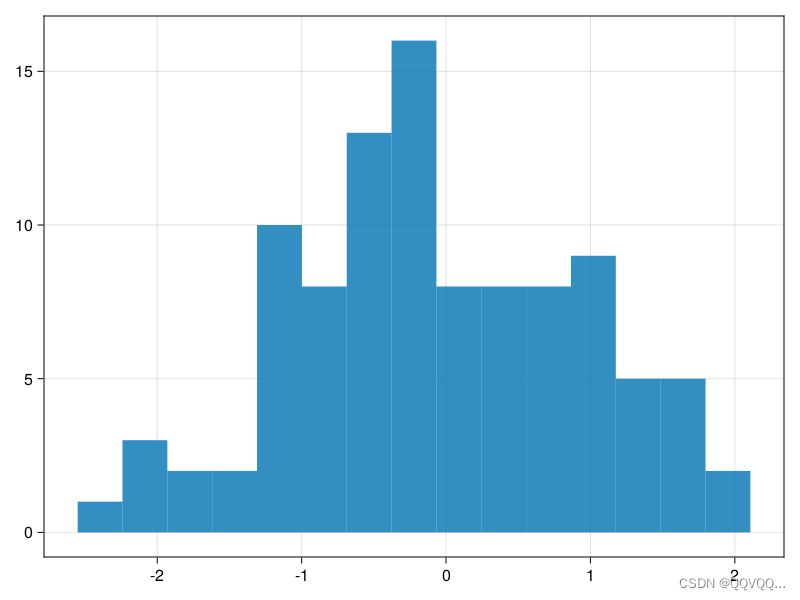
4. 条形图
using CairoMakie

y=[4,9,7,1,2,8]
barplot(y)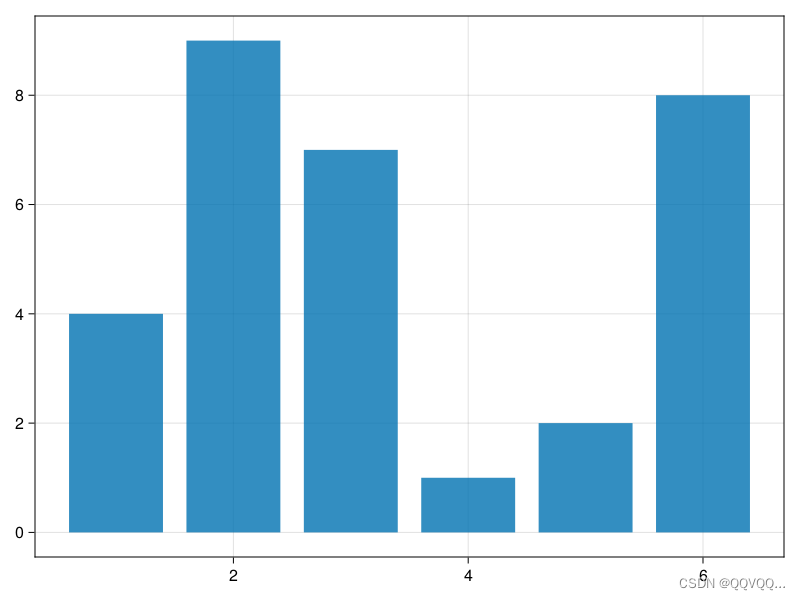
5. 饼状图
using CairoMakie

y=[4,9,7,1]
pie(y,color =[:yellow, :orange, :red, :purple])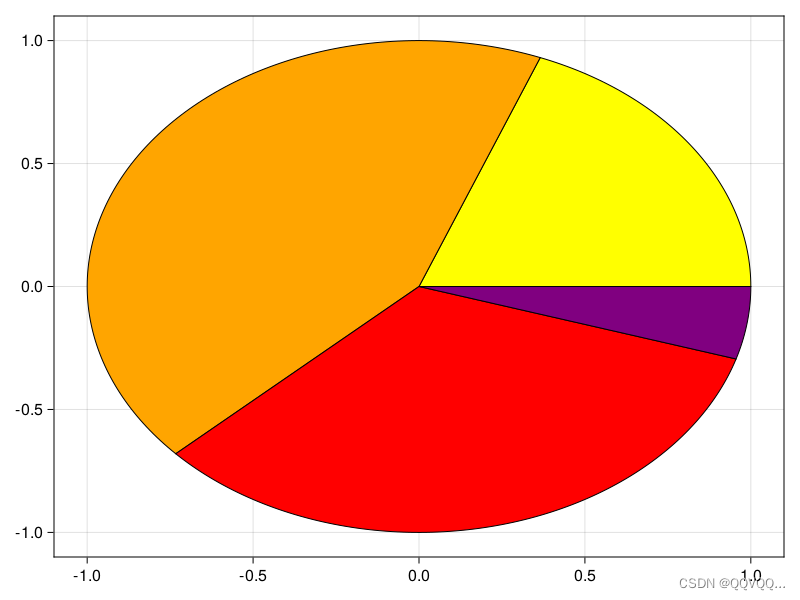
三、绘图进阶
1. 绘图原理
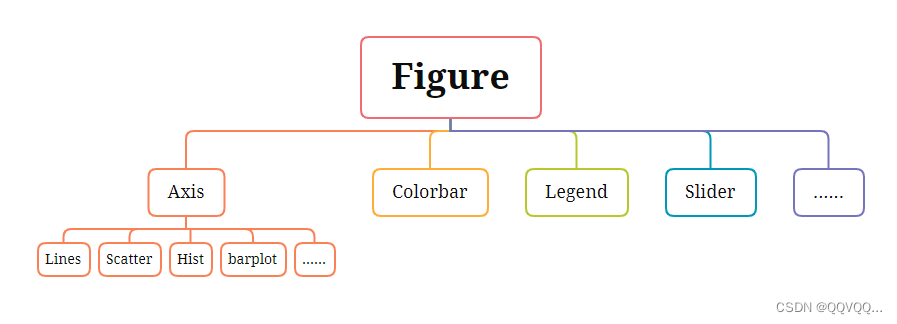
在普通的Makie绘图中,您通常会发现一个包含轴(Axis)的图形(Figure),该轴包含一个或多个绘图对象,如 Lines、Scatter 等。
Makie 中的基本容器对象是 Figure 。它是一个画布,我们可以在上面添加 Axis、Colorbar、Legend 等对象。如下图所示:
基于这种思想,最原始的绘图步骤代码如下:
using CairoMakie

# 创建 Figure 对象
f = Figure()
# 创建 Axis 对象
ax = Axis(f[1, 1])
# 准备绘图数据
x = range(0, 10, length=100)
y = sin.(x)
# 对 Axis 对象添加图形对象
lines!(ax, x, y)最初介绍的折线图、散点图等绘图步骤在调用绘图函数时已经隐式创建了Figure和Axis等对象,因此不在显示声明。下面将介绍各对象具有的属性。
| 名称 | 类型 | 说明 |
|---|---|---|
| resolution | 元组,例如(600,400) | 图片分辨率 |
| figure_padding | Int或者包含四个元素的元组 | 图表空白区域 |
| backgroundcolor | Color | 背景色 |
| font | String | 字体 |
| fontsize | Int64 | 字号 |
| 名称 | 默认值 | 说明 |
|---|---|---|
| aspect | 默认 : | 坐标纵横比例 |
| autolimitaspect | 默认 : | 约束数据纵横比 |
| backgroundcolor | 默认 :white | 轴的背景色 |
| bottomspinecolor | 默认 black | 下侧坐标轴颜色 |
| bottomspinevisible | 默认 true | 下侧坐标轴是否可见 |
| flip_ylabel | 默认 false | 控制y轴标签是否翻转 |
| leftspinecolor | 默认 :black | 左侧坐标轴颜色 |
| leftspinevisible | 默认 true | 左侧坐标轴是否可见 |
| limits | 默认 nothing | 轴的限制,四元组或二元组 |
| panbutton | 默认 Makie.Mouse.right | 用于平移的按钮 |
| rightspinecolor | 默认 :black | 右侧坐标轴颜色 |
| rightspinevisible | 默认 true | 右侧坐标轴是否可见 |
| spinewidth | 默认 1.0 | 坐标轴宽度 |
| subtitle | 默认 :"" | 坐标轴副标题 |
| subtitlecolor | 默认 :black | 坐标轴副标题颜色 |
| subtitlefont | 默认 :regular | 坐标轴副标题字体 |
| subtitlegap | 默认 :0 | 副标题与标题之间的间距 |
| subtitlelineheight | 默认 :1 | 副标题的高度系数 |
| subtitlesize | 默认 :16.0 | 副标题字体大小 |
| subtitlevisible | 默认 true | 副标题是否可见 |
| title | 默认 "" | 标题 |
| titlealign | 默认 :center | 标题对齐方式 |
| titlecolor | 默认 :black | 标题颜色 |
| titlefont | 默认 :bold | 标题字体 |
| titlegap | 默认 4.0 | 轴和标题之间的间距 |
| 名称 | 默认值 | 说明 |
|---|---|---|
| bgcolor | 默认 :white | 图例背景色 |
| colgap | 默认 16 | 图例元素之间的间距 |
| framecolor | 默认 :black | 图例边框颜色 |
2. 绘图方式
方式一
x = range(0, 10, length=100)
y = sin.(x)
lines(x, y)
方式二
f = Figure()
ax = Axis(f[1, 1])
x = range(0, 10, length=100)
y = sin.(x)
lines!(ax, x, y)
f
方式三
x = range(0, 10, length=100)
y = sin.(x)
scatter(x, y;
    figure = (; resolution = (400, 400)),
    axis = (; title = "Scatter plot", xlabel = "x label")
)
3. 数据参数
Makie 支持多种数据参数的输入,示例如下:
lines(0..10, sin)

lines(0:1:10, cos)

lines([Point(0, 0), Point(5, 10), Point(10, 5)])
4. 多图绘制
Makie 在引擎盖下使用了一个强大的布局系统,它允许您创建具有许多子图的非常复杂的图形。我们可以通过将子图在布局网格中的位置作为绘图函数的第一个参数来制作子图。指定图中位置的基本语法是 fig[row, col] ,如下:
using CairoMakie

x = LinRange(0, 10, 100)
y = sin.(x)

fig = Figure()
lines(fig[1, 1], x, y, color = :red)
lines(fig[1, 2], x, y, color = :blue)
lines(fig[2, 1:2], x, y, color = :green)

fig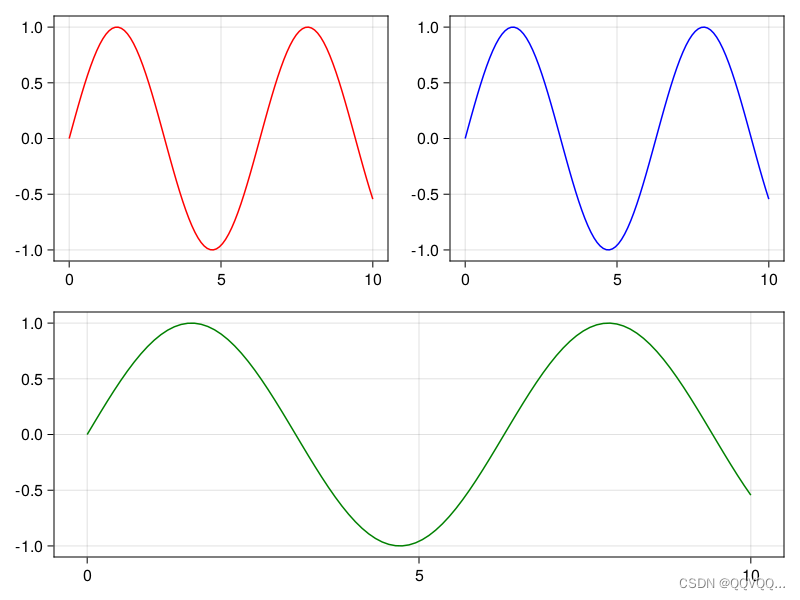
using CairoMakie

fig = Figure()
ax1 = Axis(fig[1, 1])
ax2 = Axis(fig[1, 2])
ax3 = Axis(fig[2, 1:2])

lines!(ax1, 0..10, sin)
lines!(ax2, 0..10, cos)
lines!(ax3, 0..10, sqrt)

fig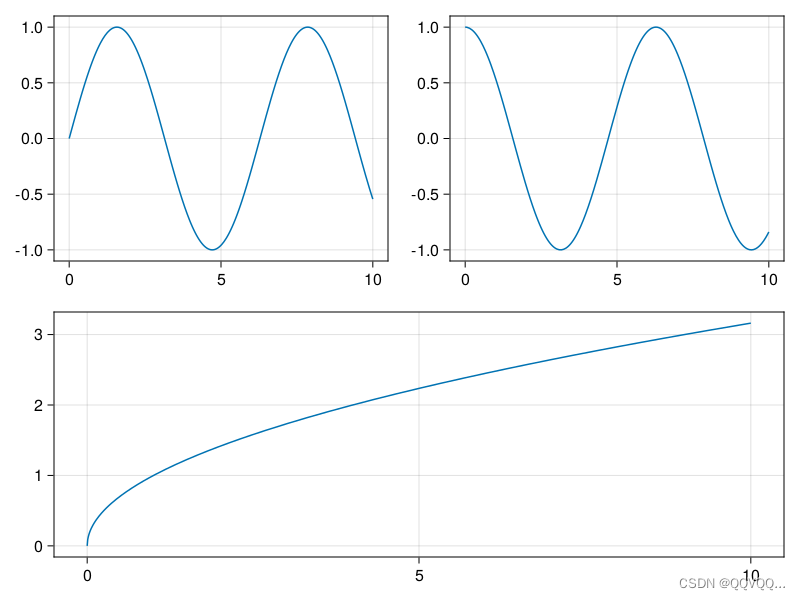
5. 布局设置
colgap!(ax, 10)  # 调整轴的列间距为10
rowgap!(ax, 10)  # 调整轴的行间距为10
6. 保存绘图
save(filename, scene; resolution = size(scene), pt_per_unit = 0.75, px_per_unit = 1.0)不同后端支持的类型如下:
GLMakie:png、jpeg、bmp
CairoMakie:svg、pdf、png、jpeg
WGLMakie:png
using CairoMakie

scene = lines(rand(10))

save("myplot.png",scene)
save("myplot.png",scene; resolution=(700,400))
save("myplot.png",scene; resolution=(700,400), pt_per_unit = 0.75, px_per_unit = 1.0)
四、复杂绘图
1. 折线图
| 参数名 | 取值 | 说明 |
|---|---|---|
| cycle | Vector{Symbol} | 设置创建多个绘图时要循环的颜色列表 |
| color | Colors,默认:black | 线条颜色 |
| linestyle | Nothing, Symbol, Vector,默认:solid | 线条样式 |
| linewidth | Real,默认 1.5 | 线条宽度 |
| visible | Bool,默认 true | 是否渲染绘图 |
| overdraw | Bool,默认 false | 是否覆盖其他绘图 |
| transparency | Bool,默认 false | 是否调整绘图处理透明度方式 |
using CairoMakie

fig = Figure()
ax1 = Axis(fig[1, 1])
ax2 = Axis(fig[1, 2])

xs = 0:0.01:10
ys = 0.5 .* sin.(xs)
lines!(ax1, xs, ys)
lines!(ax1, xs, ys .- 1, linewidth = 5)
lines!(ax1, xs, ys .- 2, linewidth = 5, color = ys)
lines!(ax1, xs, ys .- 3, linestyle = :dash)

xs = 0:0.01:10
ys = 0.5 .* sin.(xs)
for (i, lw) in enumerate([1, 2, 3])
    lines!(ax2, xs, ys .- i/6, linestyle = nothing, linewidth = lw)
    lines!(ax2, xs, ys .- i/6 .- 1, linestyle = :dash, linewidth = lw)
    lines!(ax2, xs, ys .- i/6 .- 2, linestyle = :dot, linewidth = lw)
    lines!(ax2, xs, ys .- i/6 .- 3, linestyle = :dashdot, linewidth = lw)
    lines!(ax2, xs, ys .- i/6 .- 4, linestyle = :dashdotdot, linewidth = lw)
    lines!(ax2, xs, ys .- i/6 .- 5, linestyle = [0.5, 1.0, 1.5, 2.5], linewidth = lw)
end

fig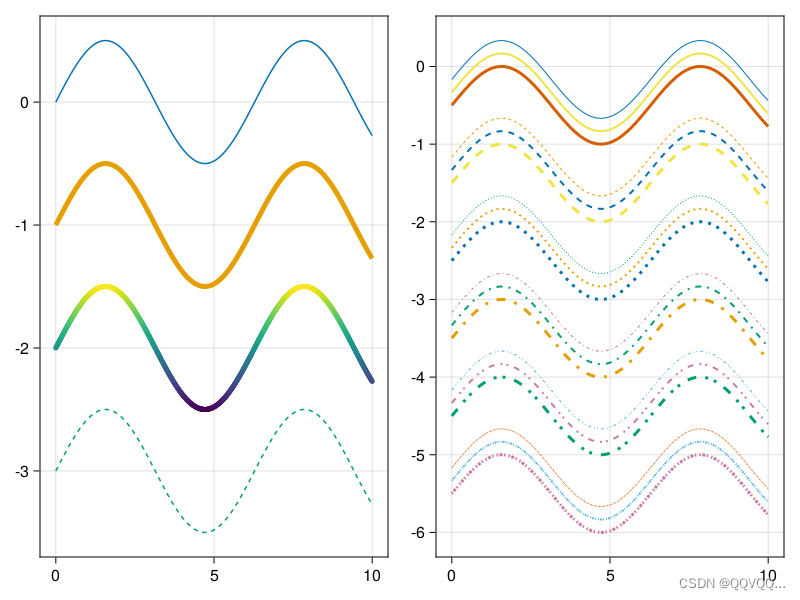
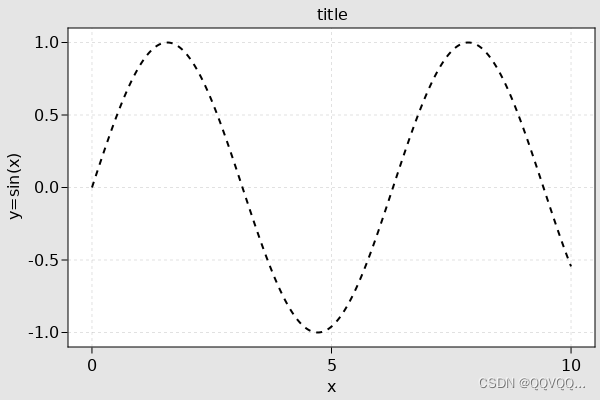
#  figure_padding为图像周围空白区域的大小,它使用一个数字指定所有边的范围,或使用四个数的元组表示上下左右。
#  resolution为分辨率
#  font为字体
lines(0:0.01:10, sin.(0:0.01:10);
  color=:black, linewidth=2, linestyle=:dash,
  figure=(; figure_padding=5, resolution=(600, 400), font="sans", fontsize=16, backgroundcolor=:grey90),
  axis=(; xlabel="x", ylabel="y=sin(x)", title="title", xgridstyle=:dash, ygridstyle=:dash)
)
lines(1:10, (1:10) .^ 2;
  label="x²", linewidth=2, linestyle=nothing,
  figure=(; figure_padding=5, resolution=(600, 400), font="sans", backgroundcolor=:grey90, fontsize=16),
  axis=(; xlabel="x", title="title", xgridstyle=:dash,ygridstyle=:dash)
)
scatterlines!(1:10, (10:-1:1) .^ 2; label="Reverse(x)²") # 在之间的图形上添加绘图
axislegend("legend"; position=:rt)  # 添加图例及图例所在位置
current_figure()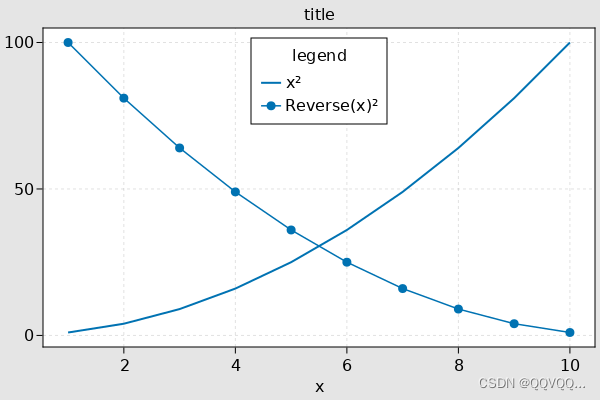
2. 散点图
using CairoMakie

f = Figure()

markers_labels = [
    (:circle, ":circle"),
    (:rect, ":rect"),
    (:diamond, ":diamond"),
    (:hexagon, ":hexagon"),
    (:cross, ":cross"),
    (:xcross, ":xcross"),
    (:utriangle, ":utriangle"),
    (:dtriangle, ":dtriangle"),
    (:ltriangle, ":ltriangle"),
    (:rtriangle, ":rtriangle"),
    (:pentagon, ":pentagon"),
    (:star4, ":star4"),
    (:star5, ":star5"),
    (:star6, ":star6"),
    (:star8, ":star8"),
    (:vline, ":vline"),
    (:hline, ":hline"),
    ('a', "'a'"),
    ('B', "'B'"),
    ('↑', "'\\uparrow'"),
    ('😄', "'\\:smile:'"),
    ('✈', "'\\:airplane:'"),
]
ax = Axis(
    f[1, 1], yreversed=true,
    xautolimitmargin=(0.15, 0.15),
    yautolimitmargin=(0.15, 0.15)
)
hidedecorations!(ax)
for (i, (marker, label)) in enumerate(markers_labels)
    p = Point2f(fldmod1(i, 6)...)
    scatter!(p, marker=marker, markersize=20, color=:black)
    text!(p, text=label, color=:gray70, offset=(0, 20), align=(:center, :bottom))
end

batsymbol_string = "M96.84 141.998c-4.947-23.457-20.359-32.211-25.862-13.887-11.822-22.963-37.961-16.135-22.041 6.289-3.005-1.295-5.872-2.682-8.538-4.191-8.646-5.318-15.259-11.314-19.774-17.586-3.237-5.07-4.994-10.541-4.994-16.229 0-19.774 21.115-36.758 50.861-43.694.446-.078.909-.154 1.372-.231-22.657 30.039 9.386 50.985 15.258 24.645l2.528-24.367 5.086 6.52H103.205l5.07-6.52 2.543 24.367c5.842 26.278 37.746 5.502 15.414-24.429 29.777 6.951 50.891 23.936 50.891 43.709 0 15.136-12.406 28.651-31.609 37.267 14.842-21.822-10.867-28.266-22.549-5.549-5.502-18.325-21.147-9.341-26.125 13.886z"
batsymbol = BezierPath(batsymbol_string, fit=true, flipy=true)
scatter(f[1, 2], 1:10, marker=batsymbol, markersize=50, color=:black)

f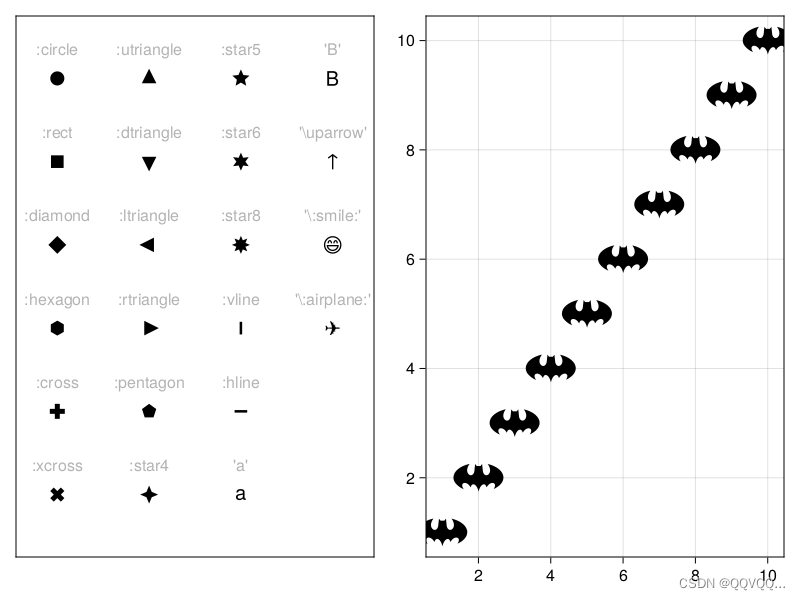
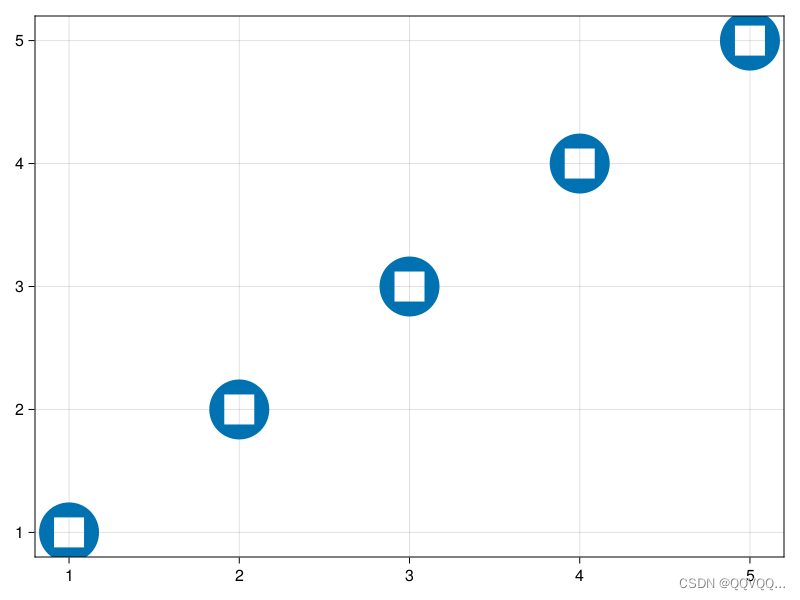
using CairoMakie


circle_with_hole = BezierPath([
    MoveTo(Point(1, 0)),
    EllipticalArc(Point(0, 0), 1, 1, 0, 0, 2pi),
    MoveTo(Point(0.5, 0.5)),
    LineTo(Point(0.5, -0.5)),
    LineTo(Point(-0.5, -0.5)),
    LineTo(Point(-0.5, 0.5)),
    ClosePath(),
])

scatter(1:5,
    marker = circle_with_hole,
    markersize = 30,
) 
3. 直方图
using CairoMakie

f = Figure(reslution=(700,900))

data = randn(1000)
hist(f[1, 1], data, bins = 10)
hist(f[1, 2], data, bins = 20, color = :red, strokewidth = 1, strokecolor = :black)
hist(f[2, 1], data, bins = [-5, -2, -1, 0, 1, 2, 5], color = :gray)
hist(f[2, 2], data, normalization = :pdf)

ax = Axis(f[3,1:2])
for i in 1:5
    hist!(ax, randn(1000), scale_to=-0.6, offset=i, direction=:x)
end

f 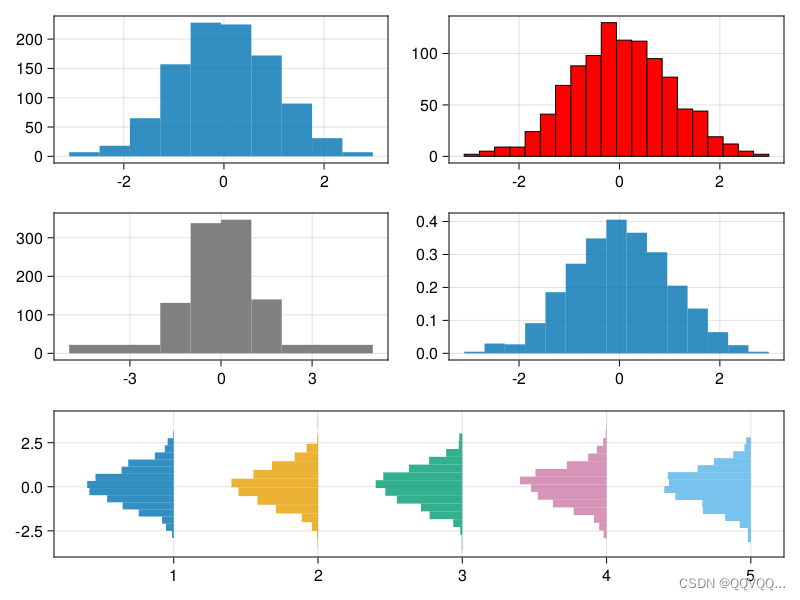
4. 条形图
using CairoMakie

f = Figure()

# 数据
tbl = (
    x=[1, 1, 1, 2, 2, 2, 3, 3, 3],
    height=0.1:0.1:0.9,
    grp=[1, 2, 3, 1, 2, 3, 1, 2, 3],
    grp1=[1, 2, 2, 1, 1, 2, 1, 1, 2],
    grp2=[1, 1, 2, 1, 2, 1, 1, 2, 1]
)

# 图1(直接创建绘图)
barplot(f[1, 1],
    tbl.x, tbl.height,
    stack=tbl.grp,
    color=tbl.grp,
    axis=(xticks=(1:3, ["left", "middle", "right"]), title="图1"),
)

# 图2(先创建轴再添加绘图)
ax = Axis(f[1, 2], xticks=(1:3, ["left", "middle", "right"]), title="图2")
colors = Makie.wong_colors()
barplot!(ax, tbl.x, tbl.height,dodge=tbl.grp, color=colors[tbl.grp])
labels = ["group 1", "group 2", "group 3"]
elements = [PolyElement(polycolor=colors[i]) for i in 1:length(labels)]
title = "图例"
Legend(f[1, 3], elements, labels, title)

f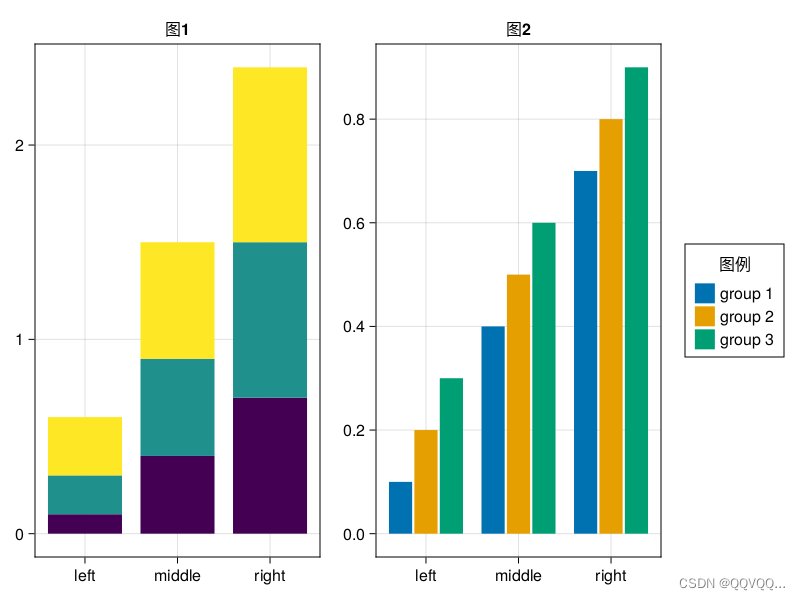
5. 饼状图
using CairoMakie

f = Figure()

# 图1
data = [36, 12, 68, 5, 42, 27]
colors = [:yellow, :orange, :red, :blue, :purple, :green]
pie(
    f[1, 1], data,
    color=colors,
    radius=4,
    inner_radius=2,
    strokecolor=:white,
    strokewidth=5,
    axis=(autolimitaspect=1, title="图1"),
)
# 图2
pie(
    f[1, 2],
    [π / 2, 2π / 3, π / 4],
    normalize=false,
    offset=π / 2,
    color=[:orange, :purple, :green],
    axis=(autolimitaspect=1, title="图2"),
)
# 图3
pie(
    f[2, 1],
    [π / 2, 2π / 3, π / 4],
    normalize=false,
    offset=π / 2,
    color=[:orange, :purple, :green],
    axis=(autolimitaspect=1, title="图3",
        topspinevisible=false,
        bottomspinevisible=false,
        leftspinevisible=false,
        rightspinevisible=false,
        xgridvisible=false,
        ygridvisible=false,
        xticksvisible=false,
        yticksvisible=false,
        xticklabelsvisible=false,
        yticklabelsvisible=false,
    ),
)

# 图4
ax = Axis(f[2, 2], autolimitaspect=1, title="图4")
hidedecorations!(ax)
hidespines!(ax)
pie!(
    ax,
    [π / 2, 2π / 3, π / 4],
    normalize=false,
    offset=π / 2,
    color=[:orange, :purple, :green],
)

f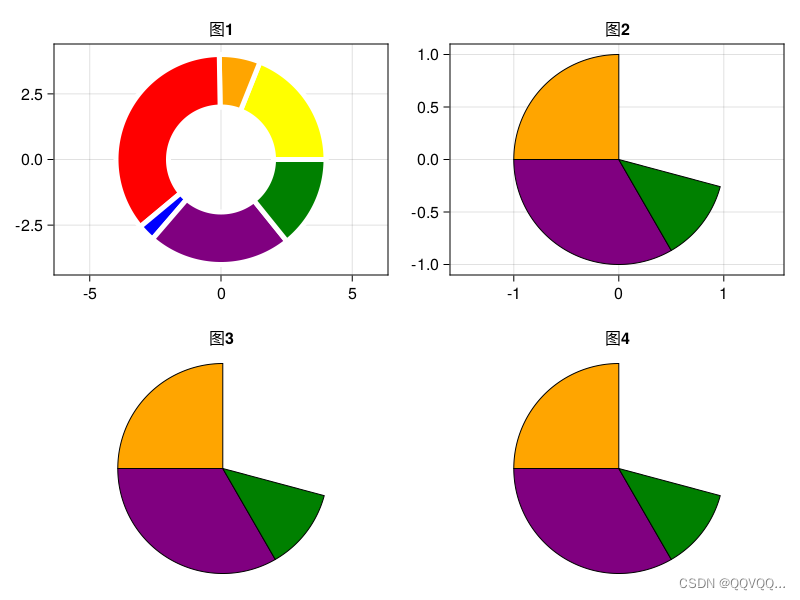
五、属性设置
1. 图形
size_inches = (4, 3)
size_pt = 72 .* size_inches

# 设置图形大小
f = Figure(resolution = size_pt, fontsize = 12)

# 保存图形
save("figure.png", f, pt_per_unit = 1)
2. 标题
# 方式一
ax = Axis(f[1, 1],
    title = "A Makie Axis",
    xlabel = "The x label",
    ylabel = "The y label"
)

# 方式二
scatter(x, y;
    figure = (; resolution = (400, 400)),
    axis = (; title = "Scatter plot", xlabel = "x label")
)
3. 坐标轴
见, 二、绘图进阶——>1绘图原理——>Axis常用属性列表
链接指定轴
# 链接所有给定轴的x轴和y轴,使它们保持同步
linkaxes!(a::Axis, others...)

# 链接所有给定轴的x轴,以使它们保持同步
linkxaxes!(a::Axis, others...)

# 链接所有给定轴的y轴,以使它们保持同步
linkyaxes!(a::Axis, others...)
隐藏轴线
# 隐藏x轴和y轴的装饰:标签,刻度标签,刻度和网格
hidedecorations!(la::Axis)

# 隐藏所有指定的轴线。默认情况下隐藏所有轴线,否则选择符号:l,:r,:b和:t
hidespines!(la::Axis, spines::Symbol... = (:l, :r, :b, :t)...)

# 隐藏x轴的装饰:标签、刻度线、刻度线和网格
hidexdecorations!(la::Axis; label = true, ticklabels = true, ticks = true, grid = true,minorgrid = true, minorticks = true)

# 隐藏y轴的装饰:标签、刻度线、刻度线和网格
hideydecorations!(la::Axis; label = true, ticklabels = true, ticks = true, grid = true,minorgrid = true, minorticks = true)
4. 刻度
xlims!(axes[1], [0, 10]) # as vector
xlims!(axes[2], 10, 0) # separate, reversed
ylims!(axes[3], 0, 10) # separate
ylims!(axes[4], (10, 0)) # as tuple, reversed
limits!(axes[5], 0, 10, 0, 10) # x1, x2, y1, y2
limits!(axes[6], BBox(0, 10, 0, 10)) # as rectangle
xlims!(ax, low = 0) # 设置x轴最小值
ylims!(ax, low = 0) # 设置y轴最小值
ax.xticks = 0:3:9 # 设置x轴刻度取值using CairoMakie
f = Figure()
Axis(f[1, 1],
xticks = 0:10,
yticks = 0:10,
xticksmirrored = true,
yticksmirrored = true,
xminorticksvisible = true,
yminorticksvisible = true,
xminortickalign = 1,
yminortickalign = 1,
xtickalign = 1,
ytickalign = 1,
)
f
5. 图例
方式一
简单图例
using CairoMakie

f = Figure()
lines(f[1,1],rand(50),label="图例")
axislegend()

f
方式二
单独绘图以显示图例
using CairoMakie

f = Figure()

ax = f[1, 1] = Axis(f)

lines!(0..15, sin, label = "sin", color = :blue)
lines!(0..15, cos, label = "cos", color = :red)
lines!(0..15, x -> -cos(x), label = "-cos", color = :green)

f[1, 2] = Legend(f, ax, "Trig Functions", framevisible = false)

f
方式三
单独绘图以显示图例并定义图例元素及名称。
using CairoMakie

f = Figure()

Axis(f[1, 1])

xs = 0:0.5:10
ys = sin.(xs)
lin = lines!(xs, ys, color = :blue)
sca = scatter!(xs, ys, color = :red)
sca2 = scatter!(xs, ys .+ 0.5, color = 1:length(xs), marker = :rect)

Legend(f[1, 2],
    [lin, sca, [lin, sca], sca2],
    ["a line", "some dots", "both together", "rect markers"])

f
其他设置
leg.tellheight = true  # 设置图例高度缩放
leg.tellwidth = true   # 设置图例宽度缩放
6. 颜色
可设置的颜色类型如下:
- 命名颜色,如—— :red,:white 等
- 颜色字符串,如—— "red", "white" 等
- 包含透明度的元组,如——(:red,0.5) 等
- 十六进制颜色,如——"#4472c4" 等
- RGB颜色,如—— "rgb(25,202,173)" 等
- RGB颜色,如—— RGBf(0.5,0.6,0.7)、RGBf(0.4,0.6,0.1) 等
- RGBA颜色,如——RGBAf(0.5,0.6,0.7,0.1)、RGBAf(0.2,0.6,0.4,0.1) 等
7. 字体
Makie 使用这个FreeType.jl包来支持字体,因此,这个包可以加载的大多数字体也应该被 Makie 支持。
8. 标记
在散点图中可用的标记包括以下几种类型:
- Symbol,例如::circle、:rect、:utriangle 等
- Char,例如:'a'、'b'、'c' 等
- BezierPath,例如:
- Polygon,例如:decompose(Point2f, Circle(Point2f(0), 1)) 等
- Matrix{<:Colorant}
具体可参考参考:scatter
9. 线型
| 线型名称 | 说明 |
|---|---|
| nothing | 实线 |
| :solid | 实线 |
| :dash | 虚线 |
| :dot | 虚线 |
| :dashdot | 虚线 |
| :dashdotdot | 虚线 |
| [0.5, 1.0, 1.5, 2.5] | 虚线 |


 1236
1236


 被折叠的 条评论
为什么被折叠?
被折叠的 条评论
为什么被折叠?
 到【灌水乐园】发言


