


1、简介
官网地址:
https://echarts.apache.org/zh/index.html
Apache ECharts,一款基于JavaScript的数据可视化图表库,提供直观,生动,可交互,可个性化定制的数据可视化图表。
ECharts 是一个使用 JavaScript 实现的开源可视化库,涵盖各行业图表,满足各种需求。
ECharts 遵循 Apache-2.0 开源协议,免费商用。
ECharts 兼容当前绝大部分浏览器(IE8/9/10/11,Chrome,Firefox,Safari等)及兼容多种设备,可随时随地任性展示。

2、安装
2.1 安装node
2.2 安装echarts
https://echarts.apache.org/zh/download.html
从哪里获取 ECharts ?
获取 ECharts 的路径有以下几种,请根据您的情况进行选择:
- 最直接的方法是在 ECharts 的官方网站中挑选适合您的版本进行下载,不同的打包下载应用于不同的开发者功能与体积的需求,或者您也可以直接下载完整版本;开发环境建议下载源代码版本,包含了常见的错误提示和警告。
- 也可以在 ECharts 的 GitHub 上下载最新的 release 版本,解压出来的文件夹里的 dist 目录里可以找到最新版本的 echarts 库。
- 或者通过 npm 获取 echarts,npm install echarts --save,详见“在 webpack 中使用 echarts”
- 由 cdn 引入,你可以在 cdnjs,npmcdn 或者国内的 bootcdn 上找到 ECharts 的最新版本。


npm install echarts
# or
npm install echarts --save
# or
npm install -g cnpm --registry=https://registry.npm.taobao.org
cnpm install echarts --save
2.3 安装vue

Vue (发音为 /vjuː/,类似 view) 是一款用于构建用户界面的 JavaScript 框架。它基于标准 HTML、CSS 和 JavaScript 构建,并提供了一套声明式的、组件化的编程模型,帮助你高效地开发用户界面。无论是简单还是复杂的界面,Vue 都可以胜任。
2.3.1 npm方式(Vite)
开发的前提条件:
- 熟悉命令行
- 已安装 16.0 或更高版本的 Node.js
新建vue工程,命令如下:
mkdir test_vue
cd test_vue

# 要使用 Vite 来创建一个 Vue 项目,非常简单:
# 这个命令会安装和执行 create-vue,它是 Vue 提供的官方脚手架工具。
npm init vue@latest

在项目被创建后,通过以下步骤安装依赖并启动开发服务器:
# cd <your-project-name>
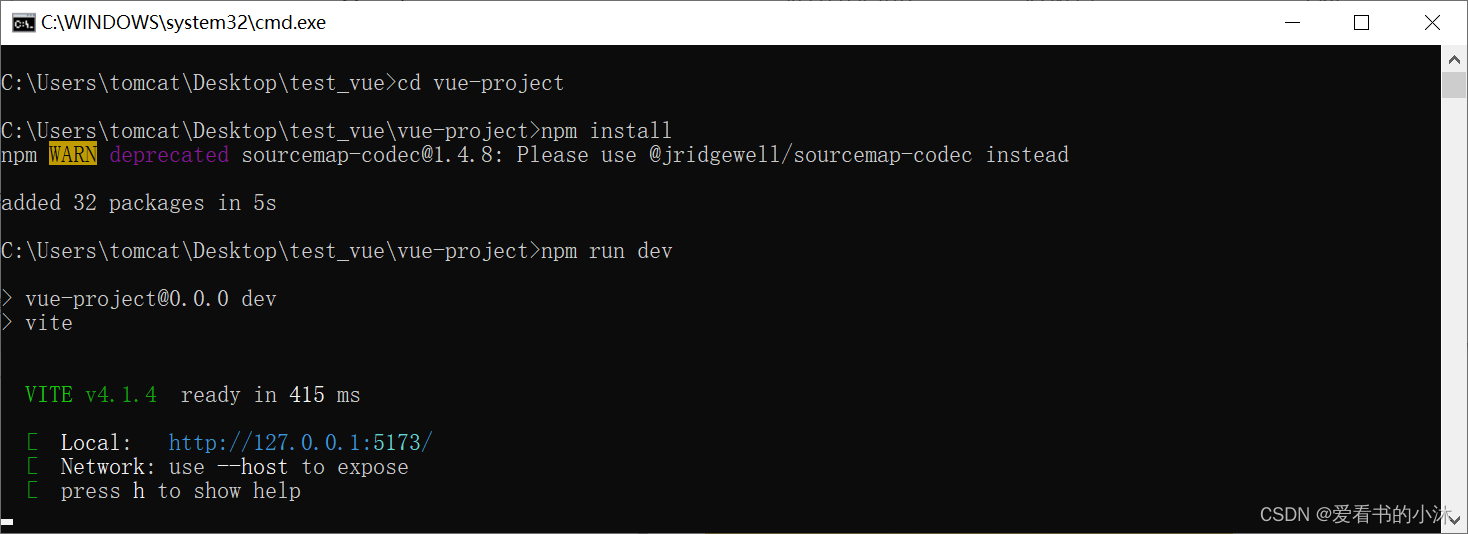
cd vue-project
npm install
npm run dev
命令行执行情况如下:
vue工程的文件夹情况如下:

浏览器访问上面命令行中的测试网址:
http://127.0.0.1:5173/

你现在应该已经运行起来了你的第一个 Vue 项目!请注意,生成的项目中的示例组件使用的是组合式 API 和
Vite(法语单词,“快” 的意思)是一种新型的前端构建工具
最初是配合 Vue3.0 一起使用的,后来适配了各种前端项目,目前提供了 Vue、React、Preact 框架模板。

目前来说,Vue 使用的是 vue-cli 脚手架,React 一般使用 create-react-app 脚手架。
虽然脚手架工具不一样,但是内部的打包工具都是 Webpack。

为什么要开发一个全新的构建工具,是 Webpack 不香了吗?
当你准备将应用发布到生产环境时,请运行:
npm run build
此命令会在 ./dist 文件夹中为你的应用创建一个生产环境的构建版本。
2.3.2 npm方式(Vue CLI)
https://cli.vuejs.org/zh/
Vue CLI 是官方提供的基于 Webpack 的 Vue 工具链,它现在处于维护模式。我们建议使用 Vite 开始新的项目,除非你依赖特定的 Webpack 的特性。在大多数情况下,Vite 将提供更优秀的开发体验。
- 安装vue:
npm install -g @vue/cli
# OR
yarn global add @vue/cli
- 创建一个项目:
vue create my-project
# OR
vue ui
CLI (@vue/cli) 是一个全局安装的 npm 包,提供了终端里的 vue 命令。它可以通过 vue create 快速搭建一个新项目,或者直接通过 vue serve 构建新想法的原型。你也可以通过 vue ui 通过一套图形化界面管理你的所有项目。
2.3.3 CDN方式
你可以借助 script 标签直接通过 CDN 来使用 Vue:
<script src="https://unpkg.com/vue@3/dist/vue.global.js"></script>
这里我们使用了 unpkg,但你也可以使用任何提供 npm 包服务的 CDN,例如 jsdelivr 或 cdnjs。当然,你也可以下载此文件并自行提供服务。
通过 CDN 使用 Vue 时,不涉及“构建步骤”。这使得设置更加简单,并且可以用于增强静态的 HTML 或与后端框架集成。但是,你将无法使用单文件组件 (SFC) 语法。
- 使用全局构建版本
该版本的所有顶层 API 都以属性的形式暴露在了全局的 Vue 对象上。这里有一个使用全局构建版本的例子:
<!DOCTYPE html>
<html lang="en">
  <head>
    <meta charset="UTF-8">
    <link rel="icon" href="/favicon.ico">
    <meta name="viewport" content="width=device-width, initial-scale=1.0">
    <title>Vue App</title>
  </head>
  <body>
<script src="https://unpkg.com/vue@3/dist/vue.global.js"></script>

<div id="app">{{ message }}</div>

<script>
  const { createApp } = Vue

  createApp({
    data() {
      return {
        message: 'Hello Vue! Test by 爱看书的小沐!'
      }
    }
  }).mount('#app')
</script>

  </body>
</html>

- 使用 ES 模块构建版本
在本文档的其余部分我们使用的主要是 ES 模块语法。现代浏览器大多都已原生支持 ES 模块。因此我们可以像这样通过 CDN 以及原生 ES 模块使用 Vue:
<!DOCTYPE html>
<html lang="en">
  <head>
    <meta charset="UTF-8">
    <link rel="icon" href="/favicon.ico">
    <meta name="viewport" content="width=device-width, initial-scale=1.0">
    <title>Vue App</title>
  </head>
  <body>
	<div id="app">{{ message }}</div>

	<script type="module">
	  import { createApp } from 'https://unpkg.com/vue@3/dist/vue.esm-browser.js'

	  createApp({
		data() {
		  return {
			message: 'Hello Vue! 爱看书的小沐!'
		  }
		}
	  }).mount('#app')
	</script>

  </body>
</html>
- 启用 Import maps
我们可以使用导入映射表 (Import Maps) 来告诉浏览器如何定位到导入的 vue:
<!DOCTYPE html>
<html lang="en">
  <head>
    <meta charset="UTF-8">
    <link rel="icon" href="/favicon.ico">
    <meta name="viewport" content="width=device-width, initial-scale=1.0">
    <title>Vue App</title>
  </head>
  <body>
	<script type="importmap">
	  {
		"imports": {
		  "vue": "https://unpkg.com/vue@3/dist/vue.esm-browser.js"
		}
	  }
	</script>

	<div id="app">{{ message }}</div>

	<script type="module">
	  import { createApp } from 'vue'

	  createApp({
		data() {
		  return {
			message: 'Hello Vue! 爱看书的小沐!'
		  }
		}
	  }).mount('#app')
	</script>


  </body>
</html>

- 拆分模块
随着对这份指南的逐步深入,我们可能需要将代码分割成单独的 JavaScript 文件,以便更容易管理。例如:
<!-- index.html -->
<script type="module">
  import { createApp } from 'vue'
  import MyComponent from './my-component.js'

  createApp(MyComponent).mount('#app')
</script>
// my-component.js
export default {
data() {
return { count: 0 }
},
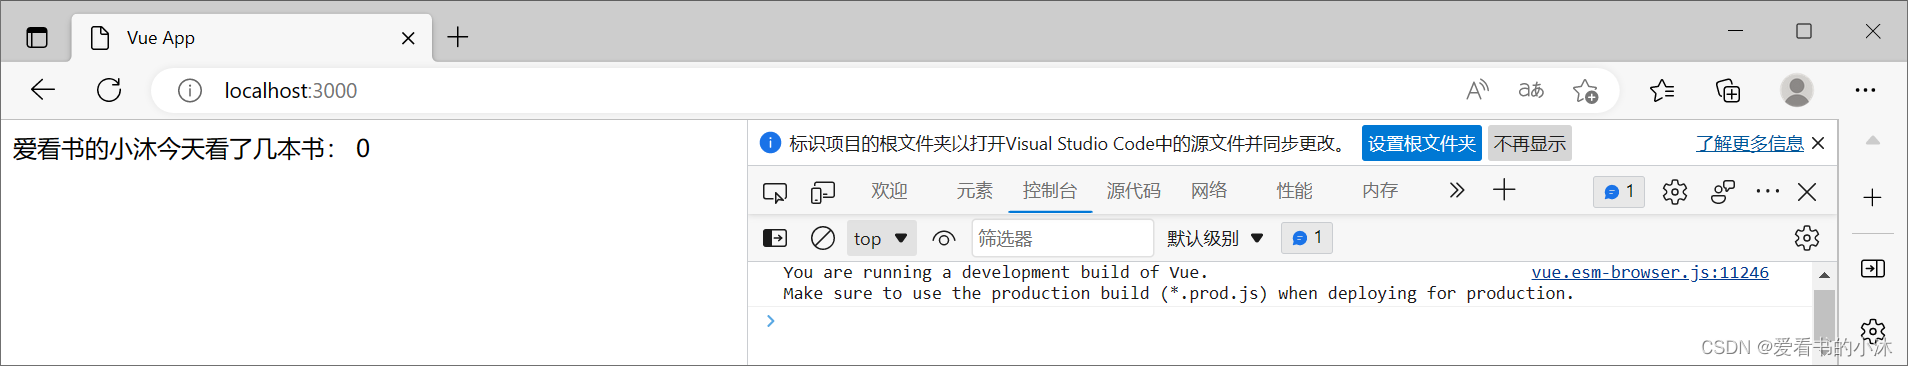
template: `<div>爱看书的小沐今天看了几本书: {{ count }}</div>`
}
如果直接在浏览器中打开了上面的 index.html,你会发现它抛出了一个错误,因为 ES 模块不能通过 file:// 协议工作。为了使其工作,你需要使用本地 HTTP 服务器通过 http:// 协议提供 index.html。
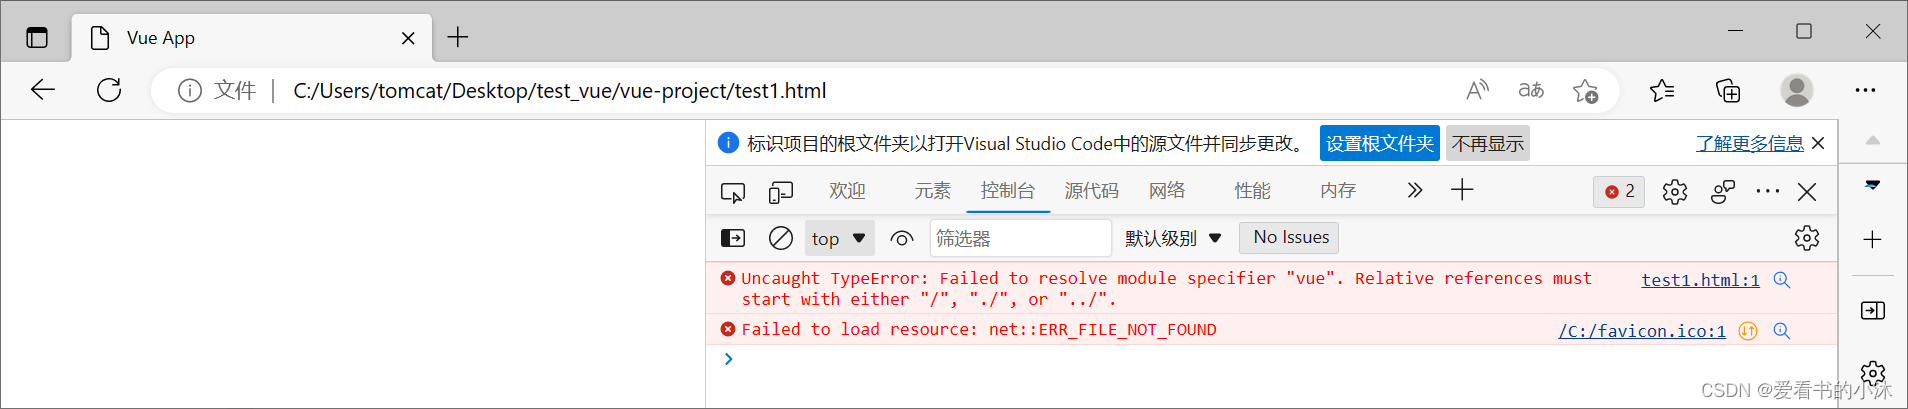

要启动一个本地的 HTTP 服务器,请先安装 Node.js,然后通过命令行在 HTML 文件所在文件夹下运行 npx serve。你也可以使用其他任何可以基于正确的 MIME 类型服务静态文件的 HTTP 服务器。
简单来说,npm 是一个 node 包管理器,npx 是一个 Node 包执行器。

NPM 是 Node 包管理器。NPM 内置在 Node.js 中,通过命令行工具 CLI 来和线上 NPM 数据库进行交互,这个数据库被称为 NPM Register,
NPX 是一个 Node 包执行器,该 Node 包可以是本地也可以是远程的。允许开发者在无需安装的情况下执行任意 Node 包。

执行本地 Node 包时,NPX 会到node_modules/.bin路径和环境变量 $PATH 里面,检查命令是否存在。
执行远程 Node 包时,NPX 会将 Node 包下载到一个临时目录中,使用以后再删除。
修改上面的index.html如下:
<!DOCTYPE html>
<html lang="en">
  <head>
    <meta charset="UTF-8">
    <link rel="icon" href="/favicon.ico">
    <meta name="viewport" content="width=device-width, initial-scale=1.0">
    <title>Vue App</title>
	<script type="importmap">
	  {
		"imports": {
		  "vue": "https://unpkg.com/vue@3/dist/vue.esm-browser.js"
		}
	  }
	</script>
  </head>

	<body id="app">
	</body>

	<!-- index.html -->
	<script type="module">
	  import { createApp } from 'vue'
	  import MyComponent from './my-component.js'

	  createApp(MyComponent).mount('#app')
	</script>

</html>
命令行执行如下:

浏览器访问如下:
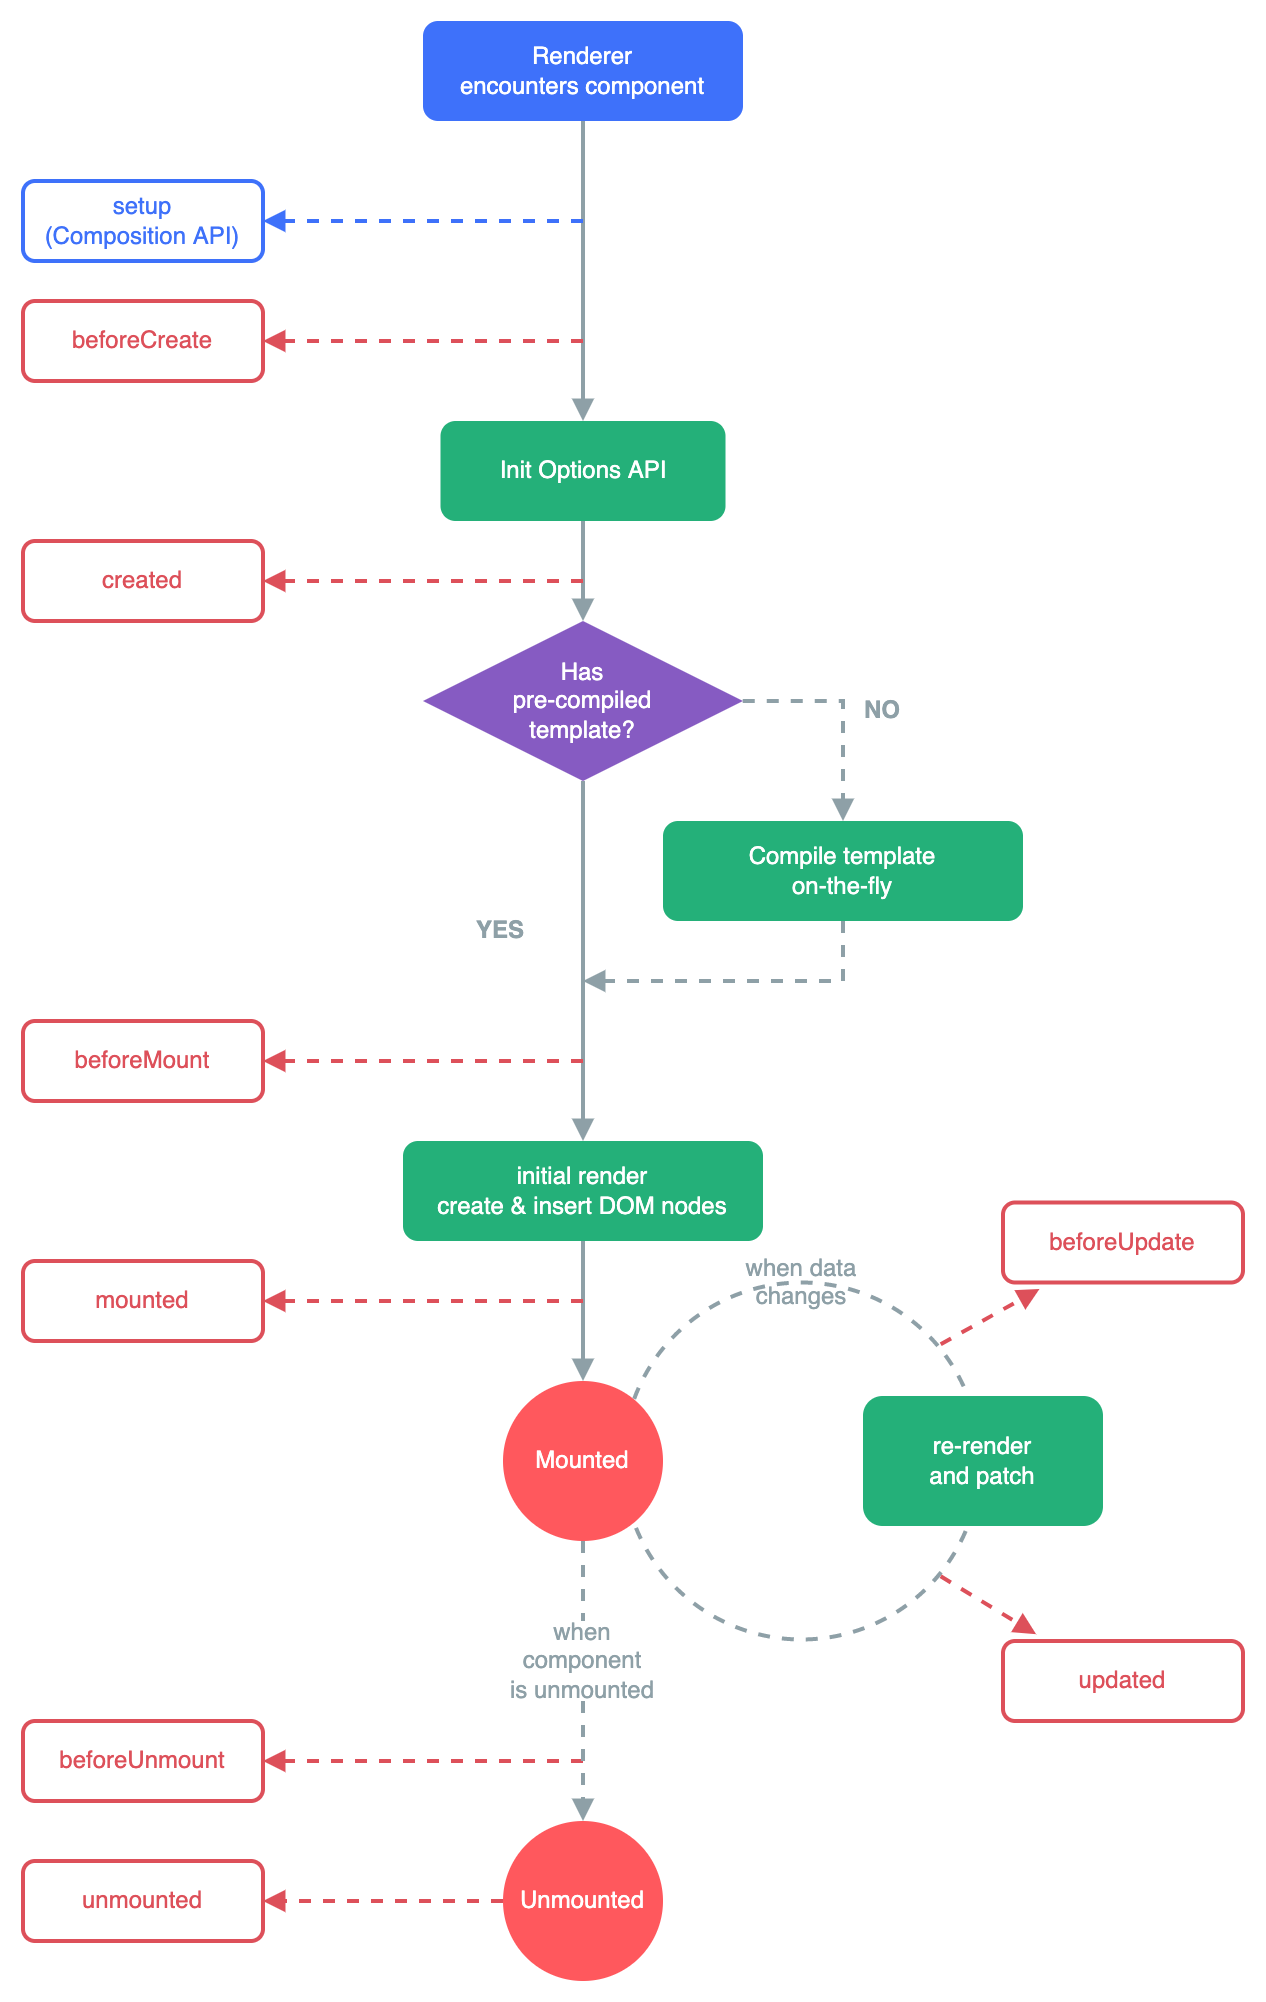
2.3.3 生命周期
3、测试(vue)
3.1 修改App.vue(hello world)
App.vue:
<script>
export default {
  data() {
    return {
      msg: 'Hello World!'
    }
  }
}
</script>

<template>
  <h1>{{ msg }}</h1>
  <input v-model="msg">
</template>
执行命令如下:
npm run dev

浏览器访问如下:

另一个例子:
<script>
export default {
  data() {
    return {
      greeting: 'Hello World! 爱看书的小沐!'
    }
  }
}
</script>

<template>
  <p class="greeting">{{ greeting }}</p>
</template>

<style>
.greeting {
  color: blue;
  font-weight: bold;
}
</style>

3.2 修改App.vue(计数器)
App.vue:
<script>
export default {
data() {
return {
count: 1
}
},
// `mounted` is a lifecycle hook which we will explain later
mounted() {
// `this` refers to the component instance.
console.log(this.count) // => 1
// data can be mutated as well
this.count = 2
}
}
</script>
<template>
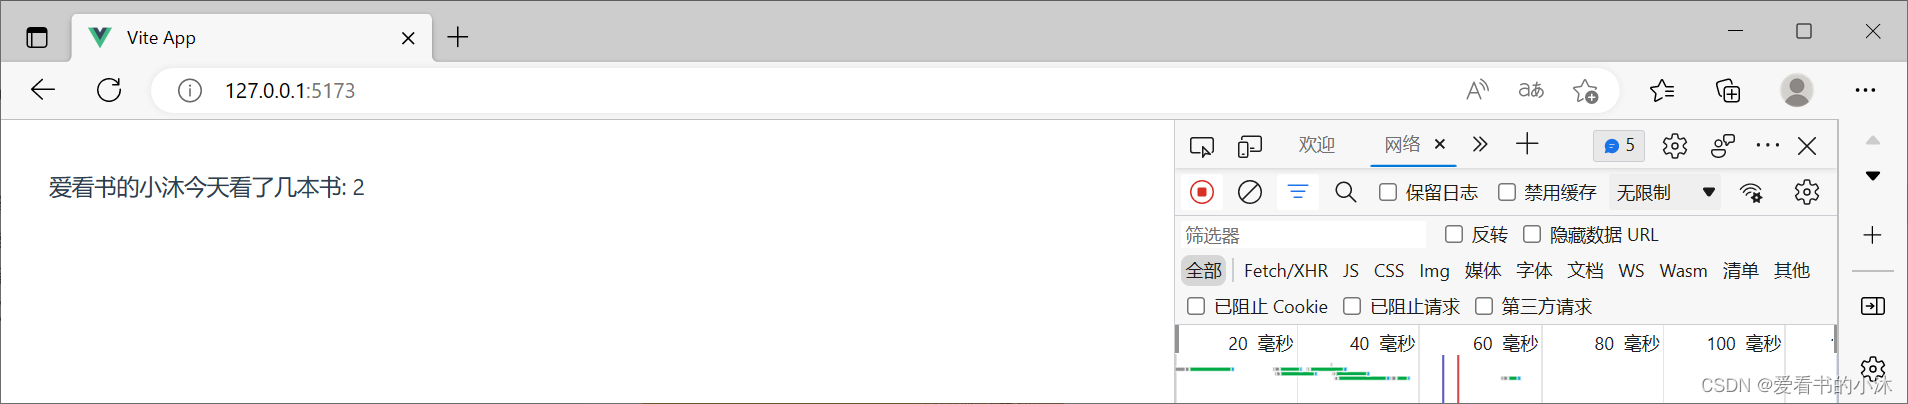
爱看书的小沐今天看了几本书: {{ count }}
</template>
浏览器访问如下:
3.3 修改App.vue(按钮button)
App.vue:
<script>
export default {
  data() {
    return {
      count: 0
    }
  },
  methods: {
    increment() {
      this.count++
    }
  },
  mounted() {
    this.increment()
  }
}
</script>

<template>
  <button @click="increment">爱看书的小沐今天看了几本书: {{ count }}</button>
  <br>
  <button @click="increment">爱看书的小沐今天看了几本书: {{ count }}</button>
  <br>
  <button @click="increment">爱看书的小沐今天看了几本书: {{ count }}</button>
  <br>
</template>
浏览器访问如下:

3.4 修改App.vue(列表li)
App.vue:
<script>
export default {
  data() {
    return {
      author: {
        name: 'John Doe',
        books: [
          'Vue 2 - Advanced Guide',
          'Vue 3 - Basic Guide',
          'Vue 4 - The Mystery'
        ]
      },
	  items: [{ message: 'Foo' }, { message: 'Bar' }]
    }
  },
  computed: {
    // 一个计算属性的 getter
    publishedBooksMessage() {
      // `this` 指向当前组件实例
      return this.author.books.length > 0 ? 'Yes' : 'No'
    }
  }
}
</script>

<template>
  <p>爱看书的小沐的书架:</p>
  <span>{{ publishedBooksMessage }}</span>

  <li v-for="book in author.books">
  {{ book }}
  </li>
  <br>
  <li v-for="(item, index) in items">
  {{ author.name }} - {{ index }} - {{ item.message }}
  </li>
</template>
浏览器访问如下:

3.5 修改App.vue(事件@click)
App.vue:
<script>
export default {
data() {
return {
name: 'Vue.js'
}
},
methods: {
greet(event) {
// `this` inside methods points to the current active instance
alert(`Hello ${this.name}!`)
// `event` is the native DOM event
if (event) {
alert(event.target.tagName)
}
},
say(message) {
alert(message)
}
}
}
</script>
<template>
<button @click="greet">Greet</button>
<button @click="say('hi')">Say hi</button>
<button @click="say('what')">Say what</button>
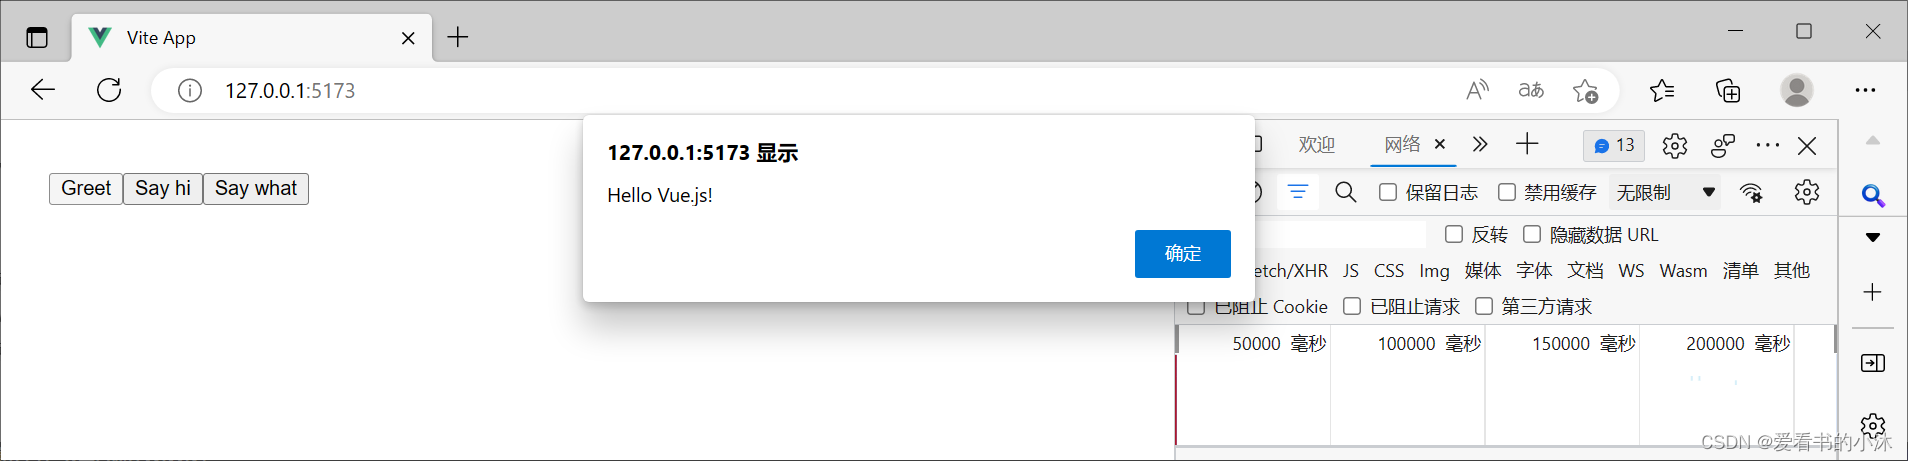
</template>
浏览器访问如下:
3.6 修改App.vue(侦听器watch)
App.vue:
<script>
export default {
  data() {
    return {
      question: '',
      answer: 'Questions usually contain a question mark. ;-)'
    }
  },
  watch: {
    // whenever question changes, this function will run
    question(newQuestion, oldQuestion) {
      if (newQuestion.indexOf('?') > -1) {
        this.getAnswer()
      }
    }
  },
  methods: {
    async getAnswer() {
      this.answer = 'Thinking...'
      try {
        const res = await fetch('https://api.apiopen.top/api/sentences')
        this.answer = (await res.json()).result
      } catch (error) {
        this.answer = 'Error! Could not reach the API. ' + error
      }
    }
  }
}
</script>

<template>
  <p>
    爱看书的小沐随机背一首古诗:
    <input v-model="question" />
  </p>
  <p>作者:{{ answer.from }}</p>
  <p>诗句:{{ answer.name }}</p>
</template>
浏览器访问如下:


3.7 修改App.vue(路由route,多组件)
App.vue:
<script>
import Home from './Home.vue'
import About from './About.vue'
import NotFound from './NotFound.vue'

const routes = {
  '/': Home,
  '/about': About
}

export default {
  data() {
    return {
      currentPath: window.location.hash
    }
  },
  computed: {
    currentView() {
      return routes[this.currentPath.slice(1) || '/'] || NotFound
    }
  },
  mounted() {
    window.addEventListener('hashchange', () => {
		  this.currentPath = window.location.hash
		})
  }
}
</script>

<template>
  <a href="#/">Home</a> |
  <a href="#/about">About</a> |
  <a href="#/non-existent-path">Broken Link</a>
  <component :is="currentView" />
</template>
Home.vue:
<template>
  <h1>Home</h1>
</template>
About.vue:
<template>
  <h1>About</h1>
</template>
NotFound.vue:
<template>
  <h1>404</h1>
</template>
浏览器访问如下:
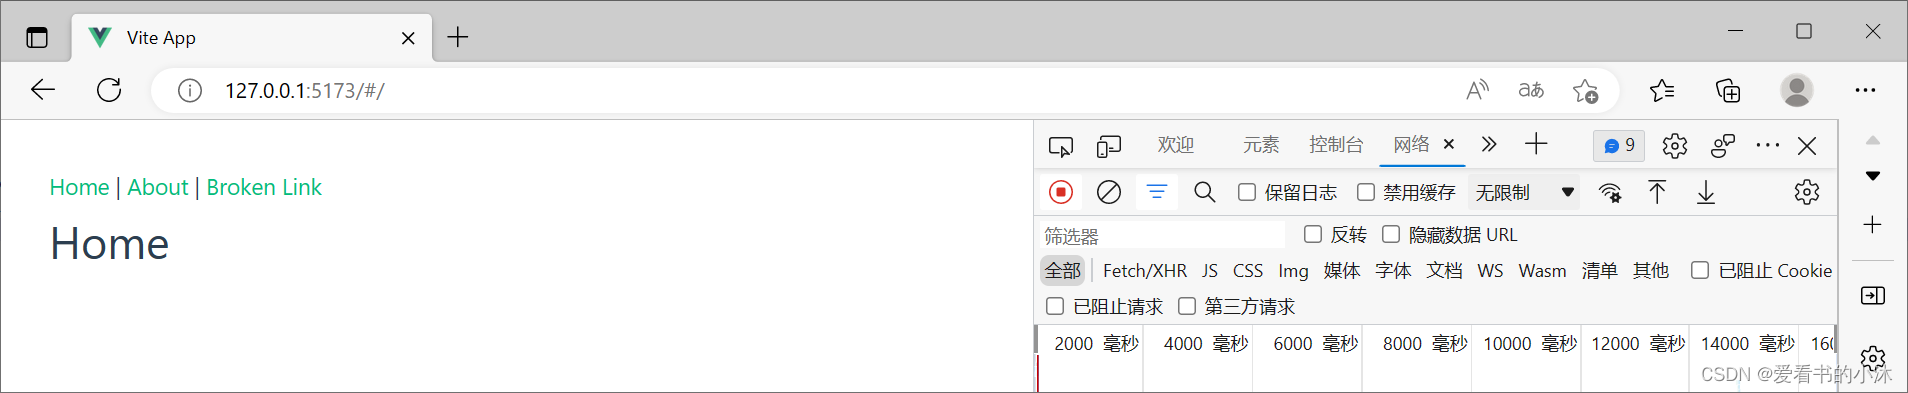
工程文件组织如下:
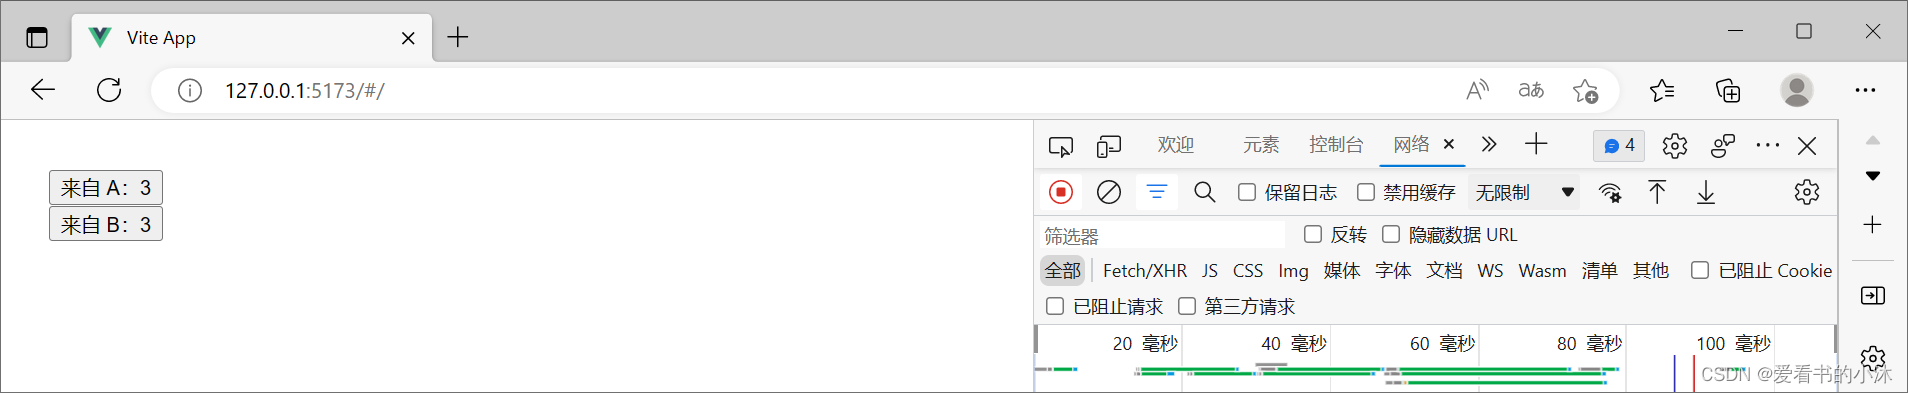
3.8 修改App.vue(状态管理,多组件)
理论上来说,每一个 Vue 组件实例都已经在“管理”它自己的响应式状态了。
它是一个独立的单元,由以下几个部分组成:
- 状态:驱动整个应用的数据源;
- 视图:对状态的一种声明式映射;
- 交互:状态根据用户在视图中的输入而作出相应变更的可能方式。

然而,当我们有多个组件共享一个共同的状态时,就没有这么简单了:
多个视图可能都依赖于同一份状态。
来自不同视图的交互也可能需要更改同一份状态。
App.vue:
<script>
import ComponentA from './ComponentA.vue'
import ComponentB from './ComponentB.vue'

export default {
  components: {
    ComponentA,
    ComponentB
  }
}
</script>

<template>
  <ComponentA />
  <ComponentB />
</template>
ComponentA.vue:
<script>
import { store } from './store.js'

export default {
  data() {
    return {
      store
    }
  }
}
</script>

<template>
  <div>
    <button @click="store.increment()">
      来自 A:{{ store.count }}
    </button>
  </div>
</template>
ComponentB.vue:
<script>
import { store } from './store.js'

export default {
  data() {
    return {
      store
    }
  }
}
</script>

<template>
  <div>
    <button @click="store.increment()">
      来自 B:{{ store.count }}
    </button>
  </div>
</template>
store.js:
import { reactive } from 'vue'

export const store = reactive({
  count: 0,
  increment() {
    this.count++
  }
})

4、测试(vue+echarts)
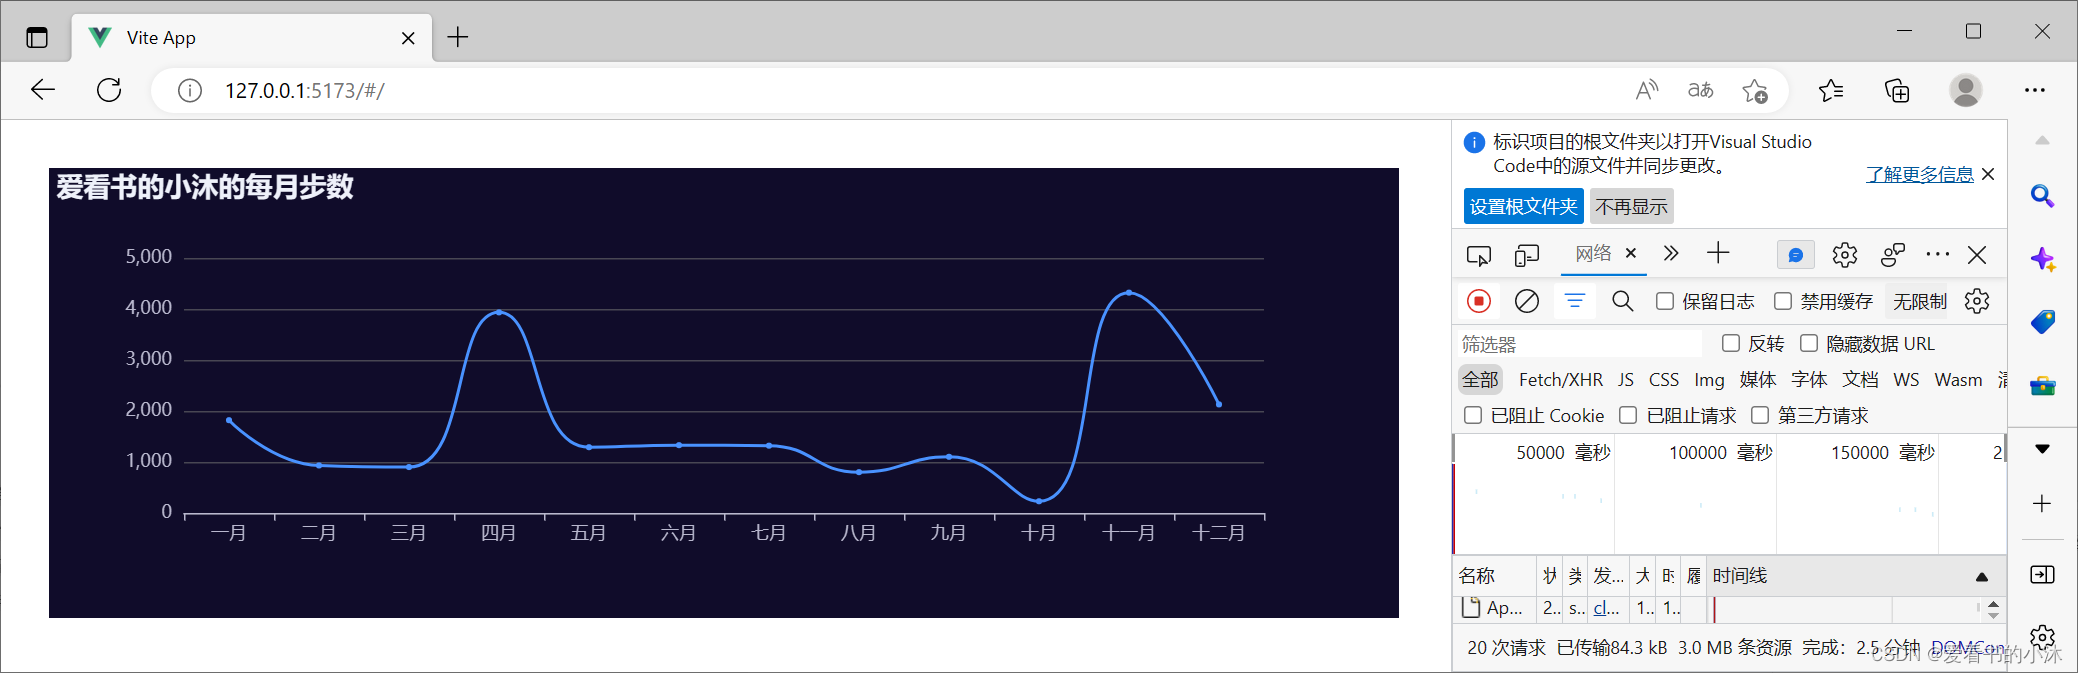
4.1 修改App.vue(折线图)
安装echarts库:
npm install echarts --save

不通过main.js,直接在App.vue中使用echarts的页面直接引入。
App.vue修改如下:
<script>
import * as echarts from "echarts";
import { ref, onMounted,onUnmounted } from 'vue'

export default {
  name: "echartsBox",
  setup() {
    let echart = echarts;

    onMounted(() => {
      initChart();
    });

    onUnmounted(() => {
      echart.dispose;
    });

    function initChart() {
      let chart = echart.init(document.getElementById("myEcharts"), "dark");
      chart.setOption({
		  title : {
			show:true,
			text: '爱看书的小沐的每月步数',
		  },
        xAxis: {
          type: "category",
          data: [
            "一月",
            "二月",
            "三月",
            "四月",
            "五月",
            "六月",
            "七月",
            "八月",
            "九月",
            "十月",
            "十一月",
            "十二月"
          ]
        },
        tooltip: {
          trigger: "axis"
        },
        yAxis: {
          type: "value"
        },
        series: [
          {
			name: '工作量',
            data: [
              1820,
              932,
              901,
              3934,
              1290,
              1330,
              1320,
              801,
              1102,
              230,
              4321,
              2129
            ],
            type: "line",
            smooth: true
          }
        ]
      });
      window.onresize = function() {
        chart.resize();
      };
    }

    return { initChart };
  }
};
</script>

<template>
  <div class="echarts-box">
    <div id="myEcharts" :style="{ width: '900px', height: '300px' }"></div>
  </div>
</template>
浏览器访问如下:
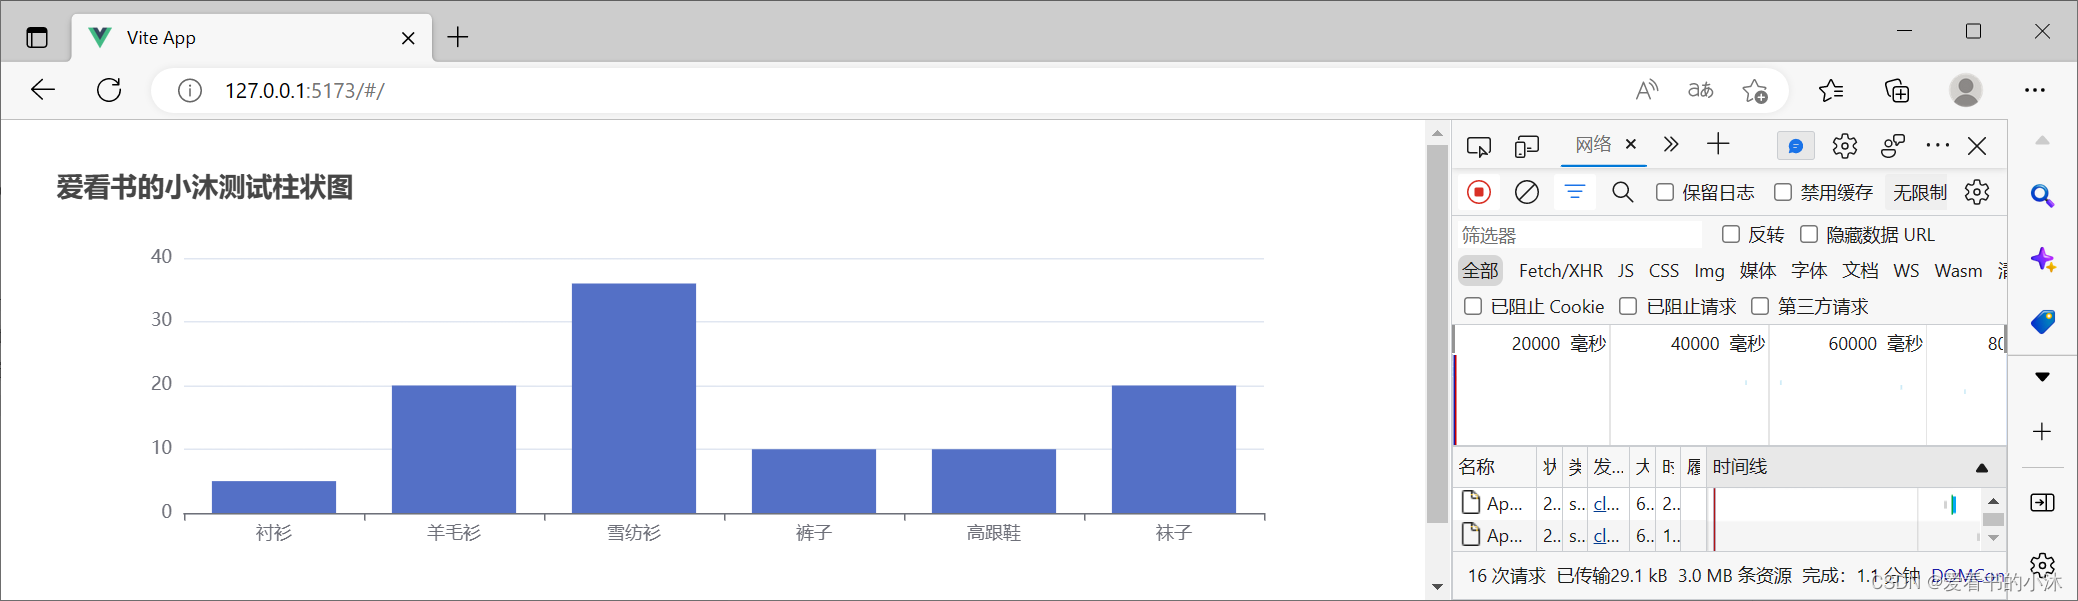
4.2 修改App.vue(柱状图)
安装echarts库:
npm install echarts --save
App.vue修改如下:
<script>
//引入echarts组件
import * as echarts from 'echarts'
import { defineComponent, onMounted } from 'vue'

export default defineComponent({
  setup(){
    onMounted(() =>{
      let myChart = echarts.init(document.getElementById("myChart"));
      myChart.setOption({
	    title : {
		   show:true,
		   text: '爱看书的小沐测试柱状图',
	    },
		tooltip: {},
        xAxis: {
            data: ['衬衫', '羊毛衫', '雪纺衫', '裤子', '高跟鞋', '袜子']
        },
        yAxis: {},
        series: [
          {
            name: "销量",
            type: "bar",
            data: [5, 20, 36, 10, 10, 20, 20, 36, 10, 10, 20],
          },
        ]
      });
    })
  }
})
</script>

<template>
  <div class="echarts-box">
    <div id="myChart" :style="{ width: '900px', height: '300px' }"></div>
  </div>
</template>
浏览器访问如下:
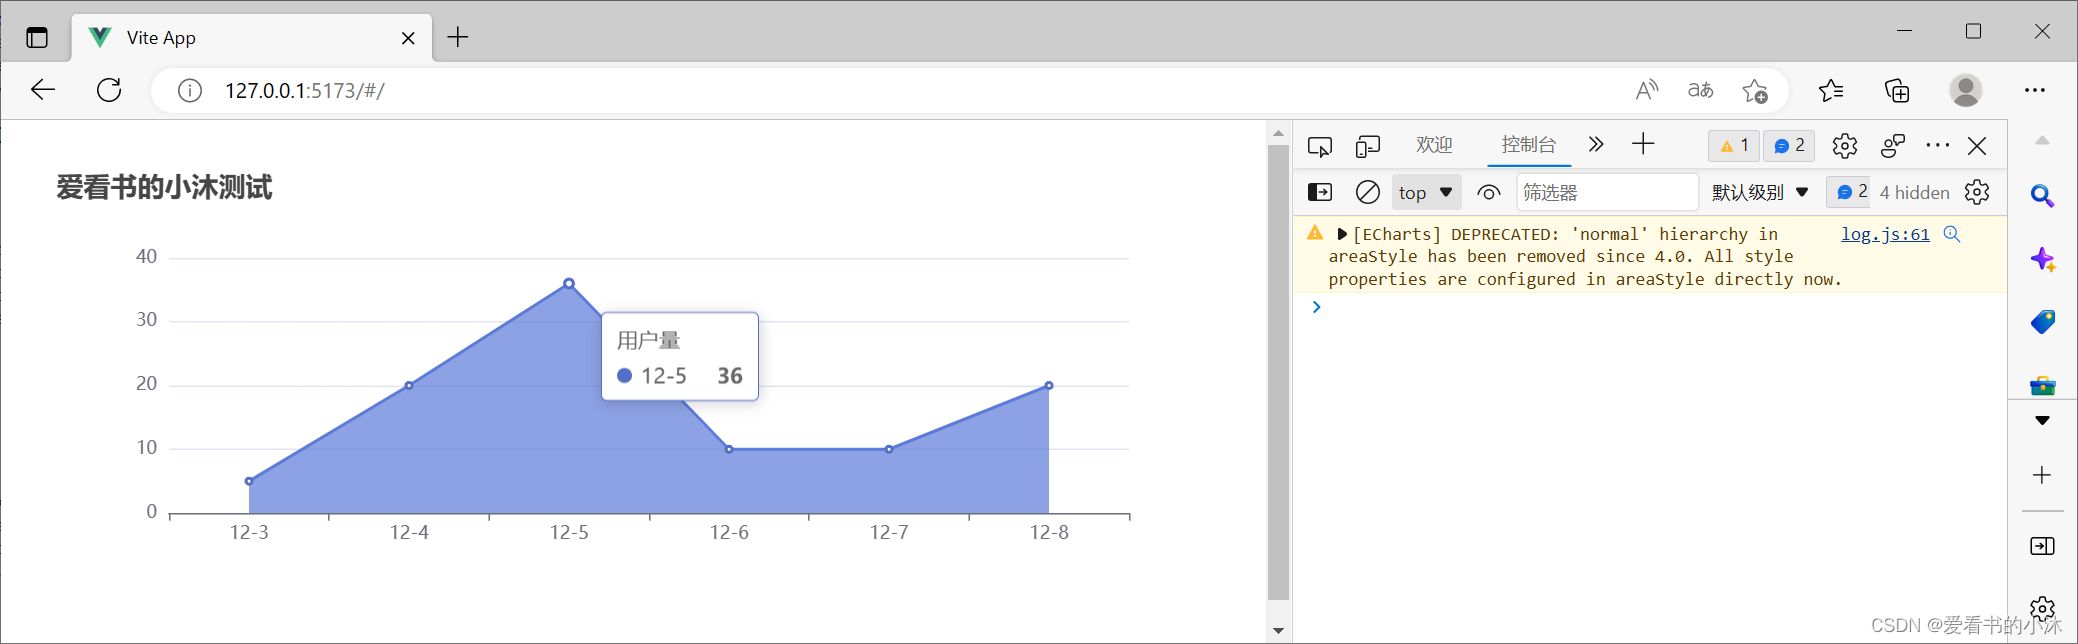
4.3 修改App.vue(面积图,provide / inject)
安装echarts库:
npm install echarts --save
npm install node-sass
npm install sass --save-dev
App.vue修改如下:
<template>
  <div>
    <InjectCom ></InjectCom>
  </div>
</template>

<script>
import { provide, reactive } from 'vue'
import * as echarts from 'echarts'
import InjectCom from "./InjectCom.vue"

export default {
  setup() {
    provide('echarts', echarts)
  },
  components:{
    InjectCom
  }
};
</script>
InjectCom.vue:
<template>
    <div class="echart" ref="chartDom"></div>
</template>

<script setup>
//按需导入需要用到的 vue函数 和echarts
import { ref, inject, onMounted, reactive } from "vue";
const echarts = inject("echarts");
//获取 dom 和 父组件数据 并定义"myChart"用于初始化图表
const chartDom = ref();
// const props = defineProps({
    // option: Object,
// })

let myChart = null;
let option = reactive ({
    title: { text: "爱看书的小沐测试" },
    tooltip: {},
    xAxis: {
        data: ["12-3", "12-4", "12-5", "12-6", "12-7", "12-8"],
    },
    yAxis: {},
    series: [
        {
            name: "用户量",
            type: "line",
            data: [5, 20, 36, 10, 10, 20],
			areaStyle:{
				normal:{
				}
			}
        },
    ],
})
//页面成功渲染,开始绘制图表
onMounted(() => {
    myChart = echarts.init(chartDom.value)
    myChart.setOption(option, true);
    // myChart.setOption(props.option, true);
})
</script>

<style lang="scss" scoped>
.echart {
    width: 800px;
    height: 500px;
}
</style>
浏览器访问如下:

4.4 修改App.vue / main.js(饼状图,getCurrentInstance)
vue3.0的写法,在组件中使用。
安装echarts库:
npm install echarts --save
# npm i -s echarts
main.js修改如下:
// import { createApp } from 'vue'
// import App from './App.vue'
// import './assets/main.css'
// createApp(App).mount('#app')

import { createApp } from 'vue'
import App from './App.vue'

// 引入 echarts
import * as echarts from 'echarts'
const app = createApp(App)

// 全局挂载 echarts
app.config.globalProperties.$echarts = echarts

app.mount('#app')
App.vue修改如下:
<template>
  <div
    ref="myChart"
    id="myChart"
    :style="{ width: '800px', height: '300px' }"
  ></div>
</template>

<script>
import { getCurrentInstance, onMounted } from 'vue';

export default {
  setup() {
    // 通过 internalInstance.appContext.config.globalProperties 获取全局属性或方法
    let internalInstance = getCurrentInstance();
    let echarts = internalInstance.appContext.config.globalProperties.$echarts;

    onMounted(() => {
      const dom = document.getElementById('myChart');
      const myChart = echarts.init(dom); // 初始化echarts实例
      const option = {
		title: { text: "爱看书的小沐测试" },
        series : [
			{
				name: '访问来源',
				type: 'pie',
				radius: '55%',
				roseType: 'angle',
				data:[
					{value:235, name:'视频广告'},
					{value:274, name:'联盟广告'},
					{value:310, name:'邮件营销'},
					{value:335, name:'直接访问'},
					{value:400, name:'搜索引擎'}
				]
			}
		]
      };
      // 设置实例参数
      myChart.setOption(option);
    });
    return {};
  }
};
</script>
浏览器访问如下:

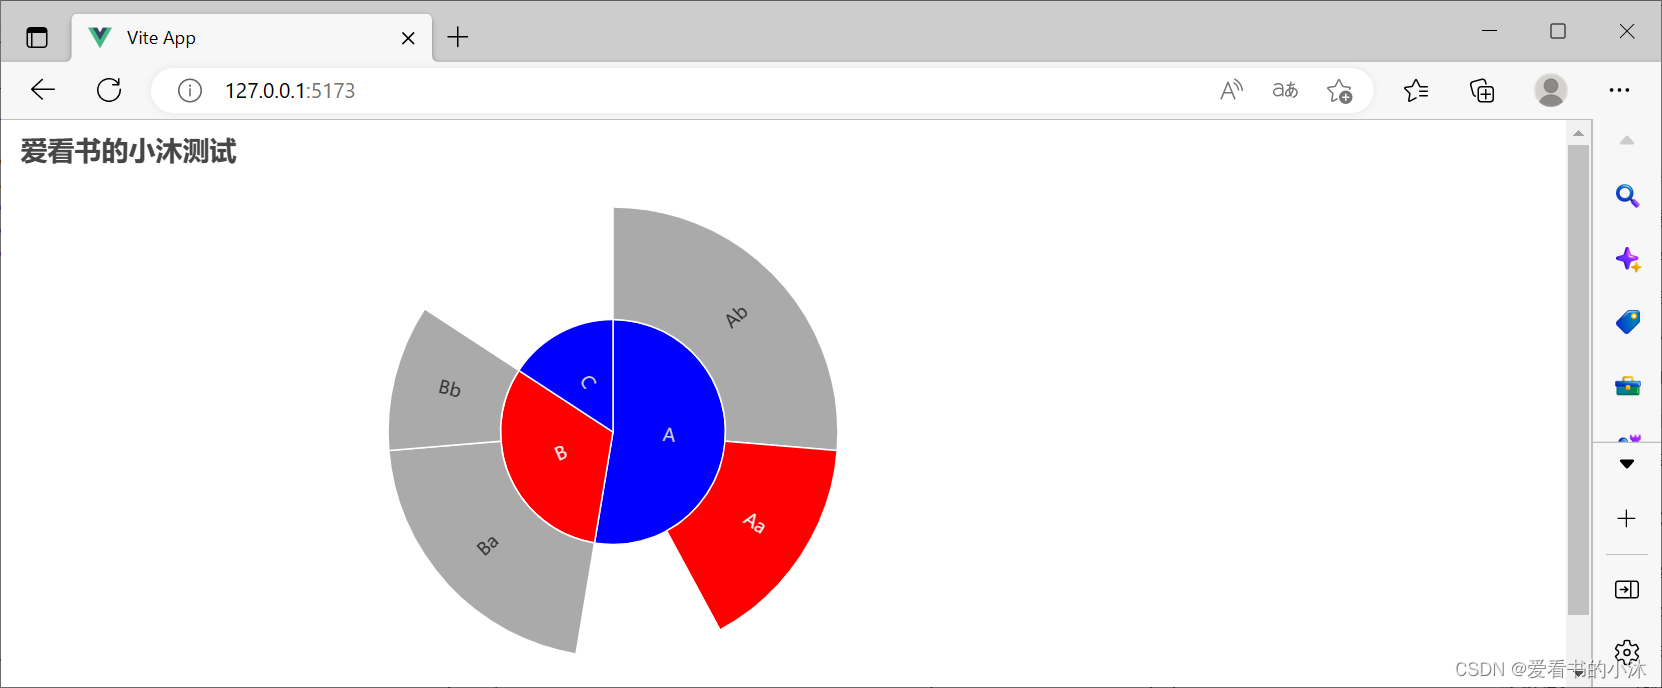
全局挂载后,在组件中以 vue2 的写法。
App.vue修改如下:
<template>
  <div
    ref="myChart"
    id="myChart"
    :style="{ width: '800px', height: '400px' }"
  ></div>
</template>
<script>
export default {
  mounted() {
    this.drawLine();
  },
  methods: {
    drawLine() {
      const dom = this.$refs['myChart'];
      const myChart = this.$echarts.init(dom); // 初始化echarts实例
      const option = {
        title: { text: "爱看书的小沐测试" },
        series: {
			type: 'sunburst',
			data: [{
				name: 'A',
				value: 10,
				children: [{
					value: 3,
					name: 'Aa',
					itemStyle: {
						color: 'red'
					}
				}, {
					value: 5,
					name: 'Ab'
				}]
			}, {
				name: 'B',
				children: [{
					name: 'Ba',
					value: 4
				}, {
					name: 'Bb',
					value: 2
				}],
				itemStyle: {
					color: 'red'
				}
			}, {
				name: 'C',
				value: 3
			}],
			itemStyle: {
				color: '#aaa'
			},
			levels: [{
				// 留给数据下钻的节点属性
			}, {
				itemStyle: {
					color: 'blue'
				}
			}]
		}
      };
      // 设置实例参数
      myChart.setOption(option);
    }
  }
};
</script>
直接在组件中引入echarts。
App.vue修改如下:
<template>
  <div
    ref="myChart"
    id="myChart"
    :style="{ width: '800px', height: '400px' }"
  ></div>
</template>

<script>
// 方式二:直接在组件中引入echarts
import * as echarts from 'echarts';
export default {
  mounted() {
    const dom = this.$refs['myChart']; // 获取dom节点
    const myChart = echarts.init(dom); // 初始化echarts实例

    const option = {
       title: { text: "爱看书的小沐测试" },
       legend: {},
		tooltip: {},
		dataset: {
			// 这里指定了维度名的顺序,从而可以利用默认的维度到坐标轴的映射。
			// 如果不指定 dimensions,也可以通过指定 series.encode 完成映射,参见后文。
			dimensions: ['product', '2015', '2016', '2017'],
			source: [
				{product: 'Matcha Latte', '2015': 43.3, '2016': 85.8, '2017': 93.7},
				{product: 'Milk Tea', '2015': 83.1, '2016': 73.4, '2017': 55.1},
				{product: 'Cheese Cocoa', '2015': 86.4, '2016': 65.2, '2017': 82.5},
				{product: 'Walnut Brownie', '2015': 72.4, '2016': 53.9, '2017': 39.1}
			]
		},
		xAxis: {type: 'category'},
		yAxis: {},
		series: [
			{type: 'bar'},
			{type: 'bar'},
			{type: 'bar'}
		]
    };
    // 设置实例参数
    myChart.setOption(option);
  }
};
</script>


结语
如果您觉得该方法或代码有一点点用处,可以给作者点个赞,或打赏杯咖啡;╮( ̄▽ ̄)╭
如果您感觉方法或代码不咋地//(ㄒoㄒ)//,就在评论处留言,作者继续改进;o_O???
如果您需要相关功能的代码定制化开发,可以留言私信作者;(✿◡‿◡)
感谢各位大佬童鞋们的支持!( ´ ▽´ )ノ ( ´ ▽´)っ!!!


 3923
3923


 被折叠的 条评论
为什么被折叠?
被折叠的 条评论
为什么被折叠?
 到【灌水乐园】发言


