


文章目录
data and chart
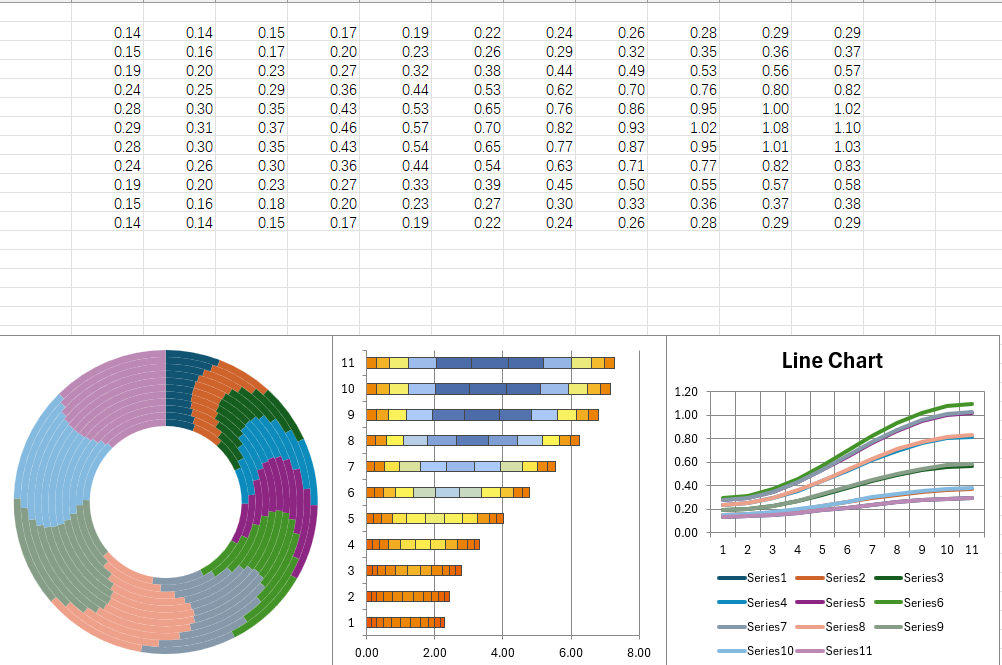
donut chart (radial chart)
A Chart object can be quickly added to a Worksheet by referencing data from a Range
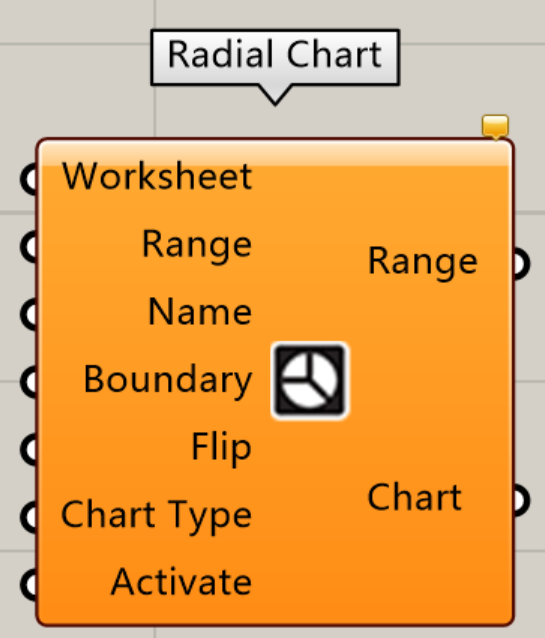
Radial Chart
Add a Radial Chart object
Input parameters:
Worksheet (Generic Data) A Worksheet, Workbook, Range Object, Excel Application, or Text Worksheet Name
Range (Generic Data) A Range Object or Text Address (ex. A1:B1)
Name (Text) The title of the chart
Boundary (Rectangle) The Shape bounding rectangle
Flip (Boolean) If true, the data will be read by column
Chart Type (Integer) The chart type
Pie
Pie3D
Donut
Radar
Radar FilledActivate (Boolean) If true, the component will be activated
Output parameters:
- Range (Generic Data) An Excel Range Object
- Chart (Generic Data) A Chart object
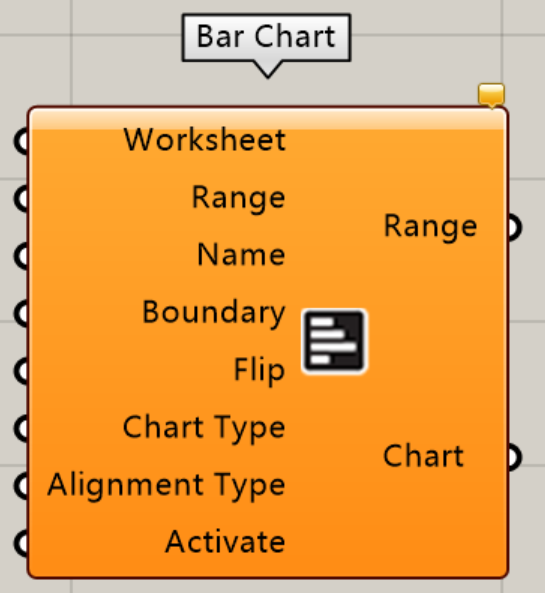
bar chart
Chart graphics can be updated by series or by cell.
Bar Chart
Add a Bar Chart object
Input parameters:
Worksheet (Generic Data) A Worksheet, Workbook, Range Object, Excel Application, or Text Worksheet Name
Range (Generic Data) A Range Object or Text Address (ex. A1:B1)
Name (Text) The title of the chart
Boundary (Rectangle) The Shape bounding rectangle
Flip (Boolean) If true, the data will be read by column
Chart Type (Integer) The chart type
Basic
Box
Pyramid
Cylinder
ConeAlignment Type (Integer) The chart alignment type
Cluster
Stack
FillActivate (Boolean) If true, the component will be activated
Output parameters:
- Range (Generic Data) An Excel Range Object
- Chart (Generic Data) A Chart object
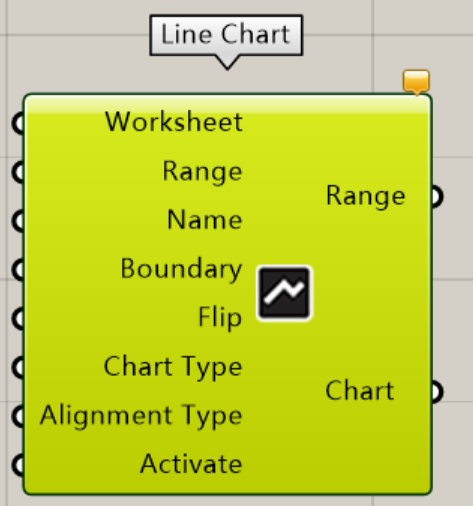
line chart
Chart properties can be modified on a placed Chart.
Line Chart
Add a Line Chart object
Input parameters:
Worksheet (Generic Data) A Worksheet, Workbook, Range Object, Excel Application, or Text Worksheet Name
Range (Generic Data) A Range Object or Text Address (ex. A1:B1)
Name (Text) The title of the chart
Boundary (Rectangle) The Shape bounding rectangle
Flip (Boolean) If true, the data will be read by column
Chart Type (Integer) The chart type
Line
LineMarkers
Area
Area3dAlignment Type (Integer) The chart alignment type
Cluster
Stack
FillActivate (Boolean) If true, the component will be activated
Output parameters:
- Range (Generic Data) An Excel Range Object
- Chart (Generic Data) A Chart object
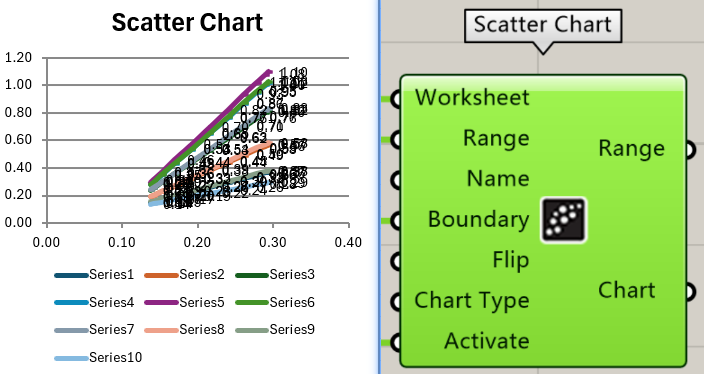
Scatter Chart
Scatter Chart
Add a Scatter Chart object
Input parameters:
Worksheet (Generic Data) A Worksheet, Workbook, Range Object, Excel Application, or Text Worksheet Name
Range (Generic Data) A Range Object or Text Address (ex. A1:B1)
Name (Text) The title of the chart
Boundary (Rectangle) The Shape bounding rectangle
Flip (Boolean) If true, the data will be read by column
Chart Type (Integer) The chart type
Scatter
Scatter Lines
Scatter Smooth
Bubble
Bubble 3DActivate (Boolean) If true, the component will be activated
Output parameters:
- Range (Generic Data) An Excel Range Object
- Chart (Generic Data) A Chart object
Surface Chart
Surface Chart
Add a Surface Chart object
Input parameters:
Worksheet (Generic Data) A Worksheet, Workbook, Range Object, Excel Application, or Text Worksheet Name
Range (Generic Data) A Range Object or Text Address (ex. A1:B1)
Name (Text) The title of the chart
Boundary (Rectangle) The Shape bounding rectangle
Flip (Boolean) If true, the data will be read by column
Chart Type (Integer) The chart type
Surface
SurfaceVireframe
SurfaceTop
SurfaceWireframeTopActivate (Boolean) If true, the component will be activated
Output parameters:
- Range (Generic Data) An Excel Range Object
- Chart (Generic Data) A Chart object
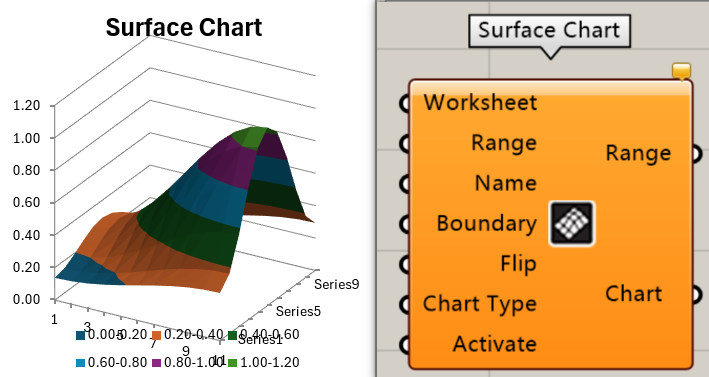
Chart Decorators
Chart Decorators
Update Chart Decorations
Input parameters:
- Chart (Generic Data) A Chart object
- Title (Text) Title
- Legend Location (Integer) The location of the legend
- Data Label (Integer) The data label type
- Grid X (Integer) The X axis Grid settings
- Grid Y (Integer) The Y axis Grid settings
- Axis X (Text) An optional X axis label
- Axis Y (Text) An optional Y axis label
Output parameters:
- Chart (Generic Data) A Chart object
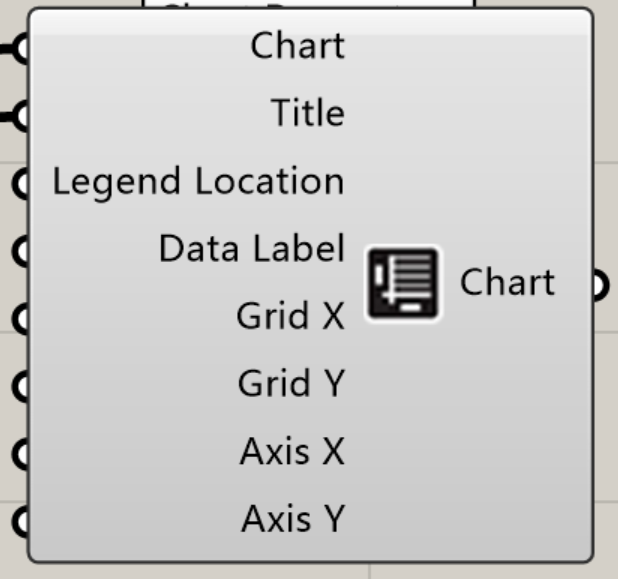
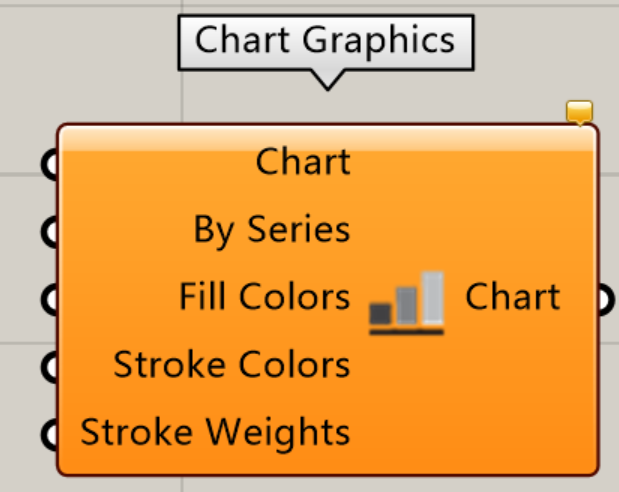
Chart Graphics
Chart Graphics
Update Chart Graphics
Input parameters:
Chart (Generic Data) A Chart objectBy Series (Boolean) If true, values are plotted by series otherwise colors will be by point
Fill Colors (Colour) Chart fill colors S
troke Colors (Colour) Chart stroke colors S
troke Weights (Integer) Chart stroke weights 0-3


 904
904

 被折叠的 条评论
为什么被折叠?
被折叠的 条评论
为什么被折叠?
 到【灌水乐园】发言


