


Since the release of JDK 5 the JVM uses JMX technology to provide information on performance and resource consumption of the applicationsrunning in the JVM. Together with the JConsole tool we can use this information to monitor our applications and locate problems.
To keep applications running smoothly it's important to be able to get information about the performance and resource consumption of theseapplications. This is especially the case for long running applications like websites. While we can get some information from the operatingsystem, like CPU and memory usage, we often need much more detailed information. This is why application server vendors offer specialized tooling to monitor the application server and the applications running inside the application server. A good example of such a tool is IBM's Tivoli Performance Viewer, which enables us to monitor WebSphere Application Server and the applications running inside of it.
But what if we're not using an application server or if we're using an application server that does not include such a monitoring tool? Ratherthen having to rely on the operating system and log and trace files or build our own custom monitoring code, we can use the Java ManagementExtensions (JMX) that are now part of the Java SE platform.
The Java Management Extensions (JMX) specification was created to define a standard architecture and APIs for monitoring and managing Java applications. JMX defines how an application can provide instrumentation for monitoring and managing (part of) an application by creatingso-called MBeans and registering them in a MBean server. This MBean server is part of to a JMX agent togetherwith a minimum number of agent services and at least one protocol adapter or connector.
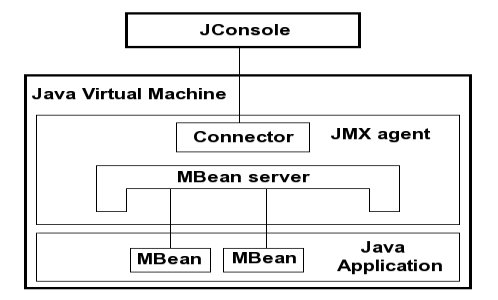
The protocol adapters and connectors enable remote management applications to connect to the JMX agent using differentcommunication protocols like RMI, HTTP or SNMP. For example the JConsole application that's packaged with the Sun JDK since release 5 uses RMI to connect to the JMX agent.
While JConsole is not as sophisticated as some of the tooling offered by application server vendors, it does give some valuable informationabout resource consumption and access to the MBeans running in the JVM. By adding MBeans to our applications or using anapplication server like JBoss that supports JMX, we can easily extend the out-of-the-box functionality. JDK 6 even enables us to add functionality to the JConsole application itself via plugins, as we'll see later on.
Since we'll be using the version of JConsole that comes with JDK 6, let's take a quick look at the changes from JDK 5. If you're still using JDK 5, the features listed below will not be available to you. Note that it's possible to use JConsole from JDK 6 to connect to a JDK 5JVM, in which case you'll only be missing the features added to the JVM in release 6.
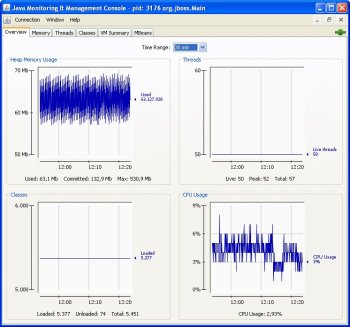
- The Summary tab has been replaced with the Overview tab shown above. This tab shows the graphs from the Memory,Threads and Classes tabs and a graph of the CPU usage of the JVM which is not available in JDK 5. The informationon the Summary tab has been merged with the VM tab, now called VM Summary
- JConsole now has a Plugin API for adding custom functionality.
- JConsole can now use the attach API to dynamically attach to a JVM. This requires a Java 6 JVM. To connect to a Java 5 JVM, theJVM must be started with
-Dcom.sun.management.jmxremote.
If you're connecting to a Java 6 JVM, you'll also find a new HotSpot Diagnostics MBean on the MBeans tab. This new MBeanprovides an API to request heap dump at runtime and change the setting of certain VM options.
As an example we'll be using JConsole to monitor the memory consumption of a web application running in JBoss 4.0.5 on our local machine. We'llbe looking at monitoring applications on a remote machine in part 2.
Because JBoss has its own MBean server that it uses to register its MBeans with, we still need the com.sun.management.jmxremote system setting even if we're using JDK 6. If we don't do this JBoss will generate a ClassNotFoundException if you try to connect with JConsole. Another result of the fact that JBoss uses it's own MBean server is that the JBoss MBeans will not beavailable on the MBeans tab. If you want these MBeans available in JConsole and you're using JBoss 4.0.3 or later, you can use thefollowing JVM options in the JBoss startup script:
 -Djavax.management.builder.initial=org.jboss.system.server.jmx.MBeanServerBuilderImpl
 -Djboss.platform.mbeanserver
 -Dcom.sun.management.jmxremote
Although this solution enables us to use both the JBoss and Java platform MBean server this also frequently generates errors whenconnecting to JBoss. Simply reconnecting usually solves the problem, but I suggest you only use this solution if you really need it. I alsorecommend that you start with the platform MBean server and add the JBoss MBean server when you have successfully configuredall other JConsole related settings. This way you'll avoid debugging connection problems caused by the JBoss MBean server, especiallywhen connecting to remote applications.
With the startup script modified, we can now start JBoss and startup JConsole. JConsole will open with the New Connection dialogthat lists a Java processes running on the local machine. Java processes that do not support remote JMX access will be grayed out. Selectthe JBoss process and click Connect.

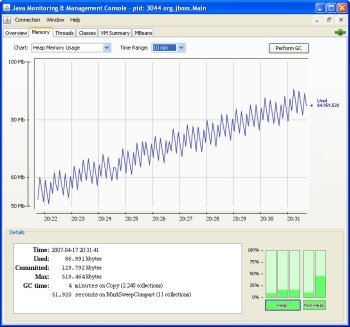
JConsole will connect to the JVM running JBoss and we can select the Memory tab to monitor the memory consumption of our applicationrunning in JBoss. To check for memory leaks in our application we can start a load test to create a constant load on the application. If thefunctionality we're testing during the load test does not contain a memory leak the memory usage should stay between a certain upper and lowerlimit.
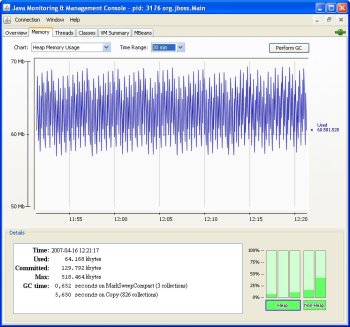
On the other hand if there is a memory leak in our application, we'll slowly see the memory usage growing over time. Depending on how muchmemory the application is leaking per request and the load on the application, this may take quite some time. It may even take hours beforeyou see a change in the memory usage. For example the screenshot below shows an increase in the heap memory usage after about 20 minutes even though I've created a fairly large memory leak for this test.
Because objects that haven't been garbage collected for a longer period of time eventually end up in the tenured generation of the heap, the graph for this part of the heap shows our problem even more clearly. See Resources for more informationon garbage collection.

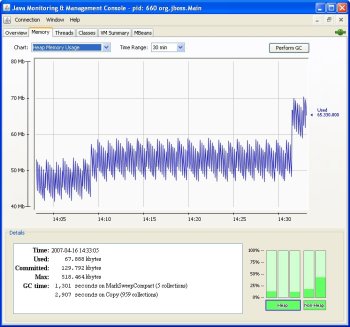
If you think you found a memory leak, make sure that you've tested long enough. Not only may it take a while before a memory leak will showitself in the graph, but short term changes in the size of the heap may also look like a memory leak when over a longer period of time theheap never grows beyond a certain limit. As an example of this look at the screenshot below. This looks like an obvious memory leak, right?
As it turns out this is not a memory leak, but caused by the fact that in this test we create a session for every user. Since the sessionswill not time out until after 30 minutes of inactivity, we see a large growth of the heap in the first 30 minutes of our test. So make sureyou've tested long enough and try to eliminate other causes for memory usages as much as possible. This includes sessions, but also try tokeep the number of threads constant by using a constant load. You can use the Threads tab to check if sudden jumps in memory usagecoincide with an increase in the number of threads.
If you do think you've found a memory leak try to test a smaller part of the application to zero in on the location of the problem. You canalso make a heapdump using the HotSpot Diagnostics MBean and analyze it with the jhat tool to find out which objects are responsiblefor allocating so much memory.
Monitoring memory consumptions is just one of the useful things you can do with JConsole. You can monitor CPU usage, detect deadlocks on theThreads tab or use the MBeans tab to monitor or manage specific parts of the JVM or the application running in it. If you'reusing JDK 6 you can also write your own plugins for JConsole to add the functionality you need.
JDK 6 comes with a demo plugin called JTop that adds an extra tab to JConsole that shows the threads that have been using the most CPU timesimilar to the top command in Linux. Use the following command to start JConsole with this command:
<JDK6>/bin/jconsole -pluginpath <JDK6>/demo/management/JTop/JTop.jar
For more examples of JConsole plugins see the Resources section.
As we've seen JConsole can be a useful tool to monitor the health of our applications and diagnose problems on our local machine. Whilethis is no problem during development, using JConsole locally in a production environment is not recommended because of the significant resourceusage of JConsole itself. So to monitor applications in a production environment we should use the remote monitoring functionality of JConsole, which we'll be looking at in Part 2.
Resources
- Download the latest Sun JDK including JConsole from:java.sun.com.
- To find out more about JMX visit the JMX documentation page.
- For more examples of how to use JConsole to monitor and manage applications read Monitoring and Management Using JMX.
- For more information about configuring JBoss for JConsole visit theJBossMBeansInJConsolepage of the JBoss Wiki.
- To learn more about the tools to use in combination with JConsole to diagnose common problems in Java applications readMonitoring and Managing Java SE 6 Platform Applications.
- For more information about garbage collection in the HotSpot JVM read Java SE 6 HotSpot Virtual Machine Garbage Collection Tuning.
- For more examples of JConsole plugins check out thescript shell pluginand theper-thread CPU usage plugin.


 762
762

 被折叠的 条评论
为什么被折叠?
被折叠的 条评论
为什么被折叠?
 到【灌水乐园】发言


