


计算指标的定义和公式:
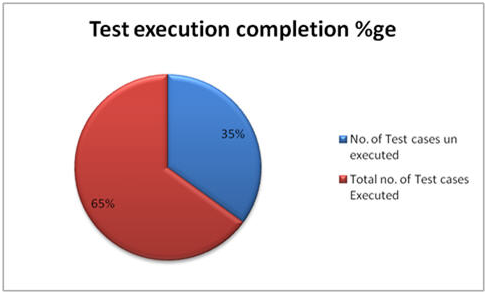
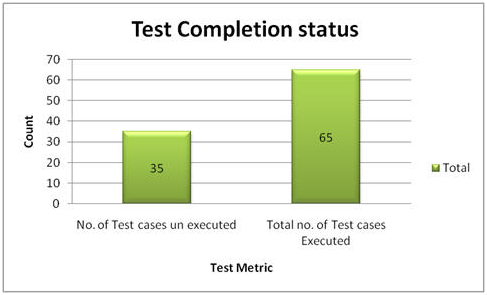
1.测试用例执行的百分比:这个指标是用来获取测试用例的执行状态的百分比。
用例执行百分比=(执行的用力个数/总的用例个数) *100
所以从上面的数据可得,
用例执行百分比=( 65/100) *100=65%
2.没执行用例的百分比:这个指标是用来获取待测试用例的执行状态的百分比。
未执行的测试用例的百分比=(未执行用例/总的用例个数) *100
所以从上面的数据可得,
中断用例的百分比=( 35/100) *100=35%

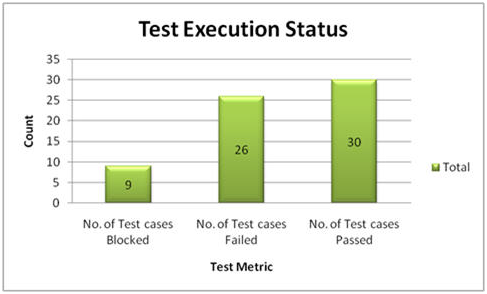
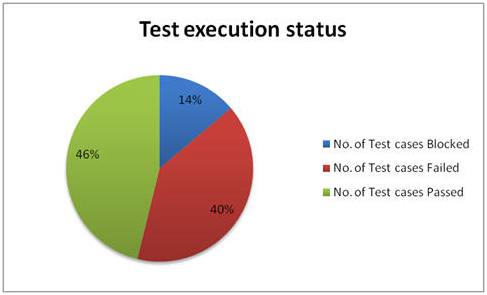
3.通过用例百分比:这个指标是用来获得已测试用例中通过的用例的百分比
通过用例百分比=(用例通过个数/总的已测试用例数) *100
所以从上面的数据可得,
用例通过百分比=( 30/65) *100=46%
4.用例失败百分比:这个指标是用来获取已测试用例中失败用例的百分比。
用例失败百分比=(失败用例个数/总的已测试用例个数) *100
所以从上面的数据可得,
用例失败百分比=(26/65)*100=40%
5.中断用例百分比:这个指标是用来获得已测试用例中中断用例的百分比。 可用一个更为详尽的报告说明测试用例中断的具体原因。
中断用例百分比=(中断用例个数/总的已测试用例个数)*100
所以从上面的数据可得,
中断用例百分比=( 9/65) *100=14%
6.缺陷密度=确定的缺陷数/大小
这里的“大小”被认定为需求。因此这里的缺陷密度指的是每个需求中被确认的缺陷数。同样的,缺陷密度还可以被计算为每 100 行代码含有多少缺陷或者每个模块含有的缺陷数。
所以从上面的数据可得,
缺陷密度=(30/5)=6
7.缺陷的改进率=( QA 测试发现的缺陷数/( QA 测试发现的缺陷数+用户使用发现的缺陷数)) *100
缺陷的改进率用于判定系统的测试效果。
假如,在开发和 QA 测试阶段,我们可以发现 100 个缺陷,在 QA 测试之后,在α和β测试,用户/客户使用发现的缺陷为 40 个,这些缺陷可以在 QA 测试阶段被发现,那么,缺陷改进率就可以被定义为:
缺陷改进率=[100/(100+40)]*100=71%
8.漏测率:漏测指标用于定义 QA 的测试效率,在 QA 测试中有多少缺陷被漏测。
漏测率=(非 QA 测试发现的缺陷数/QA 测试发现的缺陷数)*100
假如,在开发和测试期间,我们可以发现 100 个缺陷,在 QA 测试之后,在α和β测试,用户/客户使用发现的缺陷为 40 个,这些缺陷可以在 QA 测试阶段被发现,那么,缺陷改进率就可以被定义为:
漏测率=( 40/100) *100=40%
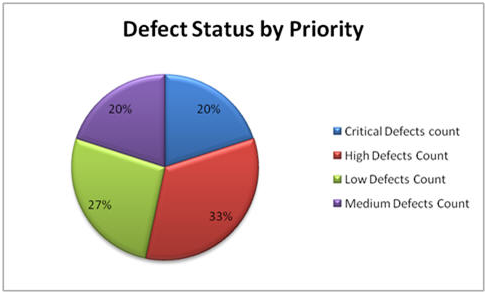
9.缺陷的优先级:这个指标被用于定义缺陷基于严重程度/优先级分类的个数,以决定软件的质量。
严重缺陷的百分比:严重缺陷个数/总的缺陷数*100
从上面的表中的数据可得:
严重缺陷百分比=6/30*100=20%
优先级别较高的缺陷的百分比:优先级别较高的缺陷个数/总的缺陷数*100
从上面的表中的数据可得:
优先级别较高的缺陷百分比=10/30*100=33.33%
一般缺陷的百分比:一般的缺陷个数/总的缺陷数*100
从上面的表中的数据可得:
一般缺陷百分比=6/30*100=20%
轻微缺陷的百分比:轻微缺陷个数/总的缺陷数*100
从上面的表中的数据可得:
轻微缺陷百分比=8/30*100=27%
结论:
本文中提供的指标主要用于生成每日/每周状态报告和准确的数据在开发/测试用例执行阶段并且这也是跟踪项目状态和软件的质量有效性方法。
关于作者:这篇文章由 Anuradha k 编写.她有 7 年以上的软件测试工作经验,目前在一家跨国公司担任顾问。她也有很好的手机自动化测试的知识。
在你的项目你用的是什么测试度量方法?像往常一样,请留下评论让我们知道你的想法。
原文如下:
Definitions and Formulas for Calculating Metrics:
#1) %ge Test cases Executed: This metric is used to obtain the execution status of the test cases in terms of %ge.
%ge Test cases Executed = (No. of Test cases executed / Total no. of Test cases written) * 100.
So, from the above data,
%ge Test cases Executed = (65 / 100) * 100 = 65%
#2) %ge Test cases not executed: This metric is used to obtain the pending execution status of the test cases in terms of %ge.
%ge Test cases not executed = (No. of Test cases not executed / Total no. of Test cases written) * 100.
So, from the above data,
%ge Test cases Blocked = (35 / 100) * 100 = 35%

#3) %ge Test cases Passed: This metric is used to obtain the Pass %ge of the executed test cases.
%ge Test cases Passed = (No. of Test cases Passed / Total no. of Test cases Executed) * 100.
So, from the above data,
%ge Test cases Passed = (30 / 65) * 100 = 46%
#4) %ge Test cases Failed: This metric is used to obtain the Fail %ge of the executed test cases.
%ge Test cases Failed = (No. of Test cases Failed / Total no. of Test cases Executed) * 100.
So, from the above data,
%ge Test cases Passed = (26 / 65) * 100 = 40%
#5) %ge Test cases Blocked: This metric is used to obtain the blocked %ge of the executed test cases. A detailed report can be submitted by specifying the actual reason of blocking the test cases.
%ge Test cases Blocked = (No. of Test cases Blocked / Total no. of Test cases Executed) * 100.
So, from the above data,
%ge Test cases Blocked = (9 / 65) * 100 = 14%


#6) Defect Density = No. of Defects identified / size
(Here “Size” is considered as requirement. Hence here the Defect Density is calculated as number of defects identified per requirement. Similarly, Defect Density can be calculated as number of Defects identified per 100 lines of code [OR] No. of defects identified per module etc.)
So, from the above data,
Defect Density = (30 / 5) = 6
#7) Defect Removal Efficiency (DRE) = (No. of Defects found during QA testing / (No. of Defects found during QA testing +No. of Defects found by End user)) * 100
DRE is used to identify the test effectiveness of the system.
Suppose, During Development & QA testing, we have identified 100 defects.
After the QA testing, during Alpha & Beta testing, end user / client identified 40 defects, which could have been identified during QA testing phase.
Now, The DRE will be calculated as,
DRE = [100 / (100 + 40)] * 100 = [100 /140] * 100 = 71%
#8) Defect Leakage: Defect Leakage is the Metric which is used to identify the efficiency of the QA testing i.e., how many defects are missed / slipped during the QA testing.
Defect Leakage = (No. of Defects found in UAT / No. of Defects found in QA testing.) * 100
Suppose, During Development & QA testing, we have identified 100 defects.
After the QA testing, during Alpha & Beta testing, end user / client identified 40 defects, which could have been identified during QA testing phase.
Defect Leakage = (40 /100) * 100 = 40%
#9) Defects by Priority: This metric is used to identify the no. of defects identified based on the Severity / Priority of the defect which is used to decide the quality of the software.
%ge Critical Defects = No. of Critical Defects identified / Total no. of Defects identified * 100
From the data available in the above table,
%ge Critical Defects = 6/ 30 * 100 = 20%
%ge High Defects = No. of High Defects identified / Total no. of Defects identified * 100
From the data available in the above table,
%ge High Defects = 10/ 30 * 100 = 33.33%
%ge Medium Defects = No. of Medium Defects identified / Total no. of Defects identified * 100
From the data available in the above table,
%ge Medium Defects = 6/ 30 * 100 = 20%
%ge Low Defects = No. of Low Defects identified / Total no. of Defects identified * 100
From the data available in the above table,
%ge Low Defects = 8/ 30 * 100 = 27%

Conclusion:
The metrics provided in this article are majorly used for generating the daily/weekly status report with accurate data during test case development/execution phase & this is also useful for tracking the project status & Quality of the software.
About the author: This is a guest post by Anuradha K. She is having 7+ years of software testing experience and currently working as a consultant for a MNC. She is also having good knowledge of mobile automation testing.
Which other test metrics do you use in your project? As usual, let us know your thoughts/queries in comments below.


 1042
1042

 被折叠的 条评论
为什么被折叠?
被折叠的 条评论
为什么被折叠?
 到【灌水乐园】发言


