


 该代码示例展示了如何在Java中使用ApachePOI库的5.2.2版本创建Word文档中的线形图。方法包括设置图例、X轴和Y轴的显示、颜色、线型、网格线以及数据源等详细配置。
poi版本5.2.2
public class WordLineChart  implements WordChart {

	public void bulider(XWPFChart chart, ChartOption options) {
		String sheetName = "sheet0";
		XSSFWorkbook workbook = null;
		try {
			workbook = chart.getWorkbook();
		} catch (Exception e) {
			e.printStackTrace();
			return;
		}
		XSSFSheet sheet = workbook.getSheet(sheetName);
		int rowIndex = this.refreshSheet(sheet, options);
		String[] dimensions = options.getDimensions();

		// 字体颜色
		XDDFSolidFillProperties fontColor = new XDDFSolidFillProperties(XDDFColor.from(new byte[] {(byte)96,(byte)98,(byte)102}));

		// 样式线
		XDDFLineProperties line = new XDDFLineProperties();
		line.setFillProperties(new XDDFSolidFillProperties(XDDFColor.from(new byte[] {(byte)228,(byte)231,(byte)237})));
		line.setWidth(0.5);

		XDDFLineProperties noLine = new XDDFLineProperties();
		noLine.setFillProperties(new XDDFNoFillProperties());

		// 图例
		if(options.isShowLegend()) {
			XDDFChartLegend legend = chart.getOrAddLegend();
			legend.setPosition(options.getLegendPosition());
		}

		// X轴
		XDDFCategoryAxis xAxis = chart.createCategoryAxis(AxisPosition.BOTTOM);
		if(!options.isShowXAxis()) {
			xAxis.setVisible(false);// X轴不显示
		}
		xAxis.setMajorTickMark(AxisTickMark.NONE);// 轴刻度线
		// 标签样式
		XDDFRunProperties xTextProperties = xAxis.getOrAddTextProperties();
		xTextProperties.setFillProperties(fontColor);
		// 轴线样式
		XDDFShapeProperties xAxisLineProperties = xAxis.getOrAddShapeProperties();
		if(options.isShowXAxisLine()) {
			xAxisLineProperties.setLineProperties(line);
		} else {
			xAxisLineProperties.setLineProperties(noLine);
		}
		// 网格线
		if(options.isShowXGrid()) {
			XDDFShapeProperties xGridProperties = xAxis.getOrAddMajorGridProperties();
			xGridProperties.setLineProperties(line);
		}

		// Y轴
		XDDFValueAxis  yAxis = chart.createValueAxis(AxisPosition.LEFT);
		if(!options.isShowYAxis()) {
			yAxis.setVisible(false);// Y轴不显示
		}
		yAxis.setMajorTickMark(AxisTickMark.NONE);// 轴刻度线
		// 标签样式
		XDDFRunProperties yTextProperties = yAxis.getOrAddTextProperties();
		yTextProperties.setFillProperties(fontColor);
		// 轴线样式
		XDDFShapeProperties yAxisLineProperties = yAxis.getOrAddShapeProperties();
		if(options.isShowYAxisLine()) {
			yAxisLineProperties.setLineProperties(line);
		} else {
			yAxisLineProperties.setLineProperties(noLine);
		}
		// 网格线
		if(options.isShowYGrid()) {
			XDDFShapeProperties yGridProperties = yAxis.getOrAddMajorGridProperties();
			yGridProperties.setLineProperties(line);
		}

		XDDFLineChartData lineChart = (XDDFLineChartData) chart.createData(ChartTypes.LINE, xAxis, yAxis);
		XDDFCategoryDataSource xAxisSource = XDDFDataSourcesFactory.fromStringCellRange(sheet,new CellRangeAddress(1, rowIndex - 1, 0, 0));
		CTLineChart  c = chart.getCTChart().getPlotArea().getLineChartArray(0);
		for (int i = 1; i < dimensions.length; i++) {
			XDDFNumericalDataSource<Double> yAxisSource = XDDFDataSourcesFactory.fromNumericCellRange(sheet,new CellRangeAddress(1, rowIndex - 1, i, i));
			XDDFLineChartData.Series series = (XDDFLineChartData.Series) lineChart.addSeries(xAxisSource, yAxisSource);

			XDDFSolidFillProperties seriesProperties = new XDDFSolidFillProperties(XDDFColor.from(options.getColor(i-1)));
			XDDFLineProperties lineProperties = new XDDFLineProperties();
			lineProperties.setWidth(1.4);
			lineProperties.setFillProperties(seriesProperties);
			series.setLineProperties(lineProperties);

			series.setSmooth(false); // 是否圆滑曲线
			series.setMarkerSize((short) 5); // 标记大小
			series.setMarkerStyle(MarkerStyle.CIRCLE); // 标记形状
			// 设置标记颜色
			CTLineSer ser = c.getSerArray(i-1);
			CTMarker marker = ser.getMarker();
			setMarkerColor(marker, options.getColor(i-1));

			String name = dimensions[i];
			series.setTitle(name, new CellReference(sheetName, 0, i, true, true));
		}
		chart.plot(lineChart);
	}

	/**
	 * 	设置标记点颜色
	 */
	private void setMarkerColor(CTMarker marker, byte[] color) {
		CTShapeProperties shapeProperties = marker.addNewSpPr();
		// 边框颜色
		CTLineProperties borderProperties = shapeProperties.addNewLn();
		CTSolidColorFillProperties borderColor = borderProperties.addNewSolidFill();
		borderColor.addNewSrgbClr().setVal(color);
		// 填充颜色
		CTSolidColorFillProperties fillProperties = shapeProperties.addNewSolidFill();
		fillProperties.addNewSrgbClr().setVal(new byte[] { (byte) 255, (byte) 255, (byte) 255 });
	}
}
效果如下
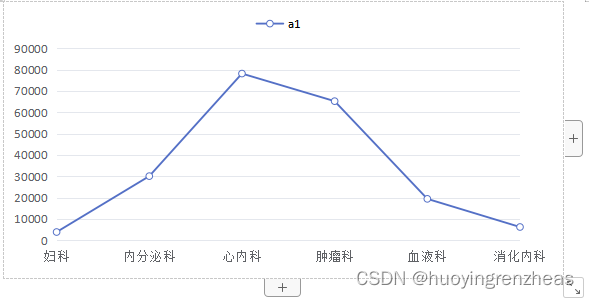
本功能所有代码实现,摘自开源项目demo-ureport: 基于spring boot + Vue2 + Element UI + Echarts 重构ureport2中国式复杂报表设计器开源项目目录src/main/java/com/bstek/ureport/export/word/chart下


 5708
5708

 被折叠的 条评论
为什么被折叠?
被折叠的 条评论
为什么被折叠?
 到【灌水乐园】发言


