


1. heapster介绍
Heapster是容器集群监控和性能分析工具,天然的支持Kubernetes和CoreOS。Kubernetes有个出名的监控agent—cAdvisor。在每个kubernetes Node上都会运行cAdvisor,它会收集本机以及容器的监控数据(cpu,memory,filesystem,network,uptime)。在较新的版本中,K8S已经将cAdvisor功能集成到kubelet组件中。每个Node节点可以直接进行web访问。
Heapster是一个收集者,Heapster可以收集Node节点上的cAdvisor数据,将每个Node上的cAdvisor的数据进行汇总,还可以按照kubernetes的资源类型来集合资源,比如Pod、Namespace域,可以分别获取它们的CPU、内存、网络和磁盘的metric。默认的metric数据聚合时间间隔是1分钟。还可以把数据导入到第三方工具(如InfluxDB)。
Kubernetes原生dashboard的监控图表信息来自heapster。在Horizontal Pod Autoscaling中也用到了Heapster,HPA将Heapster作为Resource Metrics API,向其获取metric,做法是在kube-controller-manager 中配置–api-server指向kube-aggregator,也可以使用heapster来实现,通过在启动heapster的时候指定–api-server=true。
架构图:
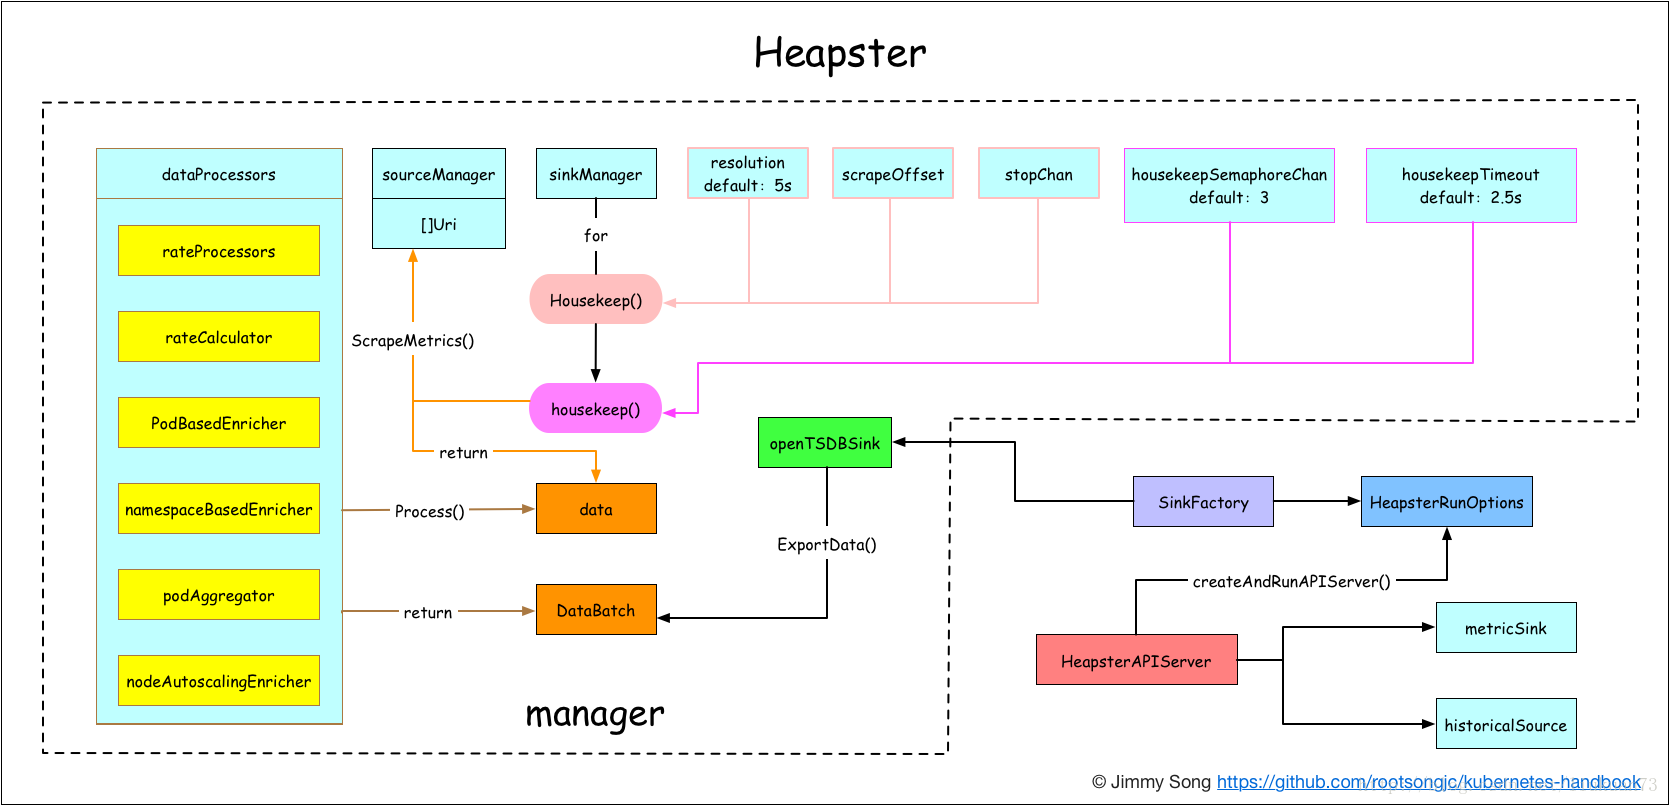
框架图: 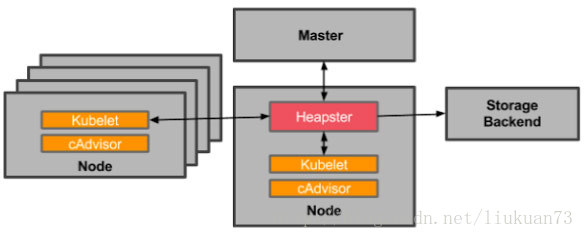
Heapster首先从K8S Master获取集群中所有Node的信息,然后通过这些Node上的kubelet获取有用数据,而kubelet本身的数据则是从cAdvisor得到。所有获取到的数据都被推到Heapster配置的后端存储中,并还支持数据的可视化。现在后端存储 + 可视化的方法,如InfluxDB + grafana。
说明:本实验采用influxdb作为heapster后端
2.Heapster部署
2.1 获取最新版heapster(v1.5.0-beta.2)
到 heapster release 页面(https://github.com/kubernetes/heapster/releases)下载最新版本的 heapster:
wget https://github.com/kubernetes/heapster/archive/v1.5.0-beta.2.zip
unzip v1.5.0-beta.2.zip
cd heapster-1.5.0-beta.2/deploy/kube-config/influxdb- 1
- 2
- 3
2.2 修改配置文件
2.2.1 heapster配置
修改heapster.yml配置文件
deployment:
        image: daocloud.io/liukuan73/heapster-amd64:v1.5.0-beta.2
        imagePullPolicy: IfNotPresent
      nodeSelector:
        kubernetes.io/hostname: k8smaster02
service:
  type: NodePort
nodePort: 30003- 1
- 2
- 3
- 4
- 5
- 6
- 7
- 8
部署好后可以打开kubernetes-dashboard看效果,看是否显示各 Nodes、Pods 的 CPU、内存、负载等利用率曲线图;
2.2.2 grafana配置
修改grafana.yaml配置文件:
deployment:
        image: daocloud.io/liukuan73/heapster-grafana:v4.4.3
        imagePullPolicy: IfNotPresent
          # If you're only using the API Server proxy, set this value instead:
          value: /api/v1/namespaces/kube-system/services/monitoring-grafana/proxy
          #value: /
      nodeSelector:
        kubernetes.io/hostname: k8smaster02
service:
  type: NodePort
nodePort: 30002- 1
- 2
- 3
- 4
- 5
- 6
- 7
- 8
- 9
- 10
- 11
备注:
如果后续使用 kube-apiserver 或者 kubectl proxy 访问 grafana dashboard,则必须将 GF_SERVER_ROOT_URL 设置为 /api/v1/proxy/namespaces/kube-system/services/monitoring-grafana/,否则后续访问grafana时访问时提示找不到http://172.20.0.113:8086/api/v1/proxy/namespaces/kube-system/services/monitoring-grafana/api/dashboards/home 页面;
2.2.3 influxdb配置
2.2.3.1 开启admin UI
说明:
influxdb 官方建议使用命令行或 HTTP API 接口来查询数据库,从 v1.1.0 版本开始默认关闭 admin UI,将在后续版本中移除 admin UI 插件。开启镜像中 admin UI的办法如下:
先导出镜像中的 influxdb 配置文件,开启 admin 插件后,再将配置文件内容写入 ConfigMap,最后挂载到镜像中,达到覆盖原始配置的目的:
docker run --rm --entrypoint 'cat' -ti daocloud.io/liukuan73/heapster-influxdb-amd64:v1.3.3 /etc/config.toml > config.toml- 1
修改config.toml,启用 admin 接口:
[[graphite]]
enabled = true- 1
- 2
使用修改后的配置文件创建configmap:
kubectl create configmap influxdb-config --from-file=config.toml -n kube-system- 1
修改influxdb.yaml,将 ConfigMap 中的配置文件挂载到 Pod 中,达到覆盖原始配置的目的:
 deployment:
        - mountPath: /etc/
          name: influxdb-config
      - name: influxdb-config
        configMap:
          name: influxdb-config
service:
spec:
  type: NodePort
  ports:
  - port: 8086
    targetPort: 8086
    nodePort: 30004
    name: http
  - port: 8083
    targetPort: 8083
    nodePort: 30005
name: admin- 1
- 2
- 3
- 4
- 5
- 6
- 7
- 8
- 9
- 10
- 11
- 12
- 13
- 14
- 15
- 16
- 17
- 18
说明:
service中额外增加了 admin 端口映射,用于后续浏览器访问 influxdb 的 admin UI 界面;
2.2.3.2 修改influxdb.yaml中其他配置
deployment:
        image: daocloud.io/liukuan73/heapster-influxdb-amd64:v1.3.3
        imagePullPolicy: IfNotPresent
      nodeSelector:
kubernetes.io/hostname: k8smaster02- 1
- 2
- 3
- 4
- 5
3.界面访问
3.1 grafana
- 通过 kube-apiserver 访问:
获取 monitoring-grafana 服务 URL
# kubectl cluster-info
Kubernetes master is running at http://localhost:8080
dnsmasq is running at http://localhost:8080/api/v1/proxy/namespaces/kube-system/services/dnsmasq
Heapster is running at http://localhost:8080/api/v1/proxy/namespaces/kube-system/services/heapster
kubedns is running at http://localhost:8080/api/v1/proxy/namespaces/kube-system/services/kubedns
monitoring-grafana is running at http://localhost:8080/api/v1/proxy/namespaces/kube-system/services/monitoring-grafana
monitoring-influxdb is running at http://localhost:8080/api/v1/proxy/namespaces/kube-system/services/monitoring-influxdb

To further debug and diagnose cluster problems, use 'kubectl cluster-info dump'.- 1
- 2
- 3
- 4
- 5
- 6
- 7
- 8
- 9
浏览器访问 URL: https://10.142.21.22:6443/api/v1/proxy/namespaces/kube-system/services/monitoring-grafana
- 通过 kubectl proxy 访问:
创建代理
kubectl proxy --address='10.142.21.21' --port=8086 --accept-hosts='^*$'
Starting to serve on 10.142.21.21:8086- 1
- 2
浏览器访问 URL:http://10.142.21.21:8086/api/v1/proxy/namespaces/kube-system/services/monitoring-grafana
可我打开咋是这个页面呢: 
一些js和css元素找不到…留作以后处理…
3.2 访问 influxdb admin UI
通过 kube-apiserver 的非安全端口访问 influxdb 的 admin UI 界面: http://10.142.21.21:8080/api/v1/proxy/namespaces/kube-system/services/monitoring-influxdb:8087/
备注:我的api_server只向localhost开放了非安全的8080端口,所以我只能通过安全端口访问:https://10.142.21.21:6443/api/v1/proxy/namespaces/kube-system/services/monitoring-influxdb:8087/
在页面的 “Connection Settings” 的 Host 中输入 node IP, Port 中输入 8086 映射的 nodePort 如上面的 30004,点击 “Save” 即可
注意
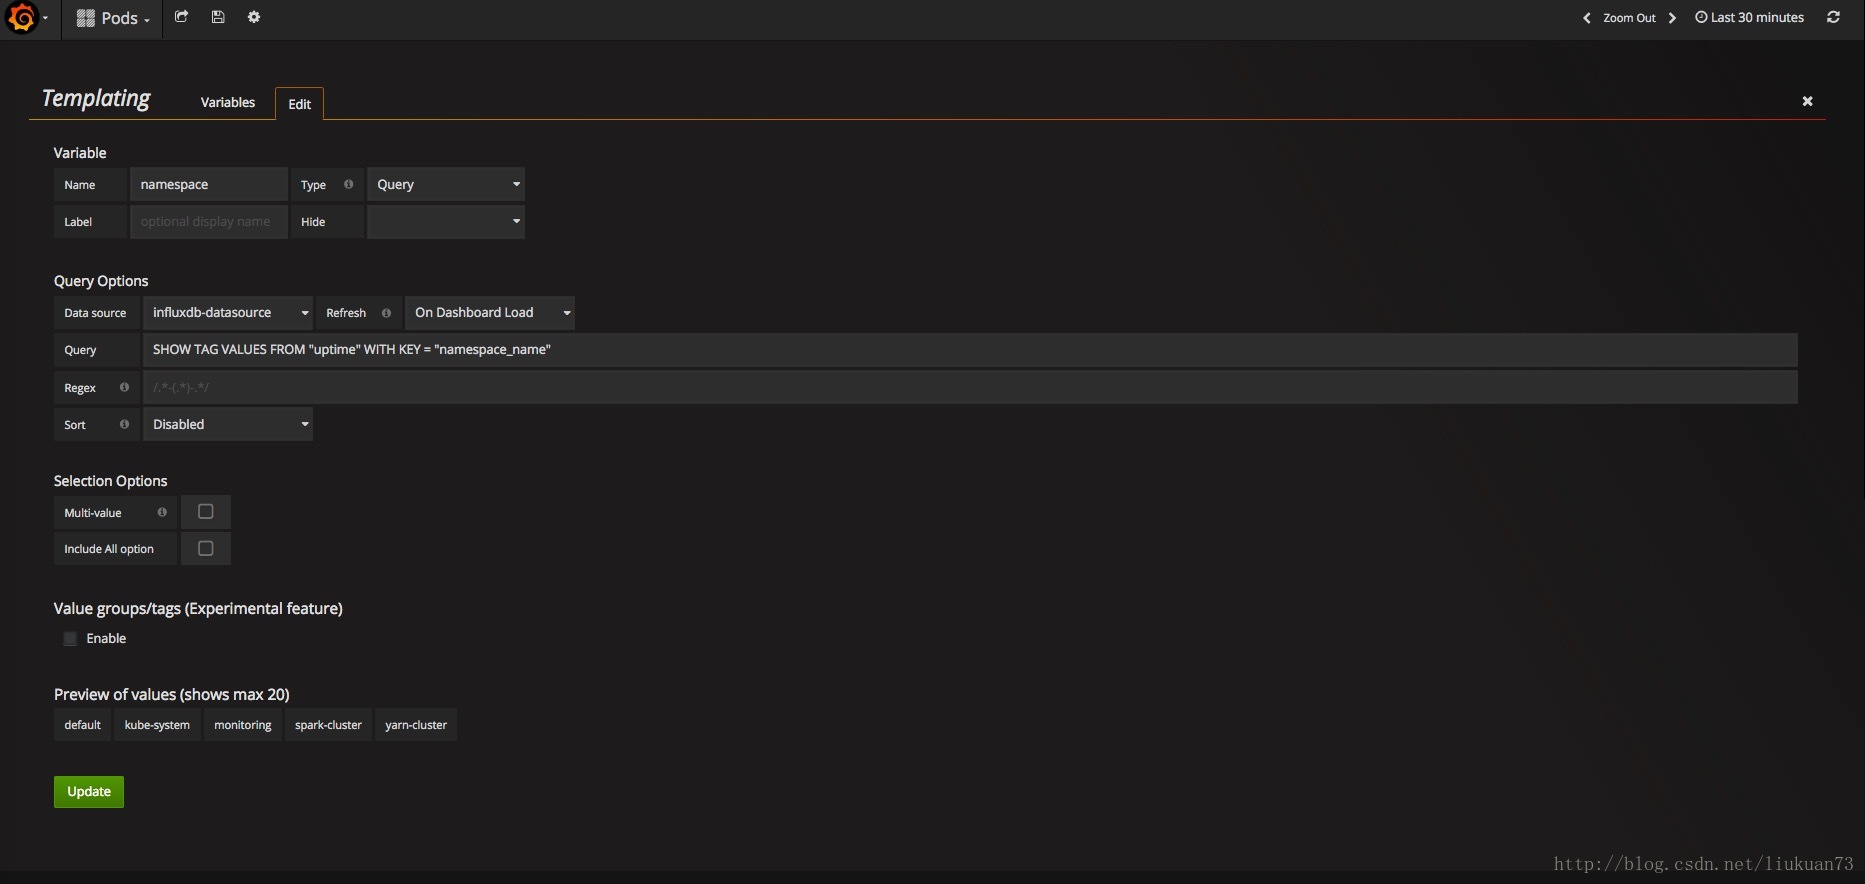
在安装好 Grafana 之后我们使用的是默认的 template 配置,页面上的 namespace 选择里只有 default 和 kube-system,并不是说其他的 namespace 里的指标没有得到监控,只是我们没有在 Grafana 中开启他它们的显示而已。见 Cannot see other namespaces except, kube-system and default #1279。
修改grafana模板
将 Templating 中的 namespace 的 Data source 设置为 influxdb-datasource,Refresh 设置为 on Dashboard Load 保存设置,刷新浏览器,即可看到其他 namespace 选项。
6.Heapster使用
这里主要介绍Heapster的API使用,及可获取的Metrics。
The Heapster Model is a structured representation of metrics for Kubernetes clusters, which is exposed through a set of REST API endpoints. It allows the extraction of up to 15 minutes of historical data for any Container, Pod, Node or Namespace in the cluster, as well as the cluster itself (depending on the metric).
API文档及可用Metrics在官方文档中都介绍的比较齐全。下面用几条测试命令来解释API使用:
- 获取支持的metrics:
curl -L http://10.142.21.21:30003/api/v1/model/metrics
    [
    "cpu/limit",
    "memory/request",
    "memory/limit",
    "cpu/usage_rate",
    "memory/usage",
    "cpu/request"
]- 1
- 2
- 3
- 4
- 5
- 6
- 7
- 8
- 9
- 列出某一个Node支持的metrics
curl -L http://10.142.21.21:30003/api/v1/model/nodes/k8smaster01/metrics- 1
- 查看对应Pod的cpu使用率
curl -L http://10.142.21.21:30003/api/v1/model/namespaces/<namespace-name>/pods/<pod-name>/metrics/cpu-usag- 1
参考:
1.https://jimmysong.io/kubernetes-handbook/practice/heapster-addon-installation.html
2.https://www.kubernetes.org.cn/932.html
参考资料:
API文档: https://github.com/kubernetes/heapster/blob/v1.5.0-beta.2/docs/model.md
注意,1.5.0版本开始,Heapster Model API已被deprecated了,使用这个:https://github.com/kubernetes/metricsheapster导出的所有Metrics: https://github.com/kubernetes/heapster/blob/master/docs/storage-schema.md


 5608
5608

 被折叠的 条评论
为什么被折叠?
被折叠的 条评论
为什么被折叠?
 到【灌水乐园】发言


