


Using C++ and WSL in VS Code
In this tutorial, you will configure Visual Studio Code to use the GCC C++ compiler (g++) and GDB debugger on Ubuntu in the Windows Subsystem for Linux (WSL). GCC stands for GNU Compiler Collection; GDB is the GNU debugger. WSL is a Linux environment within Windows that runs directly on the machine hardware, not in a virtual machine.
在本教程中,您将配置Visual Studio Code以在Windows Subsystem for Linux(WSL)中使用Ubuntu上的GCC C++编译器(g++)和GDB调试器。GCC代表GNU编译器集合; GDB是GNU调试器。WSL是Windows中的Linux环境,直接在机器硬件上运行,而不是在虚拟机中运行。
Note: Much of this tutorial is applicable to working with C++ and VS Code directly on a Linux machine.
注意:本教程的大部分内容适用于直接在Linux机器上使用C++和VS Code。
Visual Studio Code has support for working directly in WSL with the WSL extension. We recommend this mode of WSL development, where all your source code files, in addition to the compiler, are hosted on the Linux distro. For more background, see VS Code Remote Development.
Visual Studio Code支持使用WSL扩展直接在WSL中工作。我们推荐这种WSL开发模式,在这种模式下,除了编译器之外,所有的源代码文件都托管在Linux发行版上。有关更多背景信息,请参阅VS Code Remote Development。
After completing this tutorial, you will be ready to create and configure your own C++ project, and to explore the VS Code documentation for further information about its many features. This tutorial does not teach you about GCC or Linux or the C++ language. For those subjects, there are many good resources available on the Web.
完成本教程后,您将准备好创建和配置您自己的C++项目,并探索VS Code文档以获取更多有关其特性的信息。本教程不会教你GCC、Linux或C++语言。对于这些主题,网络上有很多很好的资源。
If you have any problems, feel free to file an issue for this tutorial in the VS Code documentation repository.
如果您有任何问题,请随时在VS Code文档存储库中提交本教程的问题。
Prerequisites 先决条件
To successfully complete this tutorial, you must do the following steps:
要成功完成本教程,必须执行以下步骤:
-
Install Visual Studio Code.
安装Visual Studio Code。 -
Install the WSL extension.
安装WSL扩展。 -
Install Windows Subsystem for Linux and then use the links on that same page to install your Linux distribution of choice. This tutorial uses Ubuntu. During installation, remember your Linux user password because you'll need it to install additional software.
安装Windows Subsystem for Linux,然后使用同一页上的链接安装您选择的Linux发行版。本教程使用Ubuntu。在安装过程中,记住Linux用户密码,因为您需要它来安装其他软件。
Set up your Linux environment设置Linux环境
-
Open the Bash shell for WSL. If you installed an Ubuntu distro, type "Ubuntu" in the Windows search box and then click on it in the result list. For Debian, type "Debian", and so on.
打开WSL的Bash shell。如果您安装了Ubuntu发行版,请在Windows搜索框中键入“Ubuntu”,然后在结果列表中单击它。对于Debian,键入“Debian”,以此类推。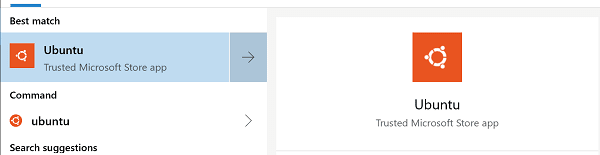
The shell appears with a command prompt that by default consists of your user name and computer name, and puts you in your home directory. For Ubuntu it looks like this:
shell将显示一个命令提示符,默认情况下该命令提示符包含您的用户名和计算机名,并将您置于主目录中。Ubuntu看起来像这样: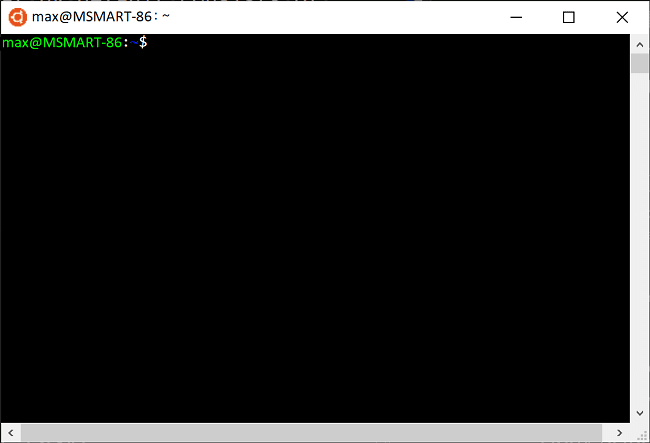
-
Make a directory called
projectsand then subdirectory under that calledhelloworld:
创建一个名为projects的目录,然后在名为helloworld的目录下创建子目录:mkdir projects mkdir helloworld -
Although you will be using VS Code to edit your source code, you'll be compiling the source code on Linux using the g++ compiler. You'll also debug on Linux using GDB. These tools are not installed by default on Ubuntu, so you have to install them. Fortunately, that task is quite easy!
虽然您将使用VS Code来编辑源代码,但您将使用g++编译器在Linux上编译源代码。您还将使用GDB在Linux上进行调试。这些工具默认情况下不会安装在Ubuntu上,所以你必须安装它们。幸运的是,这项任务相当容易! -
From the WSL command prompt, first run
apt-get updateto update the Ubuntu package lists. An out-of-date distro can sometimes interfere with attempts to install new packages.
在WSL命令提示符下,首先运行apt-get update更新Ubuntu软件包列表。过时的发行版有时会干扰安装新软件包的尝试。sudo apt-get updateIf you like, you can run
sudo apt-get update && sudo apt-get dist-upgradeto also download the latest versions of the system packages, but this can take significantly longer depending on your connection speed.
如果您愿意,您可以运行sudo apt-get update && sudo apt-get dist-upgrade来下载最新版本的系统包,但这可能需要更长的时间,具体取决于您的连接速度。 -
From the command prompt, install the GNU compiler tools and the GDB debugger by typing:
在命令提示符下,键入以下命令来安装GNU编译器工具和GDB调试器:sudo apt-get install build-essential gdb -
Verify that the install succeeded by locating g++ and gdb. If the filenames are not returned from the
whereiscommand, try running the update command again.
通过定位g++和gdb验证安装是否成功。如果whereis命令未返回文件名,请再次尝试运行update命令。whereis g++ whereis gdb
Note: The setup steps for installing the g++ compiler and GDB debugger apply if you are working directly on a Linux machine rather than in WSL. Running VS Code in your helloworld project, as well as the editing, building, and debugging steps are the same.
注意:如果您直接在Linux机器上工作,而不是在WSL中工作,则适用安装g++编译器和GDB调试器的设置步骤。在helloworld项目中运行VS Code以及编辑、构建和调试步骤都是相同的。
Run VS Code in WSL在WSL中运行VS代码
Navigate to your helloworld project folder and launch VS Code from the WSL terminal with code .:
导航到您的helloworld项目文件夹,并从WSL终端启动VS Code,使用 code . :
cd $HOME/projects/helloworld
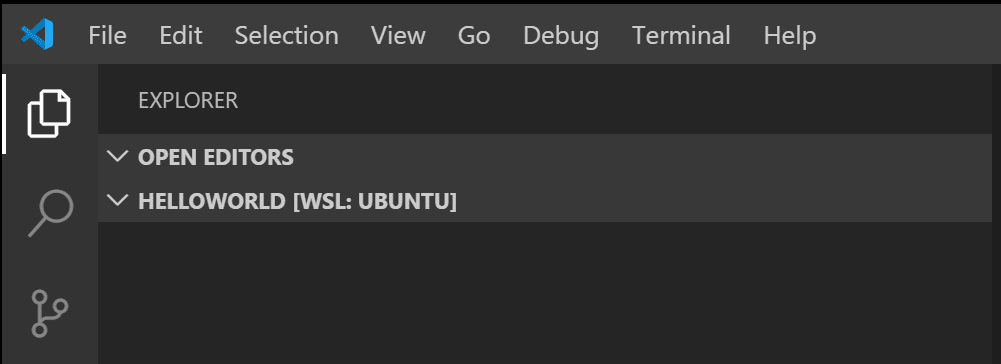
code .You'll see a message about "Installing VS Code Server". VS Code is downloading and installing a small server on the Linux side that the desktop VS Code will then talk to. VS Code will then start and open the helloWorld folder. The File Explorer shows that VS Code is now running in the context of WSL with the title bar WSL: Ubuntu.
您将看到一条关于“安装VS代码服务器”的消息。VS Code正在Linux端下载并安装一个小型服务器,桌面VS Code将与之对话。VS Code将启动并打开 helloWorld 文件夹。文件资源管理器显示VS Code现在正在WSL上下文中运行,标题栏为WSL:Ubuntu
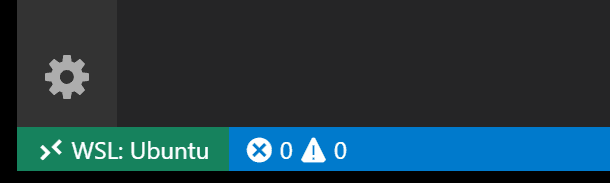
You can also tell the remote context from the Status bar.
您还可以从状态栏中了解远程上下文。
If you click on the Remote Status bar item, you will see a dropdown of Remote commands appropriate for the session. For example, if you want to end your session running in WSL, you can select the Close Remote Connection command from the dropdown. Running code . from your WSL command prompt will restart VS Code running in WSL.
如果您单击远程状态栏项,您将看到适合会话的远程命令的下拉列表。例如,如果您想结束在WSL中运行的会话,可以从下拉列表中选择Close Remote Connection命令。从WSL命令提示符运行 code . 将重新启动在WSL中运行的VS Code。
The code . command opened VS Code in the current working folder, which becomes your "workspace". As you go through the tutorial, you will see three files created in a .vscode folder in the workspace:
密码命令在当前工作文件夹中打开VS Code,该文件夹将成为您的“工作区”。在学习本教程时,您将看到在工作区的 .vscode 文件夹中创建了三个文件:
c_cpp_properties.json(compiler path and IntelliSense settings)c_cpp_properties.json(编译器路径和IntelliSense设置)tasks.json(build instructions)tasks.json(构建说明)launch.json(debugger settings)launch.json(调试器设置)
Add a source code file添加源代码文件
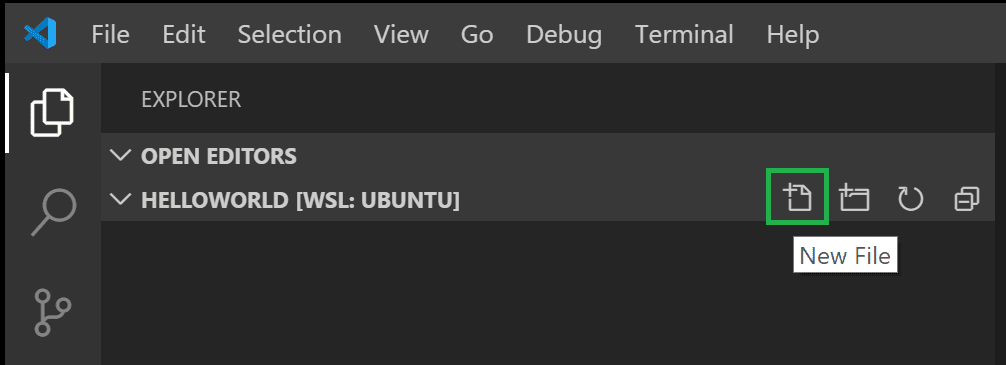
In the File Explorer title bar, select the New File button and name the file helloworld.cpp.
在“文件资源管理器”标题栏中,选择“新建文件”按钮并将文件命名为 helloworld.cpp 。
Install the C/C++ extension安装C/C++扩展
Once you create the file and VS Code detects it is a C++ language file, you may be prompted to install the Microsoft C/C++ extension if you don't already have it installed.
一旦您创建了文件并且VS Code检测到它是一个C++语言文件,如果您尚未安装Microsoft C/C++扩展,则可能会提示您安装该扩展。

Choose Install and then Reload Required when the button is displayed in the Extensions view to complete installing the C/C++ extension.
在Extensions视图中显示按钮时,选择Install,然后选择Reload Required以完成C/C++扩展的安装。
If you already have C/C++ language extensions installed locally in VS Code, you'll need to go to the Extensions view (Ctrl+Shift+X) and install those extensions into WSL. Locally installed extensions can be installed into WSL by selecting the Install in WSL button and then Reload Required.
如果您已经在VS Code中本地安装了C/C++语言扩展,则需要转到扩展视图(Ctrl+Shift+X)并将这些扩展安装到WSL中。通过选择Install in WSL按钮,然后选择Reload Required,可以将本地安装的扩展安装到WSL中。

Add hello world source code添加hello world源代码
Now paste in this source code:
现在粘贴以下源代码:
#include <iostream>
#include <vector>
#include <string>
using namespace std;
int main()
{
vector<string> msg {"Hello", "C++", "World", "from", "VS Code", "and the C++ extension!"};
for (const string& word : msg)
{
cout << word << " ";
}
cout << endl;
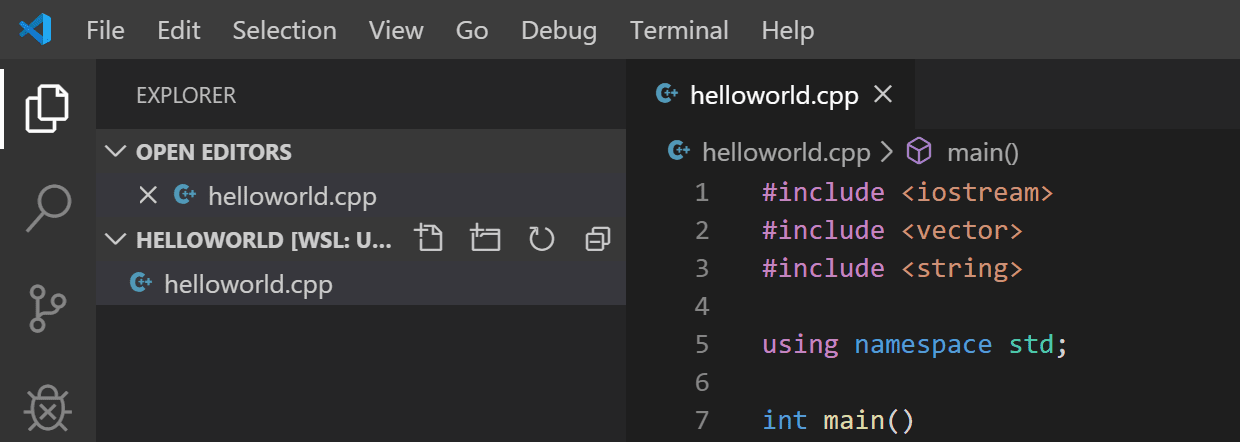
}Now press Ctrl+S to save the file. Notice how the file you just added appears in the File Explorer view (Ctrl+Shift+E) in the side bar of VS Code:
现在按Ctrl+S保存文件。请注意,您刚刚添加的文件如何显示在VS Code侧栏的文件资源管理器视图(Ctrl+Shift+E)中:
You can also enable Auto Save to automatically save your file changes, by checking Auto Save in the main File menu.
您还可以启用自动保存功能,通过选中主文件菜单中的自动保存来自动保存文件更改。
The Activity Bar on the far left lets you open different views such as Search, Source Control, and Run. You'll look at the Run view later in this tutorial. You can find out more about the other views in the VS Code User Interface documentation.
最左侧的活动栏允许您打开不同的视图,例如“搜索”、“源代码管理”和“运行”。在本教程的后面部分,您将看到Run视图。您可以在VS代码用户界面文档中找到有关其他视图的更多信息。
Explore IntelliSense 探索智能感知
In your new helloworld.cpp file, hover over vector or string to see type information. After the declaration of the msg variable, start typing msg. as you would when calling a member function. You should immediately see a completion list that shows all the member functions, and a window that shows the type information for the msg object:
在新的 helloworld.cpp 文件中,将鼠标悬停在 vector 或 string 上以查看类型信息。在声明了 msg 变量之后,开始像调用成员函数时一样键入 msg. 。您应该立即看到一个显示所有成员函数的完成列表,以及一个显示 msg 对象的类型信息的窗口:
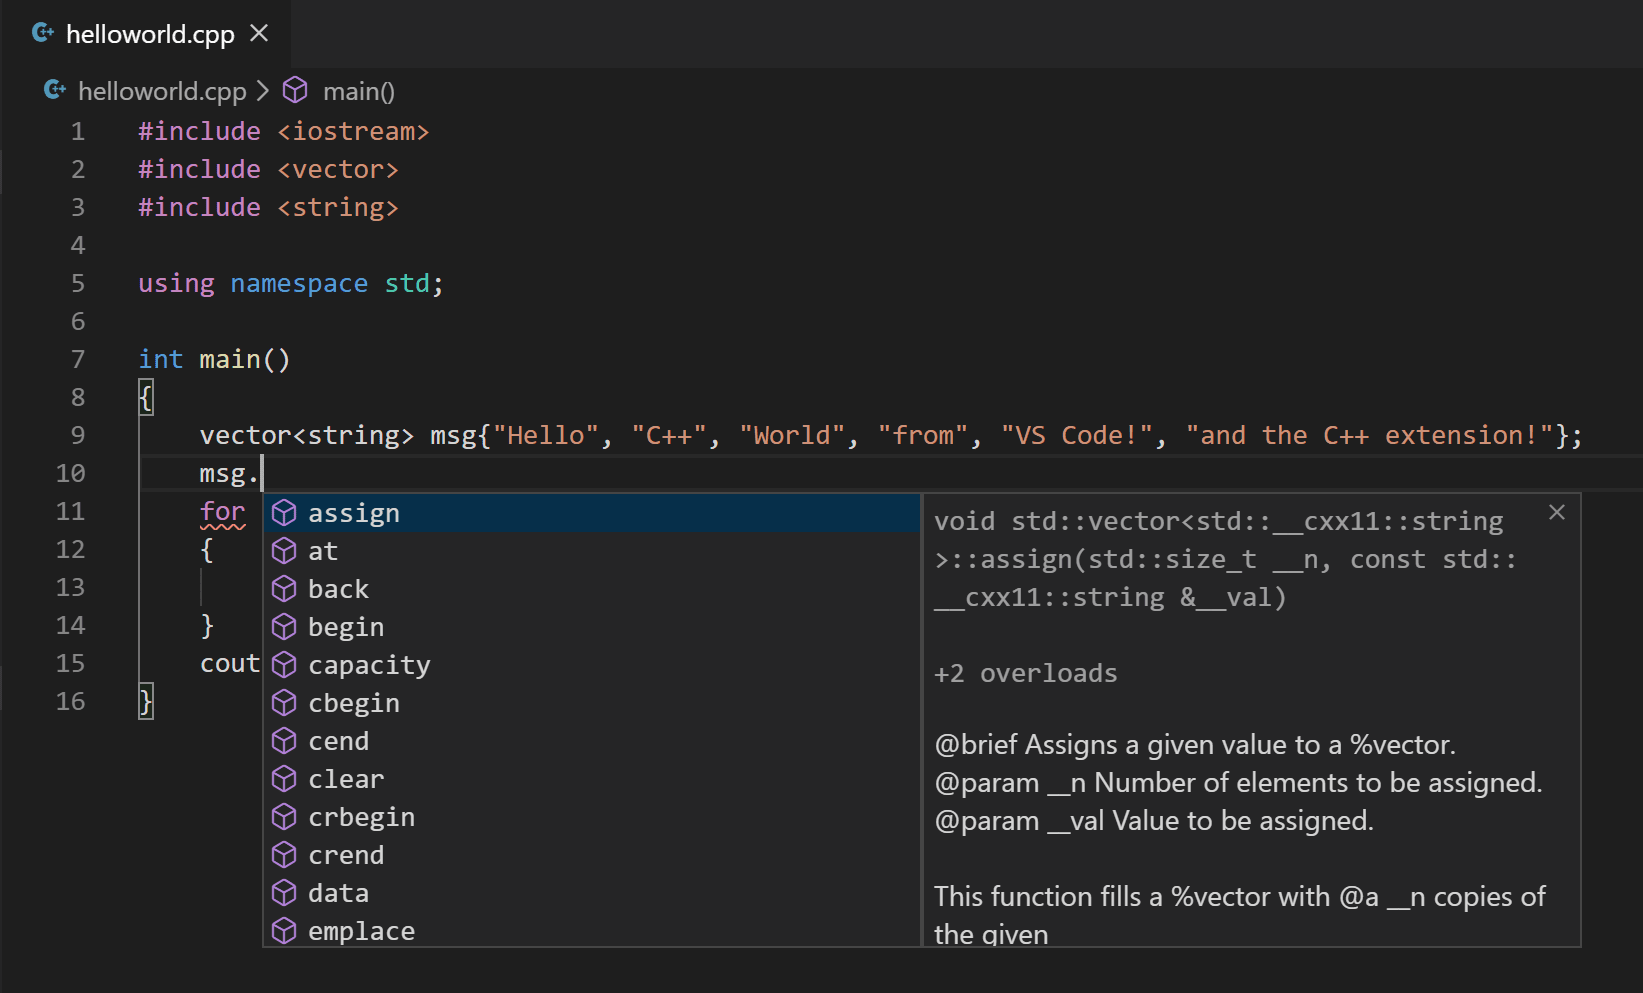
You can press the Tab key to insert the selected member; then, when you add the opening parenthesis, you will see information about any arguments that the function requires.
您可以按Tab键插入所选成员;然后,当你添加左括号时,你将看到关于函数所需的任何参数的信息。
Run helloworld.cpp 运行helloworld.cpp
Remember, the C++ extension uses the C++ compiler you have installed on your machine to build your program. Make sure you have a C++ compiler installed before attempting to run and debug helloworld.cpp in VS Code.
请记住,C++扩展使用您在机器上安装的C++编译器来构建程序。在VS Code中运行和调试 helloworld.cpp 之前,请确保安装了C++编译器。
-
Open
helloworld.cppso that it is the active file.
打开helloworld.cpp,使其成为活动文件。 -
Press the play button in the top right corner of the editor.
按编辑器右上角的播放按钮。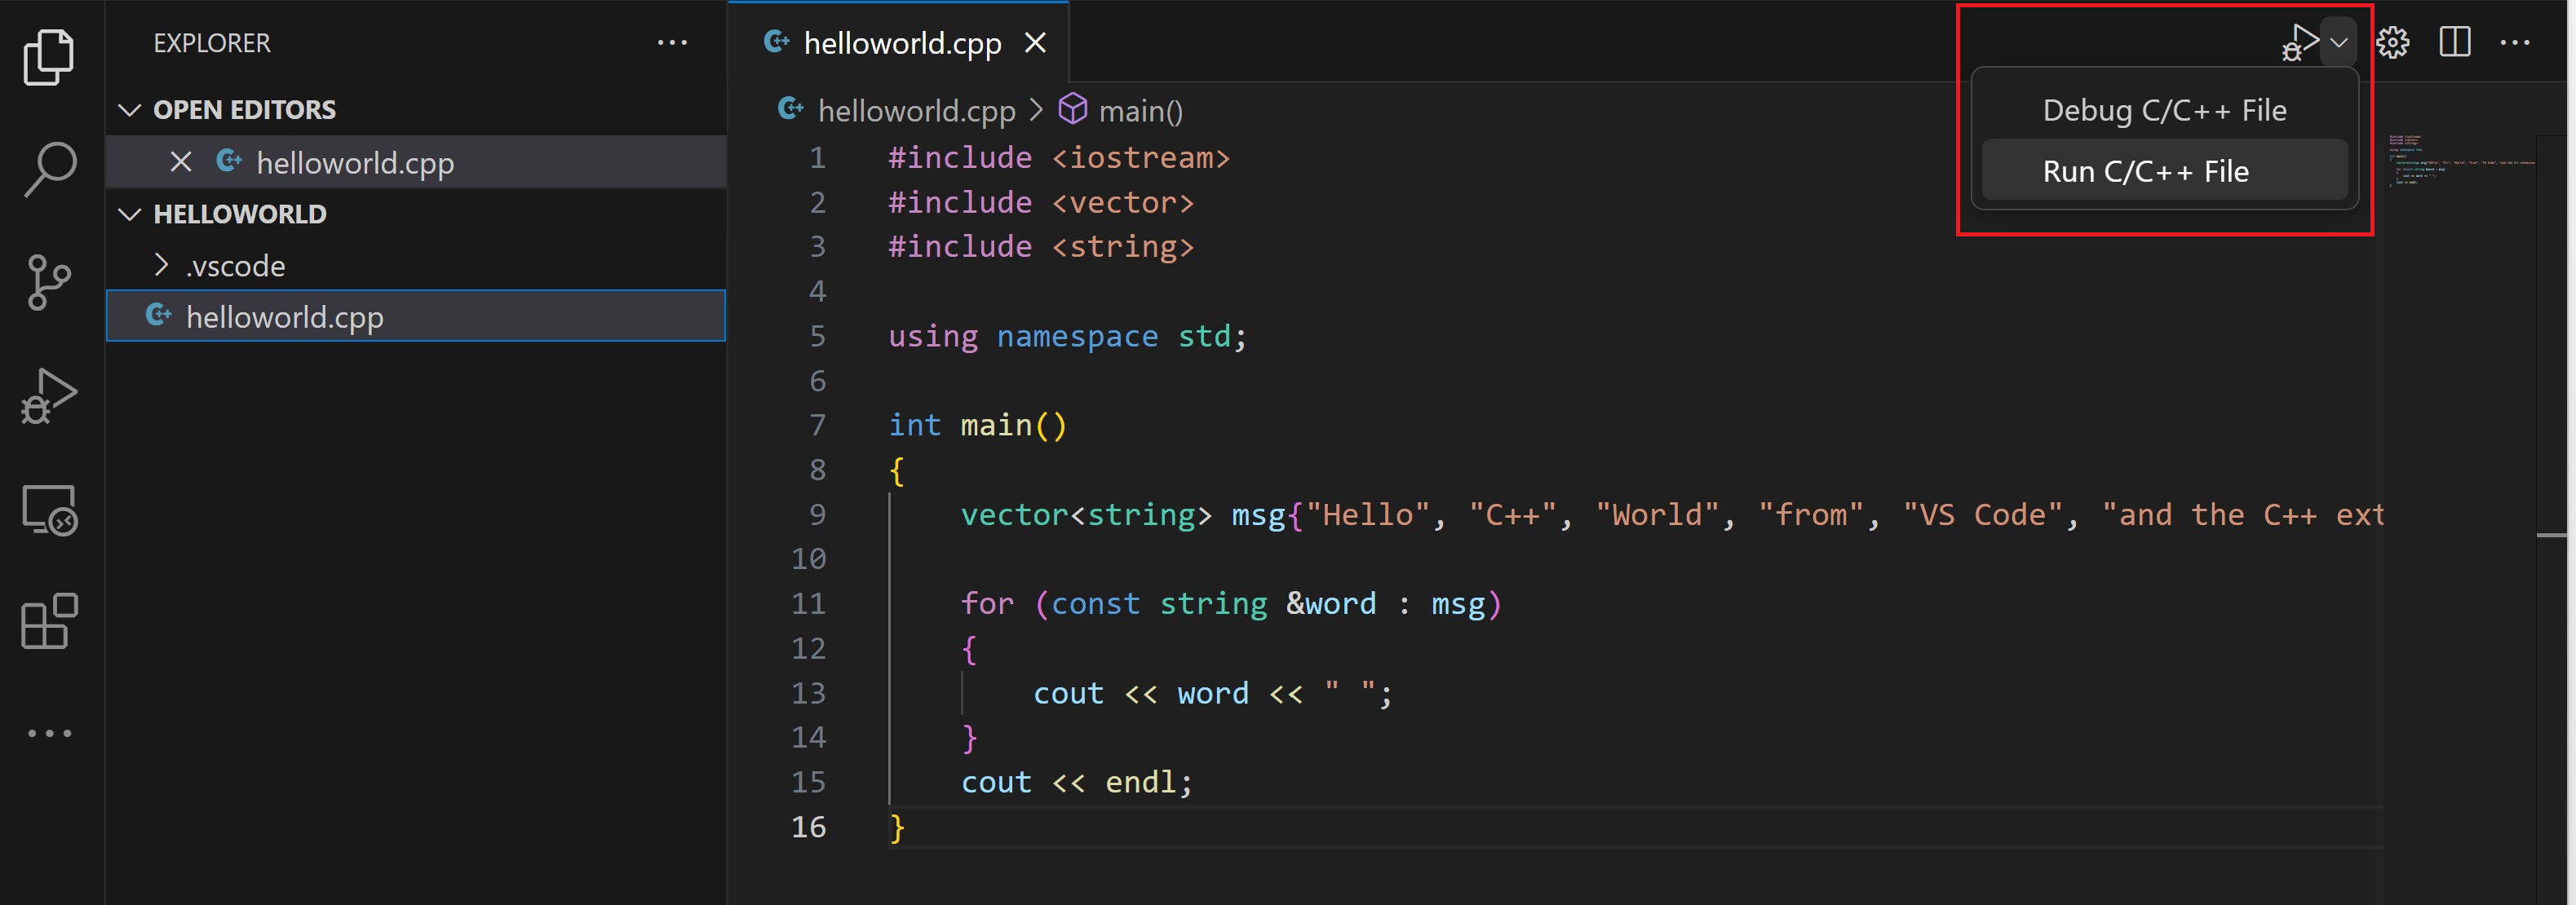
-
Choose g++ build and debug active file from the list of detected compilers on your system.
从系统上检测到的编译器列表中选择g++ build and debug active file。
You'll only be asked to choose a compiler the first time you run helloworld.cpp. This compiler will be set as the "default" compiler in tasks.json file.
只有在您第一次运行 helloworld.cpp 时才会要求您选择一个编译器。此编译器将被设置为 tasks.json 文件中的“默认”编译器。
-
After the build succeeds, your program's output will appear in the integrated Terminal.
构建成功后,程序的输出将出现在集成终端中。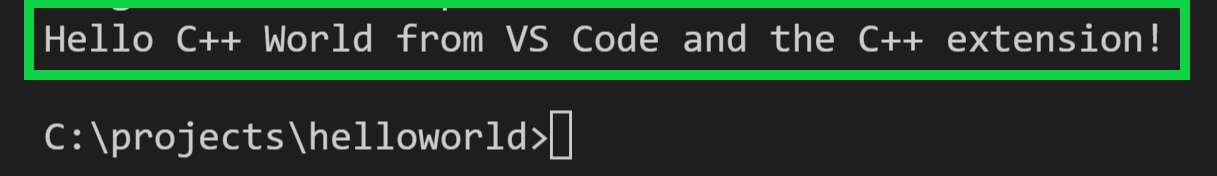
The first time you run your program, the C++ extension creates tasks.json, which you'll find in your project's .vscode folder. tasks.json stores build configurations.
第一次运行程序时,C++扩展会创建 tasks.json ,您可以在项目的 .vscode 文件夹中找到它。 tasks.json 存储构建配置。
Your new tasks.json file should look similar to the JSON below:
新的 tasks.json 文件应该与下面的JSON类似:
{
  "version": "2.0.0",
  "tasks": [
    {
      "type": "shell",
      "label": "C/C++: g++ build active file",
      "command": "/usr/bin/g++",
      "args": ["-g", "${file}", "-o", "${fileDirname}/${fileBasenameNoExtension}"],
      "options": {
        "cwd": "/usr/bin"
      },
      "problemMatcher": ["$gcc"],
      "group": {
        "kind": "build",
        "isDefault": true
      },
      "detail": "Task generated by Debugger."
    }
  ]
}Note: You can learn more about
tasks.jsonvariables in the variables reference.
注:您可以在变量参考中了解更多关于tasks.json变量的信息。
The command setting specifies the program to run; in this case that is g++. The args array specifies the command-line arguments that will be passed to g++. These arguments must be specified in the order expected by the compiler.command 设置指定要运行的程序;在这种情况下是g++。 args 数组指定将传递给g++的命令行参数。这些参数必须按照编译器预期的顺序指定。
This task tells g++ to take the active file (${file}), compile it, and create an executable file in the current directory (${fileDirname}) with the same name as the active file but without an extension (${fileBasenameNoExtension}), resulting in helloworld for our example.
这个任务告诉g++获取活动文件( ${file} ),编译它,并在当前目录( ${fileDirname} )中创建一个与活动文件同名但没有扩展名( ${fileBasenameNoExtension} )的可执行文件,从而在我们的示例中生成 helloworld 。
The label value is what you will see in the tasks list; you can name this whatever you like.label 值是您将在任务列表中看到的值;你可以随便给它起名字
The detail value is what you will as the description of the task in the tasks list. It's highly recommended to rename this value to differentiate it from similar tasks.detail 值是您将在任务列表中作为任务描述的值。强烈建议重命名此值,以将其与类似任务区分开来。
From now on, the play button will read from tasks.json to figure out how to build and run your program. You can define multiple build tasks in tasks.json, and whichever task is marked as the default will be used by the play button. In case you need to change the default compiler, you can run Tasks: Configure default build task. Alternatively you can modify the tasks.json file and remove the default by replacing this segment:
从现在开始,播放按钮将从 tasks.json 读取,以确定如何构建和运行您的程序。您可以在 tasks.json 中定义多个构建任务,任何被标记为默认的任务都将被播放按钮使用。如果需要更改默认编译器,可以运行Tasks:配置默认生成任务。或者,您可以修改 tasks.json 文件,并通过替换此段来删除默认值:
    "group": {
        "kind": "build",
        "isDefault": true
    },
with this: 用这个:
"group": "build",Modifying tasks.json 修改tasks.json
You can modify your tasks.json to build multiple C++ files by using an argument like "${workspaceFolder}/*.cpp" instead of ${file}.This will build all .cpp files in your current folder. You can also modify the output filename by replacing "${fileDirname}/${fileBasenameNoExtension}" with a hard-coded filename (for example 'helloworld.out').
你可以修改你的 tasks.json 来构建多个C++文件,方法是使用一个参数,比如 "${workspaceFolder}/*.cpp" 而不是 ${file} 。这将在你当前的文件夹中构建所有的 .cpp 文件。您还可以修改输出文件名,将 "${fileDirname}/${fileBasenameNoExtension}" 替换为硬编码的文件名(例如'helloworld.out')。
Debug helloworld.cpp 调试helloworld.cpp
To debug your code,
要调试代码,
- Go back to
helloworld.cppso that it is the active file.
返回到helloworld.cpp,使其成为活动文件。 - Set a breakpoint by clicking on the editor margin or using F9 on the current line.
通过单击编辑器边距或在当前行上使用F9设置断点。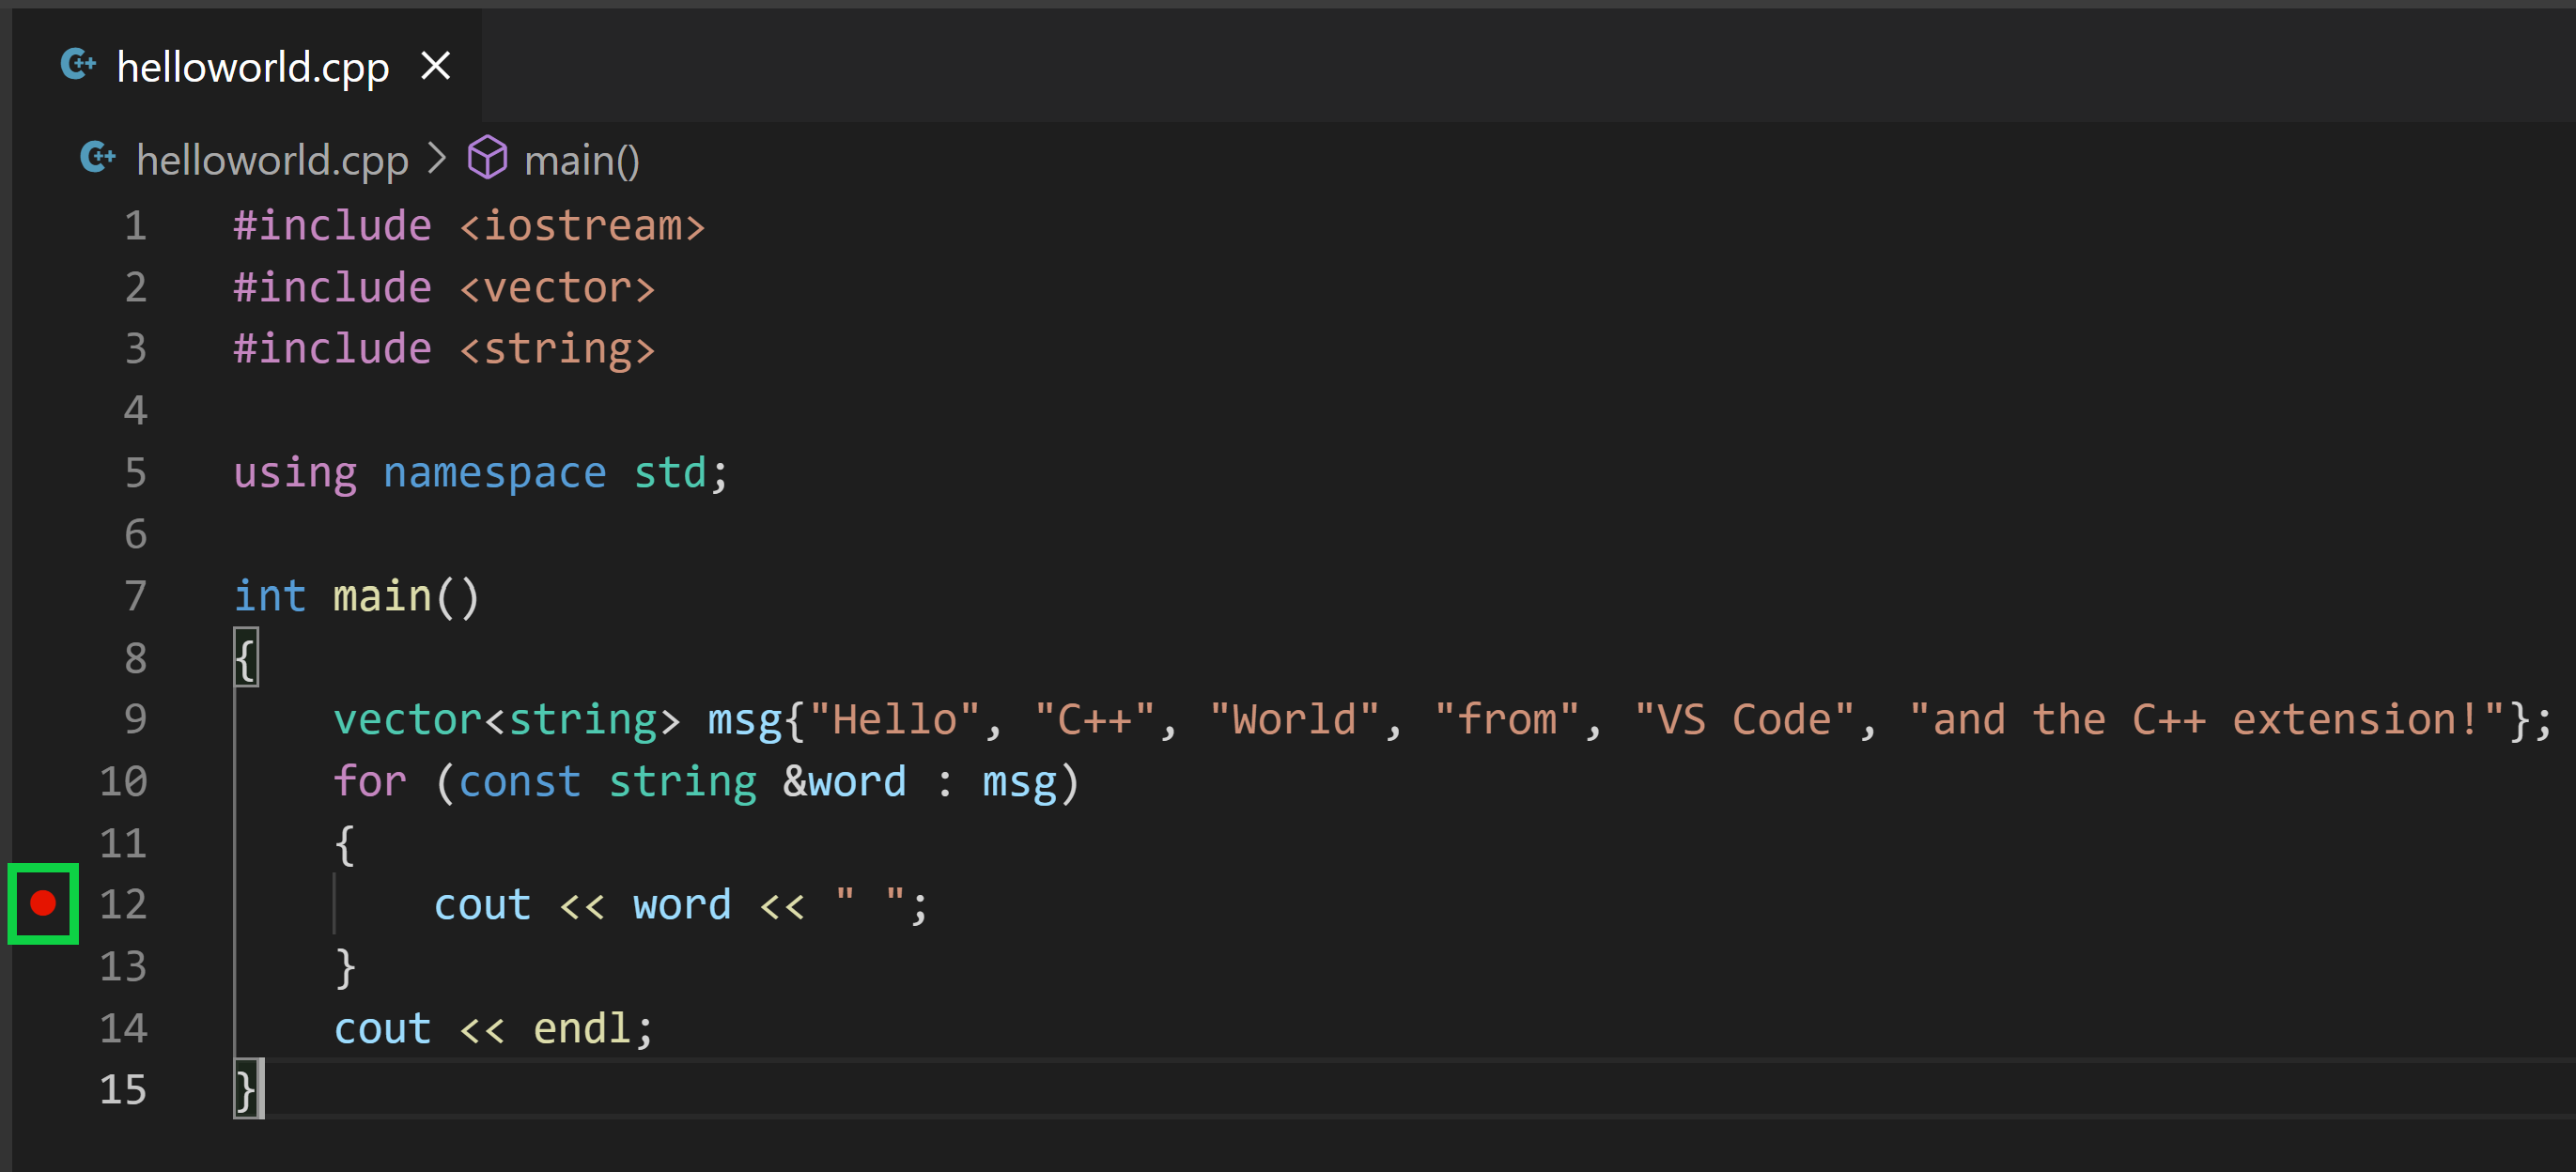
- From the drop-down next to the play button, select Debug C/C++ File.
从“播放”按钮旁边的下拉列表中,选择“调试C/C++文件”。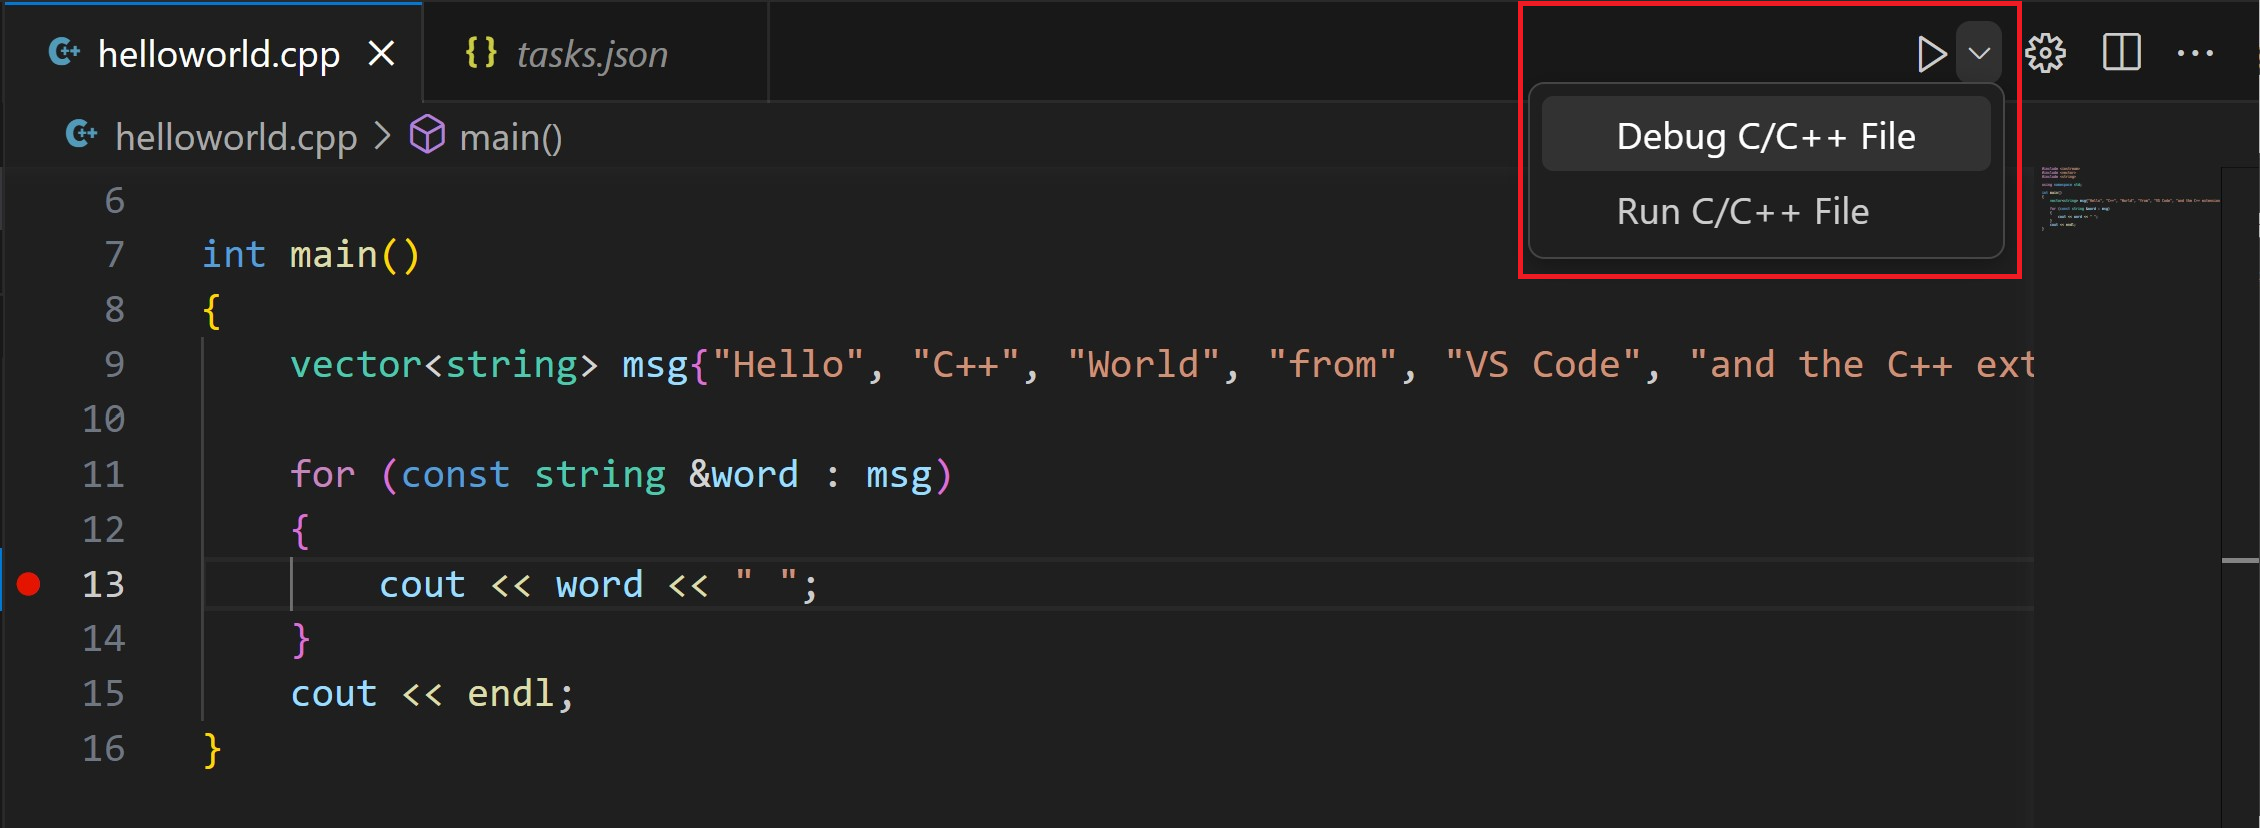
- Choose C/C++: g++ build and debug active file from the list of detected compilers on your system (you'll only be asked to choose a compiler the first time you run ordebug
helloworld.cpp).
选择C/C++:g++从系统上检测到的编译器列表中构建和调试活动文件(只有在第一次运行ordebughelloworld.cpp时才会要求您选择一个编译器)。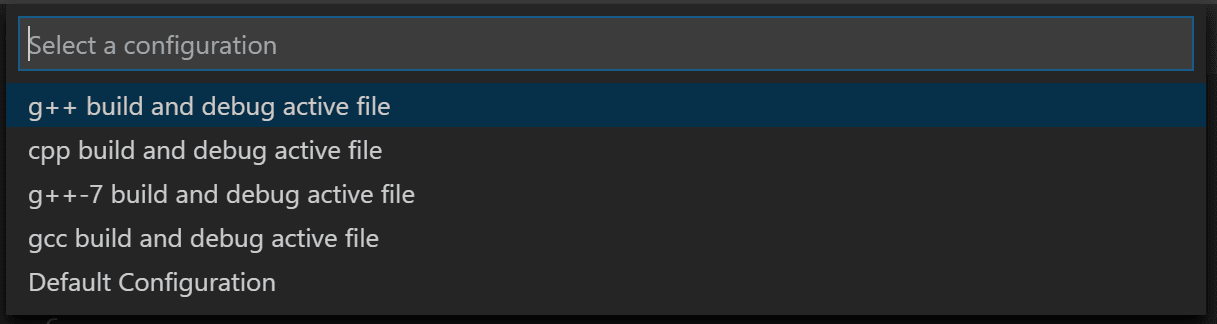
The play button has two modes: Run C/C++ File and Debug C/C++ File. It will default to the last-used mode. If you see the debug icon in the play button, you can select the play button to debug, instead of selecting the drop-down menu item.
播放按钮有两种模式:运行C/C++文件并调试C/C++文件。它将默认为上次使用的模式。如果在播放按钮中看到调试图标,则可以选择播放按钮进行调试,而不是选择下拉菜单项。
Explore the debugger 浏览调试器
Before you start stepping through the code, let's take a moment to notice several changes in the user interface:
在开始逐步浏览代码之前,让我们花点时间注意一下用户界面中的几个变化:
-
The Integrated Terminal appears at the bottom of the source code editor. In the Debug Output tab, you see output that indicates the debugger is up and running.
集成终端出现在源代码编辑器的底部。在“调试输出”选项卡中,您可以看到指示调试器已启动并正在运行的输出。 -
The editor highlights line 12, which is a breakpoint that you set before starting the debugger:
编辑器突出显示第12行,这是您在启动调试器之前设置的断点: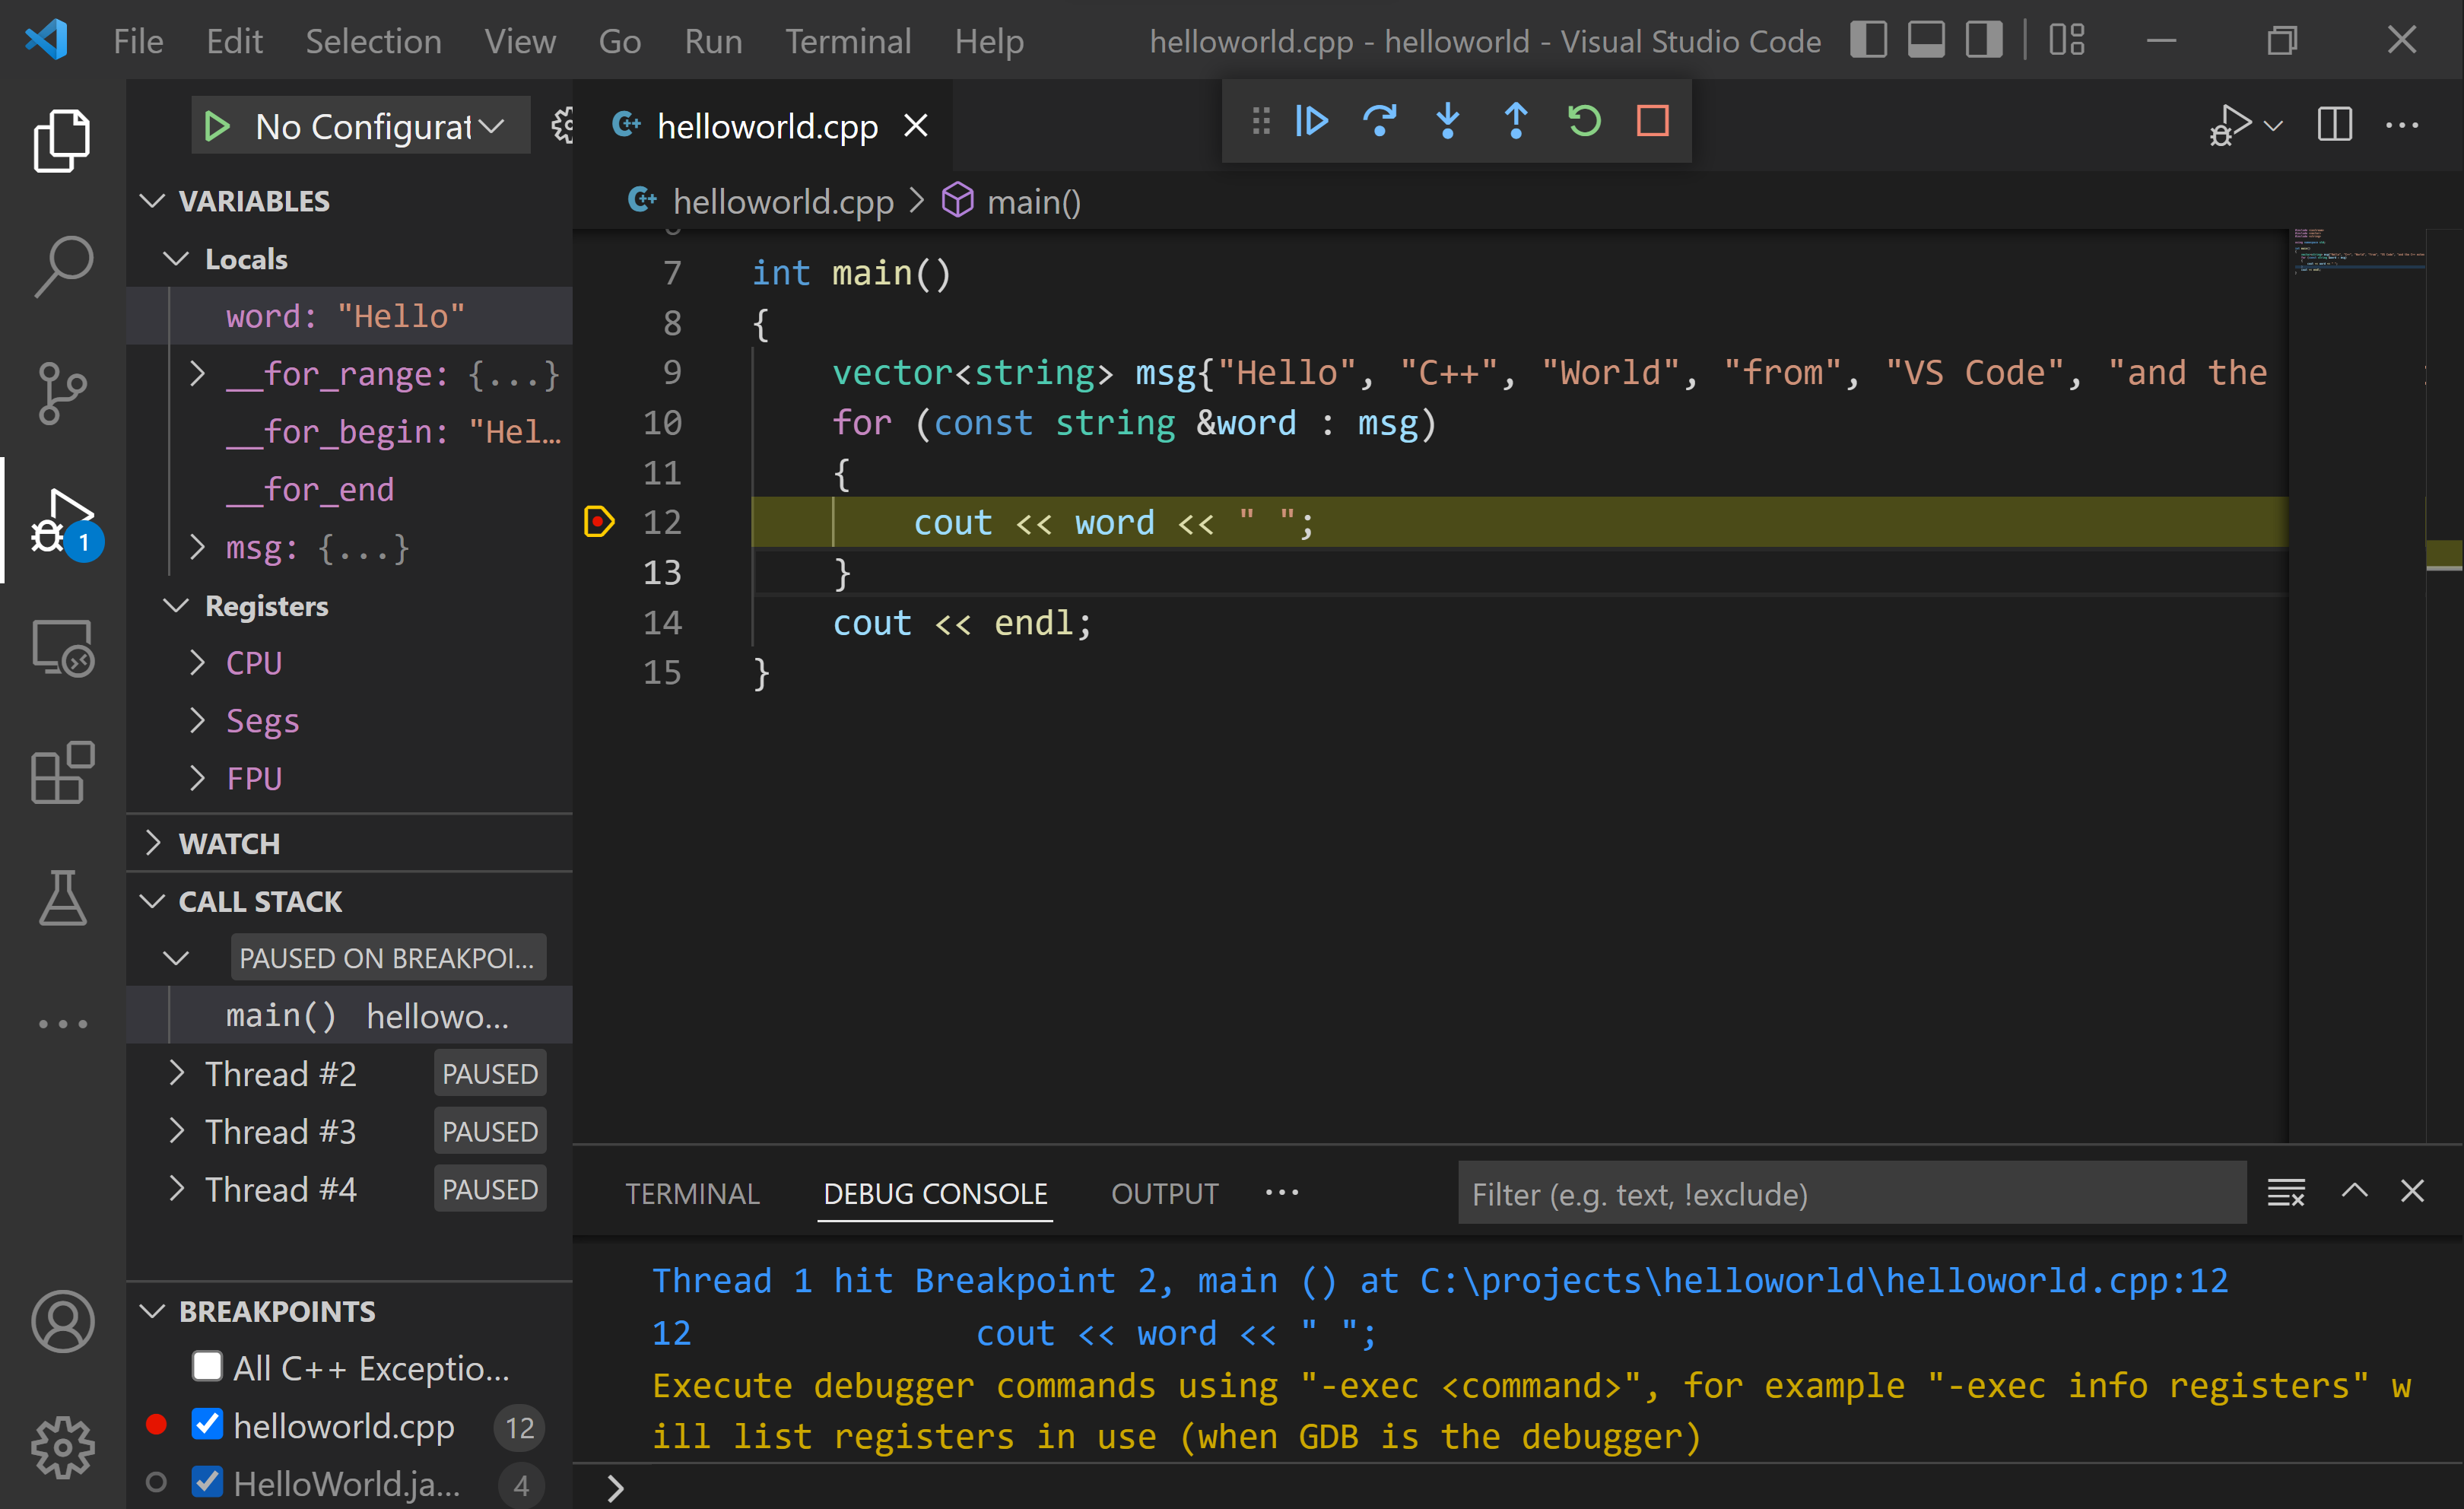
-
The Run and Debug view on the left shows debugging information. You'll see an example later in the tutorial.
左侧的Run and Debug视图显示调试信息。您将在本教程后面看到一个示例。 -
At the top of the code editor, a debugging control panel appears. You can move this around the screen by grabbing the dots on the left side.
在代码编辑器的顶部,将显示调试控制面板。你可以通过抓住左边的点来在屏幕上移动它。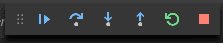
If you already have a launch.json file in your workspace, the play button will read from it when figuring out how run and debug your C++ file. If you don’t have launch.json, the play button will create a temporary “quick debug” configuration on the fly, eliminating the need for launch.json altogether!
如果您的工作区中已经有一个launch.json文件,那么在确定如何运行和调试您的C++文件时,播放按钮将从中读取。如果你没有launch.json,播放按钮会创建一个临时的“快速调试”配置,完全不需要launch.json!
Step through the code单步执行代码
Now you're ready to start stepping through the code.
现在您已经准备好开始逐步执行代码了。
-
Click or press the Step over icon in the debugging control panel.
单击或按调试控制面板中的Step over图标。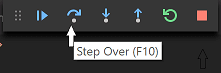
This will advance program execution to the first line of the for loop, and skip over all the internal function calls within the
vectorandstringclasses that are invoked when themsgvariable is created and initialized. Notice the change in the Variables window on the side.
这将使程序执行提前到for循环的第一行,并跳过在创建和初始化msg变量时调用的vector和string类中的所有内部函数调用。请注意侧面的Variables窗口中的更改。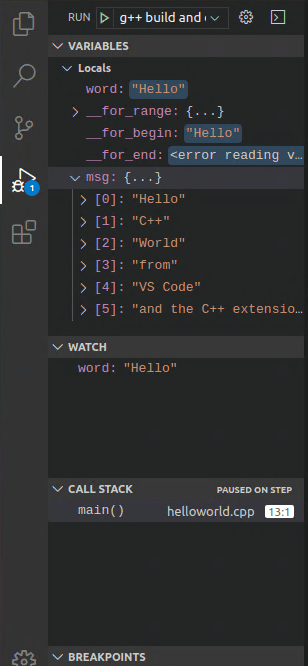
-
Press Step over again to advance to the next statement in this program (skipping over all the internal code that is executed to initialize the loop). Now, the Variables window shows information about the loop variables.
再次按Step over键以前进到该程序中的下一条语句(跳过为初始化循环而执行的所有内部代码)。现在,Variables窗口显示有关循环变量的信息。 -
Press Step over again to execute the
coutstatement. (Note that as of the March 2019 release, the C++ extension does not print any output to the Debug Console until the last cout executes.)
再次按Step over执行cout语句。(Note自2019年3月发布以来,C++扩展不会将任何输出打印到Debug Console,直到最后一次cout执行。 -
If you like, you can keep pressing Step over until all the words in the vector have been printed to the console. But if you are curious, try pressing the Step Into button to step through source code in the C++ standard library!
如果您愿意,您可以一直按Step over,直到矢量中的所有单词都打印到控制台。但是如果你好奇,试着按下Step Into按钮来单步浏览C++标准库中的源代码!
To return to your own code, one way is to keep pressing Step over. Another way is to set a breakpoint in your code by switching to the
helloworld.cpptab in the code editor, putting the insertion point somewhere on thecoutstatement inside the loop, and pressing F9. A red dot appears in the gutter on the left to indicate that a breakpoint has been set on this line.
要返回到您自己的代码,一种方法是不断按Step over。另一种方法是在代码中设置断点,方法是切换到代码编辑器中的helloworld.cpp选项卡,将插入点放在循环内的cout语句上的某个位置,然后按F9。左边的边栏中会出现一个红点,表示该行已设置断点。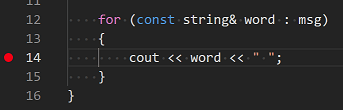
Then press F5 to start execution from the current line in the standard library header. Execution will break on
cout. If you like, you can press F9 again to toggle off the breakpoint.
然后按F5从标准库标题中的当前行开始执行。执行将在cout中断。如果愿意,可以再次按F9键关闭断点。When the loop has completed, you can see the output in the Debug Console tab of the integrated terminal, along with some other diagnostic information that is output by GDB.
循环完成后,您可以在集成终端的DebugConsole选项卡中看到输出,沿着GDB输出的一些其他诊断信息。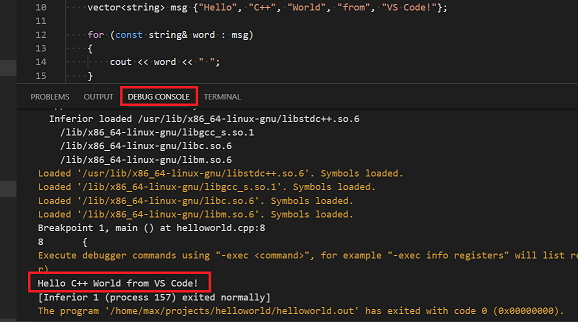
Set a watch 设置监视
To keep track of the value of a variable as your program executes, set a watch on the variable.
要在程序执行时跟踪变量的值,请对该变量设置监视。
-
Place the insertion point inside the loop. In the Watch window, click the plus sign and in the text box, type
word, which is the name of the loop variable. Now view the Watch window as you step through the loop.
将插入点放置在循环内。在“监视”窗口中,单击加号,然后在文本框中键入word,这是循环变量的名称。现在,在遍历循环时查看“监视”窗口。
-
To quickly view the value of any variable while execution is paused on a breakpoint, you can hover over it with the mouse pointer.
若要在断点处暂停执行时快速查看任何变量的值,可以将鼠标指针悬停在该变量上。
Next, you'll create a tasks.json file to tell VS Code how to build (compile) the program. This task will invoke the g++ compiler to create an executable file from the source code.
接下来,您将创建一个 tasks.json 文件来告诉VS Code如何构建(编译)程序。这个任务将调用g++编译器从源代码创建一个可执行文件。
It's important to have helloworld.cpp open in the editor because the next step uses the active file in the editor for context to create the build task in the next step.
在编辑器中打开 helloworld.cpp 非常重要,因为下一步将使用编辑器中的活动文件作为上下文来创建下一步中的构建任务。
Customize debugging with launch.json使用launch.json自定义调试
When you debug with the play button or F5, the C++ extension creates a dynamic debug configuration on the fly.
当您使用播放按钮或F5进行调试时,C++扩展会动态创建一个调试配置。
There are cases where you'd want to customize your debug configuration, such as specifying arguments to pass to the program at runtime. You can define custom debug configurations in a launch.json file.
在某些情况下,您可能需要自定义调试配置,例如指定要在运行时传递给程序的参数。您可以在 launch.json 文件中定义自定义调试配置。
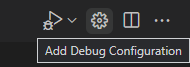
To create launch.json, choose Add Debug Configuration from the play button drop-down menu.
要创建 launch.json ,请从播放按钮下拉菜单中选择添加调试配置。
You'll then see a dropdown for various predefined debugging configurations. Choose g++ build and debug active file.
然后,您将看到一个下拉列表,显示各种预定义的调试配置。选择g++构建并调试活动文件。

VS Code creates a launch.json file, which looks something like this:
VS Code创建了一个 launch.json 文件,看起来像这样:
{
  "version": "0.2.0",
  "configurations": [
    {
      "name": "C/C++: g++ build and debug active file",
      "type": "cppdbg",
      "request": "launch",
      "program": "${fileDirname}/${fileBasenameNoExtension}",
      "args": [],
      "stopAtEntry": false,
      "cwd": "${workspaceFolder}",
      "environment": [],
      "externalConsole": false,
      "MIMode": "gdb",
      "miDebuggerPath": "/usr/bin/gdb",
      "setupCommands": [
        {
          "description": "Enable pretty-printing for gdb",
          "text": "-enable-pretty-printing",
          "ignoreFailures": true
        }
      ],
      "preLaunchTask": "C/C++: g++ build active file"
    }
  ]
}
In the JSON above, program specifies the program you want to debug. Here it is set to the active file folder ${fileDirname} and active filename without an extension ${fileBasenameNoExtension}, which if helloworld.cpp is the active file will be helloworld. The args property is an array of arguments to pass to the program at runtime.
在上面的JSON中, program 指定了要调试的程序。这里,它被设置为活动文件夹 ${fileDirname} 和不带扩展名 ${fileBasenameNoExtension} 的活动文件名,如果 helloworld.cpp 是活动文件,则其将是 helloworld 。 args 属性是在运行时传递给程序的参数数组。
By default, the C++ extension won't add any breakpoints to your source code and the stopAtEntry value is set to false.
默认情况下,C++扩展不会向源代码添加任何断点,并且 stopAtEntry 值设置为 false 。
Change the stopAtEntry value to true to cause the debugger to stop on the main method when you start debugging.
将 stopAtEntry 值更改为 true ,以使调试器在开始调试时停止在 main 方法上。
From now on, the play button and F5 will read from your
launch.jsonfile when launching your program for debugging.
从现在开始,当启动程序进行调试时,播放按钮和F5将从您的launch.json文件中读取。
C/C++ configurations C/C++配置
If you want more control over the C/C++ extension, you can create a c_cpp_properties.json file, which will allow you to change settings such as the path to the compiler, include paths, C++ standard (default is C++17), and more.
如果你想对C/C++扩展有更多的控制,你可以创建一个 c_cpp_properties.json 文件,这将允许你更改设置,如编译器的路径,包含路径,C++标准(默认为C++17),等等。
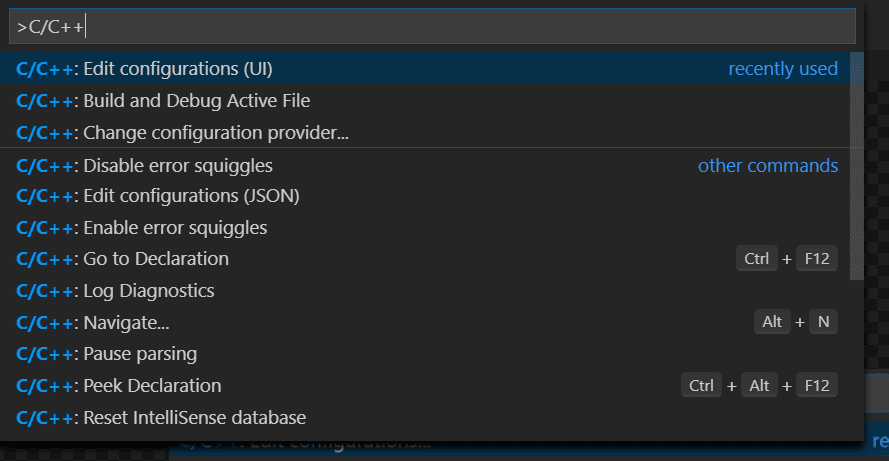
You can view the C/C++ configuration UI by running the command C/C++: Edit Configurations (UI) from the Command Palette (Ctrl+Shift+P).
可以通过运行命令C/C++查看C/C++配置UI:从命令选项板编辑配置(UI)(Ctrl+Shift+P)。
This opens the C/C++ Configurations page. When you make changes here, VS Code writes them to a file called c_cpp_properties.json in the .vscode folder.
这将打开“C/C++配置”页。当你在这里进行更改时,VS Code会将它们写入 .vscode 文件夹中名为 c_cpp_properties.json 的文件。
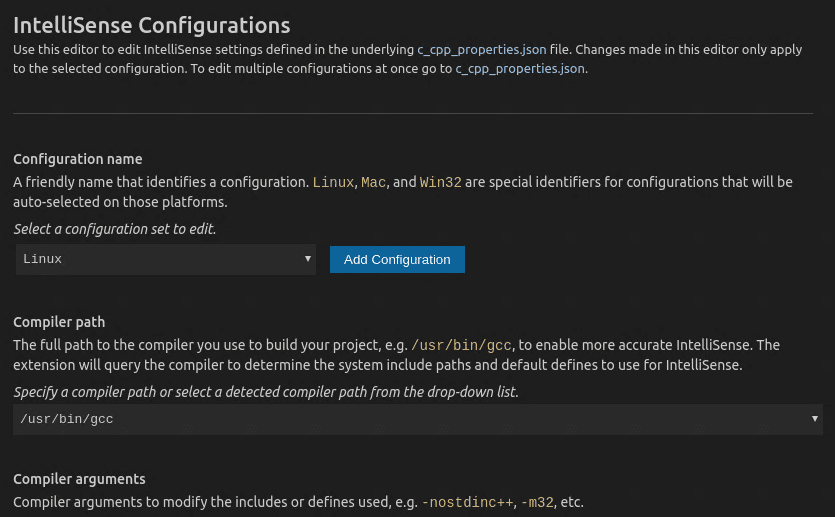
You only need to modify the Include path setting if your program includes header files that are not in your workspace or in the standard library path.
如果程序包含不在工作区或标准库路径中的头文件,则仅需要修改“包含路径”设置。
Visual Studio Code places these settings in .vscode/c_cpp_properties.json. If you open that file directly, it should look something like this:
Visual Studio Code将这些设置放置在 .vscode/c_cpp_properties.json 中。如果你直接打开这个文件,它应该看起来像这样:
{
  "configurations": [
    {
      "name": "Linux",
      "includePath": ["${workspaceFolder}/**"],
      "defines": [],
      "compilerPath": "/usr/bin/gcc",
      "cStandard": "c11",
      "cppStandard": "c++17",
      "intelliSenseMode": "clang-x64"
    }
  ],
  "version": 4
}
Closing the WSL session关闭WSL会话
When you are done working in WSL, you can close your remote session with the Close Remote Connection command available in the main File menu and the Command Palette (Ctrl+Shift+P). This will restart VS Code running locally. You can easily reopen your WSL session from the File > Open Recent list by selecting folders with the [WSL] suffix.
在WSL中完成工作后,可以使用主文件菜单和命令选项板中的“关闭远程连接”命令关闭远程会话(Ctrl+Shift+P)。这将重新启动本地运行的VS Code。您可以通过选择带有[WSL]后缀的文件夹,从文件>打开最近使用的文件列表中轻松地重新打开WSL会话。


 3615
3615


 被折叠的 条评论
为什么被折叠?
被折叠的 条评论
为什么被折叠?
 到【灌水乐园】发言


