


如下图:
模拟后台数据:
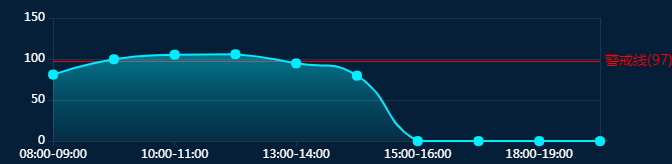
var reg_data ={datas: [{desccode: "EfficiencyGraph", yield: "97", y: "81", description: "08:00-09:00", x: "1"},
   {desccode: "EfficiencyGraph", yield: "97", y: "99.67", description: "09:00-10:00", x: "2"}
   ,{desccode: "EfficiencyGraph", yield: "97", y: "105.20", description: "10:00-11:00", x: "3"}
    ,{desccode: "EfficiencyGraph", yield: "97", y: "105.71", description: "11:00-13:00", x: "4"}
   ,{desccode: "EfficiencyGraph", yield: "97", y: "94.67", description: "13:00-14:00", x: "5"}
    ,{desccode: "EfficiencyGraph", yield: "97", y: "79.67", description: "14:00-15:00", x: "6"}
    ,{desccode: "EfficiencyGraph", yield: "97", y: "0", description: "15:00-16:00", x: "7"}
    ,{desccode: "EfficiencyGraph", yield: "97", y: "0", description: "16:00-18:00", x: "8"}
    ,{desccode: "EfficiencyGraph", yield: "97", y: "0", description: "18:00-19:00", x: "9"}
   ,{desccode: "EfficiencyGraph", yield: "97", y: "0", description: "19:00-20:00", x: "10"}]};
将以上数据转换成可用的:
如:var data = {x:arrX,y:arrY,warnNum:s[0].yield,maxY:maxy};
以下是上图的配置原码:
function lineChartL(id,data) {
    var lineChartDom = echarts.init($("#" + id).get(0));
   // 图表的配置项和数据
    var option = {
        title:{
            /*text:"警戒("+data.warnNum+")",
            right:18,
            bottom:10 + (data.warnNum<=0?23:data.warnNum),*/
            textStyle:{
                color:"red",
                fontSize:13,
                fontWeight:"normal",
                fontFamily:"微软雅黑"
            }
        },
        series: [
            {
                name: "总直通率",  //鼠标悬停点的显示名称
                data: data.y, //y点数据
                type: 'line',
                z:10,
                areaStyle: { //渐变色
                    normal: {
                        color: new echarts.graphic.LinearGradient(
                            0, 0, 0, 1,
                            [
                                {offset: 0, color: 'rgba(2,237,255,0.6)'},
                                {offset: 0.5, color: 'rgba(2,237,255,0.3)'},
                                {offset: 1, color: 'rgba(2,237,255,0.1)'}
                            ]
                        )
                    }},
                smooth: true,
                itemStyle: {
                    // color: '#02edff',
                    normal:{
                        label:{show:true},
                        color:"#02edff"
                    }
                },
                showSymbol: true,
                symbol: 'circle',     //设定为实心点
                symbolSize: 10,   //设定实心点的大小
                center: [20, 50],
                markLine : {   //添加警戒线
                    symbol:"none",               //去掉警戒线最后面的箭头
                    name:"警戒线",
                    silent:true,
                    label:{
                        position:"end",         //将警示值放在哪个位置,三个值“start”,"middle","end"  开始  中点 结束
                        formatter: "警戒线(" +data.warnNum+ ")",
                        color:"red",
                        fontSize:14
                    },
                    data : [{
                        silent:true,             //鼠标悬停事件  true没有,false有
                        lineStyle:{               //警戒线的样式  ,虚实  颜色
                            type:"solid",
                            color:"red"
                        },
                        name: '警戒线',
                        yAxis: data.warnNum
                    }]
                }
            }],
        xAxis: {
            type: 'category',
            data: data.x,
            axisLine: { // 坐标轴小标记
                lineStyle: { // 属性lineStyle控制线条样式
                    // fontWeight : 'bolder',
                    color: '#1d364a',
                    // shadowColor : '#1d364a', // 默认透明
                    width: 1
                }
            },
            boundaryGap: false,
        },
        yAxis: [
            {
            type: 'value',
            show: true,
            minInterval: 0,
            maxInterval: data.maxY,
            min:0,
            max:data.maxY,
            splitNumber: 3,
            nameTextStyle: {
                color: "#fff",
                rich: {
                    color: "#fff"
                }
            },
            axisLine: { // 坐标轴小标记
                lineStyle: { // 属性lineStyle控制线条样式
                    // fontWeight : 'bolder',
                    color: '#1d364a',
                    // shadowColor : '#1d364a', // 默认透明
                    width: 1
                }
            },
            // 控制网格线是否显示
            splitLine: {
                show: true,
                //  改变轴线颜色
                lineStyle: {
                    // 使用深浅的间隔色
                    color: ['#1d364a'],
                    width: 1
                }
            }
        },
            {
            type: "value",
            // name:"abc",
            // nameLocation:"start",
            axisLine: { // 坐标轴小标记
                lineStyle: { // 属性lineStyle控制线条样式
                    // fontWeight : 'bolder',
                    color: '#1d364a',
                    // shadowColor : '#1d364a', // 默认透明
                    width: 1
                }
            }
        }],
        legend: {
            data: ["Y"]
        },
        grid: { //修改图表显示位置
            top: '10%',
            bottom: '10%',
            containLabel: true
        },
        tooltip: { //悬停显示数据
            // trigger: 'axis'
        },
        textStyle: {
            color: "#fff"
        },
        lineStyle: {
            color: "#02edff"
        }
    };
    lineChartDom.setOption(option);
}


 6252
6252


 被折叠的 条评论
为什么被折叠?
被折叠的 条评论
为什么被折叠?
 到【灌水乐园】发言


