


 文章介绍了GrafanaLoki,一个基于元数据的日志记录系统,其特点是高度压缩的日志块存储在对象存储如S3或MinIO中。Loki的配置示例展示了如何通过S3协议将日志块上传到MinIO,包括存储配置、索引设置以及使用BoltDB。此外,文章提到了在MinIO上创建存储桶以配合Loki使用的重要性。
简介
与其他日志记录系统不同,Grafana Loki 是围绕仅索引有关日志的元数据的想法构建的:标签(就像 Prometheus 标签一样)。然后,日志数据本身会被压缩并以块的形式存储在对象存储(例如 S3 或 GCS)中,甚至本地存储在文件系统中。小索引和高度压缩的块简化了操作并显着降低了 Loki 的成本。
在 Loki 2.0 之前,索引数据存储在单独的索引中。
安装 Loki
略,参见: Grafana+Loki+Promtail 搭建日志收集系统_promtail多行日志收集_不会飞的小龙人的博客-CSDN博客
安装 MinIO
略,参见:MinIO 安装笔记_不会飞的小龙人的博客-CSDN博客
Loki 对象存储配置
S3 是 AWS 的托管对象存储服务,也是互联网通用的网络对象存储服务模式。它非常适合托管对象存储,尤其是当您已经在 AWS 上运行并且生产安全时。
使用 AWS config 配置 MinIO,因为 MinIO 实现了 S3 API。而 Loki 支持配置 s3 的应用,如下:
storage_config:
  aws:
    # Note: use a fully qualified domain name, like localhost.
    # full example: http://loki:supersecret@localhost.:9000
    s3: http<s>://<username>:<secret>@<fqdn>:<port>
    s3forcepathstyle: true
  boltdb_shipper:
    active_index_directory: /loki/boltdb-shipper-active
    cache_location: /loki/boltdb-shipper-cache
    cache_ttl: 24h         # Can be increased for faster performance over longer query periods, uses more disk space
    shared_store: s3

schema_config:
  configs:
    - from: 2020-07-01
      store: boltdb-shipper
      object_store: aws
      schema: v11
      # index为索引数据,prefix表示设置索引存储文件夹的前缀,period表示设置当天24小时内的索引数据放在一个index_xxx目录,每天创建一个新index_xx索引目录
      index:
        prefix: index_
        period: 24h
      # 注意chunks存储的即为数据块
      chunks:
        prefix: chunks_
        period: 24h
我们用一个完整的示例,来演示如何将 Loki 通过 s3 协议将日志块上传到 MinIO,完整的 Loki 示例配置如下:
root@ubuntu2:/opt/loki# vim loki-local-config-minio.yaml
auth_enabled: false

server:
  http_listen_port: 3100
  grpc_listen_port: 9096

common:
  path_prefix: /tmp/loki
#  storage:
#    filesystem:
#      chunks_directory: /tmp/loki/chunks
#      rules_directory: /tmp/loki/rules
  replication_factor: 1
  ring:
    instance_addr: 0.0.0.0
    kvstore:
      store: inmemory

query_range:
  results_cache:
    cache:
#      embedded_cache:
#        enabled: true
#        distributed: true
#        max_size_mb: 100

storage_config:
  aws:
    # Note: use a fully qualified domain name, like localhost.
    # full example: http://loki:supersecret@localhost.:9000
    s3: http://miniotest:miniotest@192.168.16.128:9000/loki
    s3forcepathstyle: true
  boltdb_shipper:
    active_index_directory: /tmp/loki/boltdb-shipper-active
    cache_location: /tmp/loki/boltdb-shipper-cache
    cache_ttl: 24
    # Can be increased for faster performance over longer query periods, uses more disk space
    shared_store: s3

schema_config:
  configs:
    - from: 2020-10-24
      store: boltdb-shipper
      object_store: aws
      schema: v11
      index:
        prefix: index_
        period: 24h
      chunks:
        prefix: chunks_
        period: 24h

ruler:
  alertmanager_url: http://localhost:9093
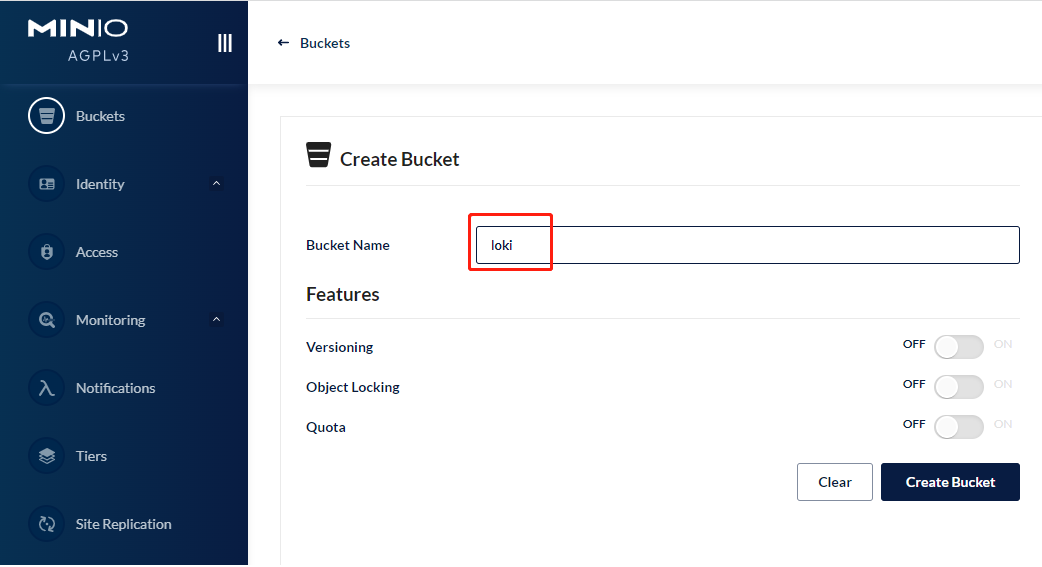
MinIo 上创建 Buckets
loki 要使用 minio 存储日志块数据,必需先在 minio 创建网络对象存储桶 bucket,此 bucketName 必需与 yaml 配置文件中的 bucketName 一致,yaml 中配置的为 s3: http://miniotest:miniotest@192.168.16.128:9000/loki,loki 即为 minio 存储桶名称;miniotest:miniotest 为 minio 创建用的账号和密码,使用此账号上传日志数据到 minio 对象存储桶时,确认此账号有写入权限,如无可以进入 Buckets》loki》Manage》Access Audit》Users 中添加。
启动 loki 服务
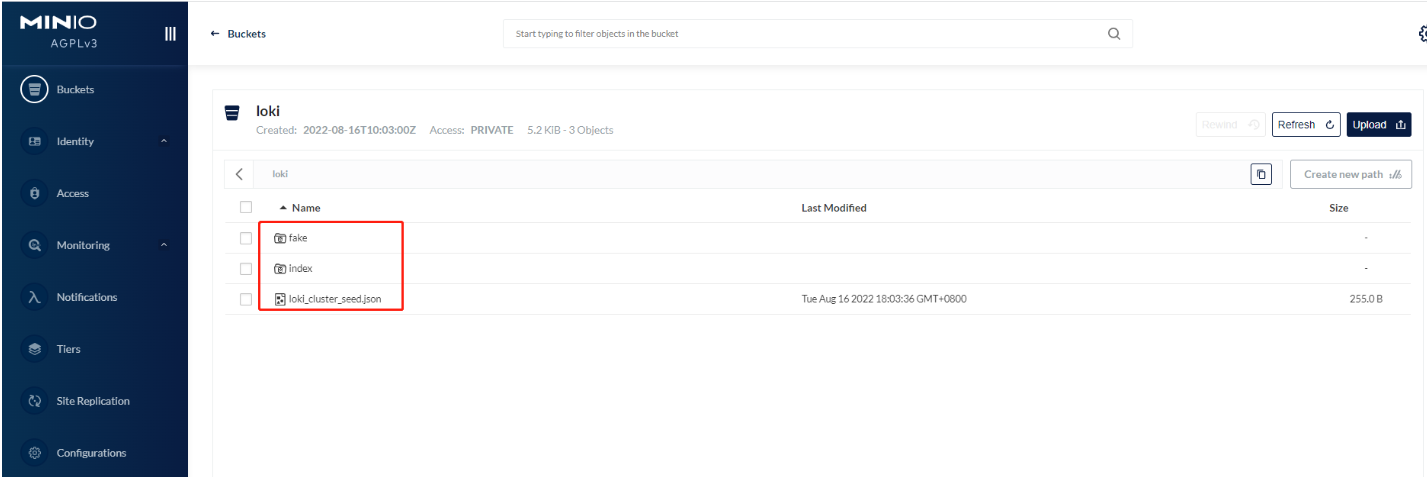
./loki-linux-amd64 --config.file=loki-local-config-minio.yaml日志存储查询
MinIo 管理平台成功上传日志块到 fake 目录和索引文件上传到 index 目录;
参考:
https://grafana.com/docs/loki/latest/configuration/examples/
https://grafana.com/docs/loki/latest/configuration/examples/#aws-basic-config-no-credsyaml (loki 配置 s3)
https://aws.amazon.com/cn/blogs/china/from-elk-efk-to-plg-implement-in-eks-a-container-logging-solution-based-on-promtail-loki-grafana/( 亚马逊 AWS 官方博客)


 2146
2146

 被折叠的 条评论
为什么被折叠?
被折叠的 条评论
为什么被折叠?
 到【灌水乐园】发言


