


噗滋噗滋,最近在项目中要用到曲线图,于是乎我就在网上找了很多很多,有AChartengine,MPAndroidChart,helloChart等等,我还用过基于html5的jsChart来做过,不过最终还是选择了MPAndroidChart来做,因为AChartengine的扩展性不够好,jsChart跟网页交互也不咋好弄,其实用helloChart更漂亮的,不过个人用不到那么高档的,哈哈哈。。。。省略省略。。。。 哇咔咔,先盗用网上的图看看这个东西的神奇,究竟是神马。。。。。

下面我们来看代码吧,其实也是一目了然:
还有这个标注的xml代码:
![]()
![]() 效果不是很好,想更好的效果,继续研究吧,不喜勿喷哇,我是码渣,对此我感到很忧伤
效果不是很好,想更好的效果,继续研究吧,不喜勿喷哇,我是码渣,对此我感到很忧伤
 ,这里只是简单的演示一下这个东西是神马。MPAndroidChart的扩展性很好,要想什么效果可以自己扩展实现。。。。。。。。好了,码渣吹牛逼吹到这里了,继续撸码。。。。。


噗滋,终于偷完图了,是不是看着感觉很牛逼很爽呢,下来我们一起完成这高大上的图表,go go go。。。
首先我们要把这个开源项目MPAndroidChart导入你新建的项目目录中,如下图:
然后我们要写xml文件,也只是加了个显示这个图标的控件,如下所示:
- <RelativeLayout xmlns:android="http://schemas.android.com/apk/res/android"
- xmlns:tools="http://schemas.android.com/tools"
- android:layout_width="match_parent"
- android:layout_height="match_parent"
- android:paddingBottom="@dimen/activity_vertical_margin"
- android:paddingLeft="@dimen/activity_horizontal_margin"
- android:paddingRight="@dimen/activity_horizontal_margin"
- android:paddingTop="@dimen/activity_vertical_margin"
- tools:context=".MainActivity" >
- <com.github.mikephil.charting.charts.LineChart
- android:id="@+id/chart1"
- android:layout_width="match_parent"
- android:layout_height="400dp"
- android:layout_marginTop="20dp" />
- </RelativeLayout>
- package com.example.mpchart;
- import java.util.ArrayList;
- import android.app.Activity;
- import android.graphics.Color;
- import android.graphics.Typeface;
- import android.os.Bundle;
- import android.view.WindowManager;
- import com.github.mikephil.charting.charts.BarLineChartBase.BorderPosition;
- import com.github.mikephil.charting.charts.LineChart;
- import com.github.mikephil.charting.data.Entry;
- import com.github.mikephil.charting.data.LineData;
- import com.github.mikephil.charting.data.LineDataSet;
- import com.github.mikephil.charting.utils.Legend;
- import com.github.mikephil.charting.utils.Legend.LegendForm;
- import com.github.mikephil.charting.utils.XLabels;
- import com.github.mikephil.charting.utils.XLabels.XLabelPosition;
- import com.github.mikephil.charting.utils.YLabels;
- public class MainActivity extends Activity {
- private LineChart mChart;
- @Override
- protected void onCreate(Bundle savedInstanceState) {
- super.onCreate(savedInstanceState);
- getWindow().setFlags(WindowManager.LayoutParams.FLAG_FULLSCREEN,
- WindowManager.LayoutParams.FLAG_FULLSCREEN);
- setContentView(R.layout.activity_main);
- mChart = (LineChart) findViewById(R.id.chart1);
- // 设置在Y轴上是否是从0开始显示
- mChart.setStartAtZero(true);
- //是否在Y轴显示数据,就是曲线上的数据
- mChart.setDrawYValues(true);
- //设置网格
- mChart.setDrawBorder(true);
- mChart.setBorderPositions(new BorderPosition[] {
- BorderPosition.BOTTOM});
- //在chart上的右下角加描述
- mChart.setDescription("曲线图");
- //设置Y轴上的单位
- mChart.setUnit("¥");
- //设置透明度
- mChart.setAlpha(0.8f);
- //设置网格底下的那条线的颜色
- mChart.setBorderColor(Color.rgb(213, 216, 214));
- //设置Y轴前后倒置
- mChart.setInvertYAxisEnabled(false);
- //设置高亮显示
- mChart.setHighlightEnabled(true);
- //设置是否可以触摸,如为false,则不能拖动,缩放等
- mChart.setTouchEnabled(true);
- //设置是否可以拖拽,缩放
- mChart.setDragEnabled(true);
- mChart.setScaleEnabled(true);
- //设置是否能扩大扩小
- mChart.setPinchZoom(true);
- // 设置背景颜色
- // mChart.setBackgroundColor(Color.GRAY);
- //设置点击chart图对应的数据弹出标注
- MyMarkerView mv = new MyMarkerView(this, R.layout.custom_marker_view);
- // define an offset to change the original position of the marker
- // (optional)
- mv.setOffsets(-mv.getMeasuredWidth() / 2, -mv.getMeasuredHeight());
- // set the marker to the chart
- mChart.setMarkerView(mv);
- // enable/disable highlight indicators (the lines that indicate the
- // highlighted Entry)
- mChart.setHighlightIndicatorEnabled(false);
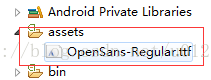
- //设置字体格式,如正楷
- Typeface tf = Typeface.createFromAsset(getAssets(),
- "OpenSans-Regular.ttf");
- mChart.setValueTypeface(tf);
- XLabels xl = mChart.getXLabels();
- // xl.setAvoidFirstLastClipping(true);
- // xl.setAdjustXLabels(true);
- xl.setPosition(XLabelPosition.BOTTOM); // 设置X轴的数据在底部显示
- xl.setTypeface(tf); // 设置字体
- xl.setTextSize(10f); // 设置字体大小
- xl.setSpaceBetweenLabels(3); // 设置数据之间的间距
- YLabels yl = mChart.getYLabels();
- // yl.setPosition(YLabelPosition.LEFT_INSIDE); // set the position
- yl.setTypeface(tf); // 设置字体
- yl.setTextSize(10f); // s设置字体大小
- yl.setLabelCount(5); // 设置Y轴最多显示的数据个数
- // 加载数据
- setData();
- //从X轴进入的动画
- mChart.animateX(4000);
- mChart.animateY(3000); //从Y轴进入的动画
- mChart.animateXY(3000, 3000); //从XY轴一起进入的动画
- //设置最小的缩放
- mChart.setScaleMinima(0.5f, 1f);
- //设置视口
- // mChart.centerViewPort(10, 50);
- // get the legend (only possible after setting data)
- Legend l = mChart.getLegend();
- l.setForm(LegendForm.LINE); //设置图最下面显示的类型
- l.setTypeface(tf);
- l.setTextSize(15);
- l.setTextColor(Color.rgb(104, 241, 175));
- l.setFormSize(30f); // set the size of the legend forms/shapes
- // 刷新图表
- mChart.invalidate();
- }
- private void setData() {
- String[] aa = {"12","14","15","17","18","19","20"};
- String[] bb = {"122.00","234.34","85.67","117.90","332.33","113.33","120.78"};
- ArrayList<String> xVals = new ArrayList<String>();
- for (int i = 0; i < aa.length; i++) {
- xVals.add(aa[i]);
- }
- ArrayList<Entry> yVals = new ArrayList<Entry>();
- for (int i = 0; i < bb.length; i++) {
- yVals.add(new Entry(Float.parseFloat(bb[i]), i));
- }
- // create a dataset and give it a type
- LineDataSet set1 = new LineDataSet(yVals, "DataSet Line");
- set1.setDrawCubic(true); //设置曲线为圆滑的线
- set1.setCubicIntensity(0.2f);
- set1.setDrawFilled(false); //设置包括的范围区域填充颜色
- set1.setDrawCircles(true); //设置有圆点
- set1.setLineWidth(2f); //设置线的宽度
- set1.setCircleSize(5f); //设置小圆的大小
- set1.setHighLightColor(Color.rgb(244, 117, 117));
- set1.setColor(Color.rgb(104, 241, 175)); //设置曲线的颜色
- // create a data object with the datasets
- LineData data = new LineData(xVals, set1);
- // set data
- mChart.setData(data);
- }
- }
还有上面代码有说到的数据上可以显示一个标注,代码如下:
- package com.example.mpchart;
- import android.content.Context;
- import android.widget.TextView;
- import com.github.mikephil.charting.data.CandleEntry;
- import com.github.mikephil.charting.data.Entry;
- import com.github.mikephil.charting.utils.MarkerView;
- import com.github.mikephil.charting.utils.Utils;
- public class MyMarkerView extends MarkerView {
- private TextView tvContent;
- public MyMarkerView(Context context, int layoutResource) {
- super(context, layoutResource);
- tvContent = (TextView) findViewById(R.id.tvContent);
- }
- // callbacks everytime the MarkerView is redrawn, can be used to update the
- // content
- @Override
- public void refreshContent(Entry e, int dataSetIndex) {
- if (e instanceof CandleEntry) {
- CandleEntry ce = (CandleEntry) e;
- tvContent.setText("" + Utils.formatNumber(ce.getHigh(), 0, true));
- } else {
- // tvContent.setText("" + Utils.formatNumber(e.getVal(), 0, true));
- tvContent.setText("" +e.getVal());
- }
- }
- }
- <?xml version="1.0" encoding="utf-8"?>
- <RelativeLayout xmlns:android="http://schemas.android.com/apk/res/android"
- android:layout_width="wrap_content"
- android:layout_height="40dp"
- android:background="@drawable/marker2" >
- <TextView
- android:id="@+id/tvContent"
- android:layout_width="wrap_content"
- android:layout_height="wrap_content"
- android:layout_centerHorizontal="true"
- android:layout_marginTop="7dp"
- android:layout_marginLeft="5dp"
- android:layout_marginRight="5dp"
- android:text=""
- android:textSize="12dp"
- android:textColor="@android:color/white"
- android:ellipsize="end"
- android:singleLine="true"
- android:textAppearance="?android:attr/textAppearanceSmall" />
- </RelativeLayout>
还有设置字体格式的文件,要放到这个文件夹下面,如图:
其实上面的代码也没什么的,很简单,看注释一目了然,很清楚,上面我只是简单的列举了曲线一部分的使用方法,MPAndroidChart还有很多等着我们去挖掘,研究。 。。。。
。。。。
。。。。
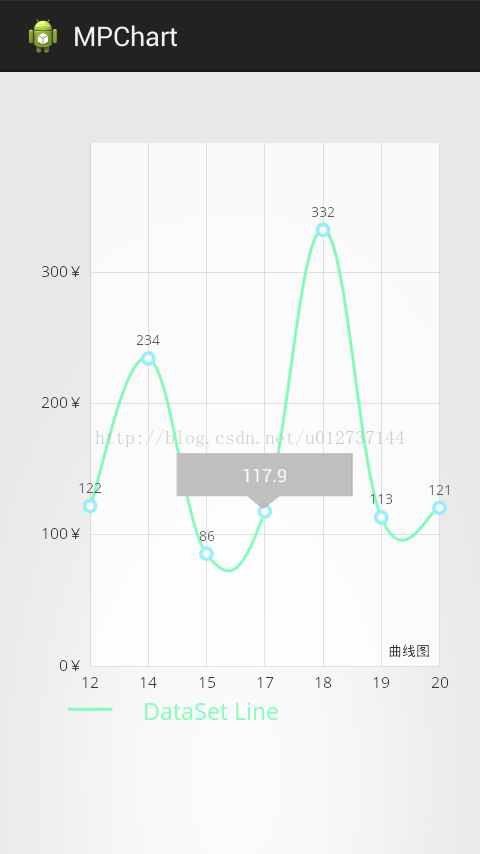
我这些代码基本可以实现上面贴出来的前四张图的效果,下面我贴一张做的效果图看看,想要实现上面的效果,在代码上改一下就行了,具体看注释
,这里只是简单的演示一下这个东西是神马。MPAndroidChart的扩展性很好,要想什么效果可以自己扩展实现。。。。。。。。好了,码渣吹牛逼吹到这里了,继续撸码。。。。。
源码:飞翔取码


 2万+
2万+

 被折叠的 条评论
为什么被折叠?
被折叠的 条评论
为什么被折叠?
 到【灌水乐园】发言


