classdef InteractiveDataPlotter < handle
properties
dataMap
fig
axes
plotHandles
keyListbox
end
methods
function obj = InteractiveDataPlotter(dataMap)
% 验证输入
if ~isa(dataMap, 'containers.Map')
error('输入必须是containers.Map对象');
end
obj.dataMap = dataMap;
% 创建UI界面
obj.createUI();
end
function createUI(obj)
% 创建主窗口
obj.fig = figure('Name', '交互式数据绘图器', 'Position', [100, 100, 1000, 600]);
% 创建坐标轴
obj.axes = axes('Parent', obj.fig, 'Position', [0.3, 0.2, 0.65, 0.7]);
title(obj.axes, '数据可视化');
grid(obj.axes, 'on');
hold(obj.axes, 'on');
% 创建列表框显示键名
obj.keyListbox = uicontrol('Style', 'listbox',...
'Parent', obj.fig,...
'Position', [20, 100, 200, 400],...
'String', keys(obj.dataMap),...
'Max', 2, 'Min', 0,... % 允许多选
'Callback', @(src,evt)obj.plotSelectedData());
% 创建保存按钮
uicontrol('Style', 'pushbutton',...
'Parent', obj.fig,...
'Position', [20, 50, 200, 30],...
'String', '保存为CSV',...
'Callback', @(src,evt)obj.saveToCSV());
% 初始绘制所有数据
obj.plotAllData();
end
function plotAllData(obj)
% 清除现有绘图
cla(obj.axes);
% 获取所有键
keys = obj.dataMap.keys();
obj.plotHandles = gobjects(1, length(keys));
% 绘制所有数据
for i = 1:length(keys)
key = keys{i};
data = obj.dataMap(key);
% 确保数据是列向量
if isrow(data)
data = data';
end
% 绘制数据
obj.plotHandles(i) = plot(obj.axes, data, 'DisplayName', key);
end
% 添加图例
legend(obj.axes, 'show');
end
function plotSelectedData(obj)
% 获取选中的键
selectedIdx = get(obj.keyListbox, 'Value');
keys = get(obj.keyListbox, 'String');
selectedKeys = keys(selectedIdx);
% 清除现有绘图
cla(obj.axes);
% 绘制选中的数据
for i = 1:length(selectedKeys)
key = selectedKeys{i};
data = obj.dataMap(key);
% 确保数据是列向量
if isrow(data)
data = data';
end
% 绘制数据
plot(obj.axes, data, 'DisplayName', key);
end
% 添加图例
legend(obj.axes, 'show');
end
function saveToCSV(obj)
% 获取保存文件名
[filename, pathname] = uiputfile('*.csv', '保存CSV文件');
if isequal(filename, 0) || isequal(pathname, 0)
return; % 用户取消
end
fullPath = fullfile(pathname, filename);
% 写入CSV文件
obj.writeMapToCSV(fullPath);
% 显示成功消息
msgbox(sprintf('数据已保存到: %s', fullPath), '保存成功');
end
function writeMapToCSV(obj, filename)
% 获取所有键
keys = obj.dataMap.keys();
numKeys = numel(keys);
% 找出最大数据长度
maxLength = 0;
for i = 1:numKeys
data = obj.dataMap(keys{i});
dataLength = numel(data);
if dataLength > maxLength
maxLength = dataLength;
end
end
% 确保至少有一个数据点
if maxLength == 0
maxLength = 1;
end
% 创建数据表格
tableData = table();
% 为每个键添加数据列
for i = 1:numKeys
key = keys{i};
data = obj.dataMap(key);
% 确保数据是列向量
if isrow(data)
data = data';
end
% 确保长度一致
if numel(data) < maxLength
% 填充NaN以匹配最大长度
paddedData = [data; nan(maxLength - numel(data), 1)];
else
paddedData = data(1:maxLength);
end
% 添加到表格
tableData.(key) = paddedData;
end
% 写入CSV文件
writetable(tableData, filename);
end
end
end
增加可以运算多个图像显示,比如我想看第一条数据线和第5条数据线。我可以用双击或者其他易于实现的方式来将某个或者某几个图像显示在一个界面中
最新发布


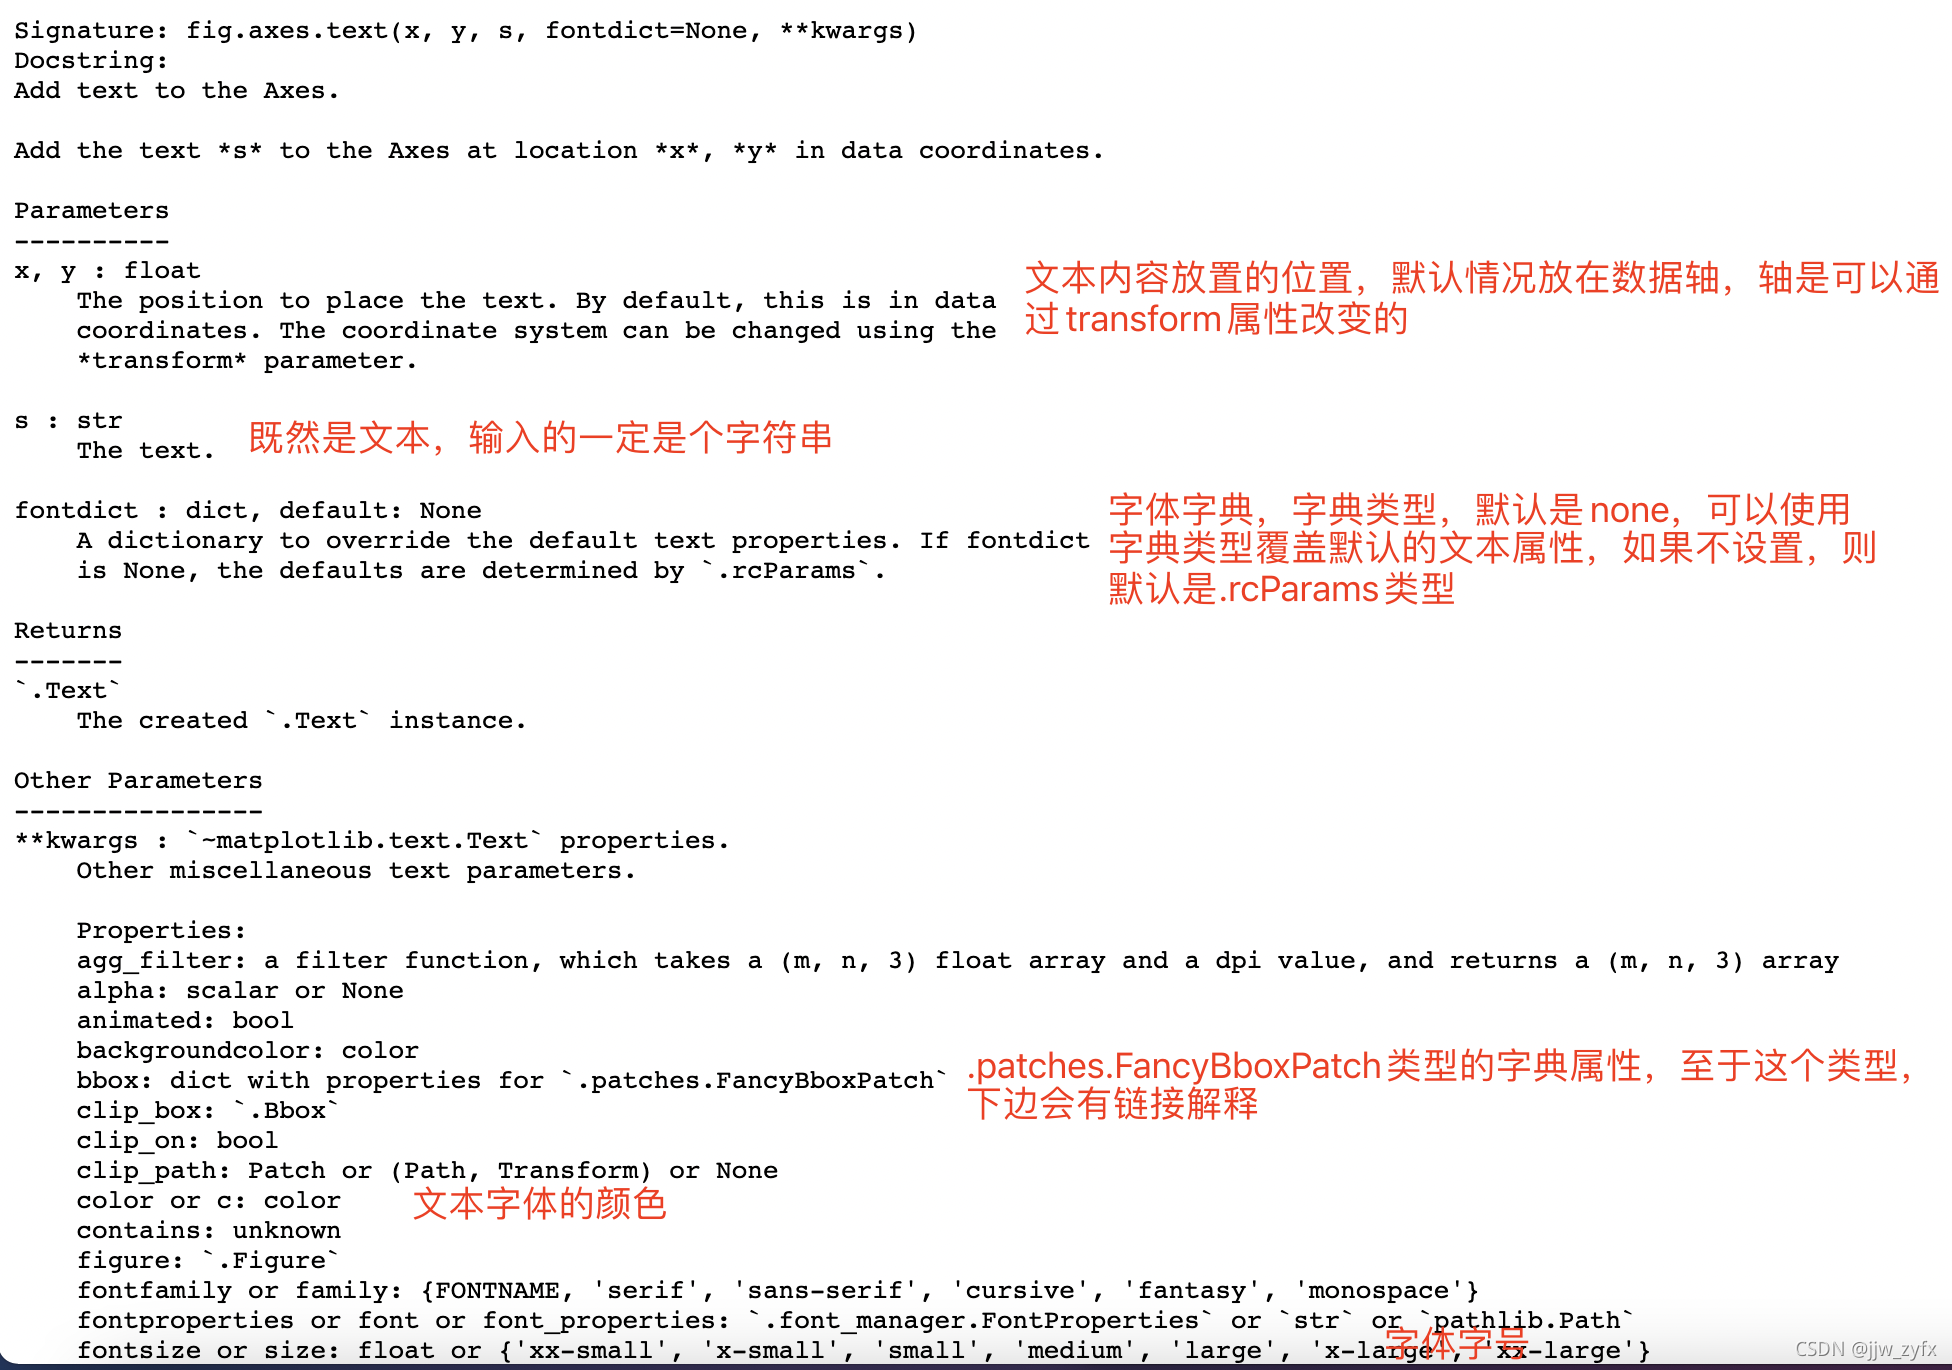
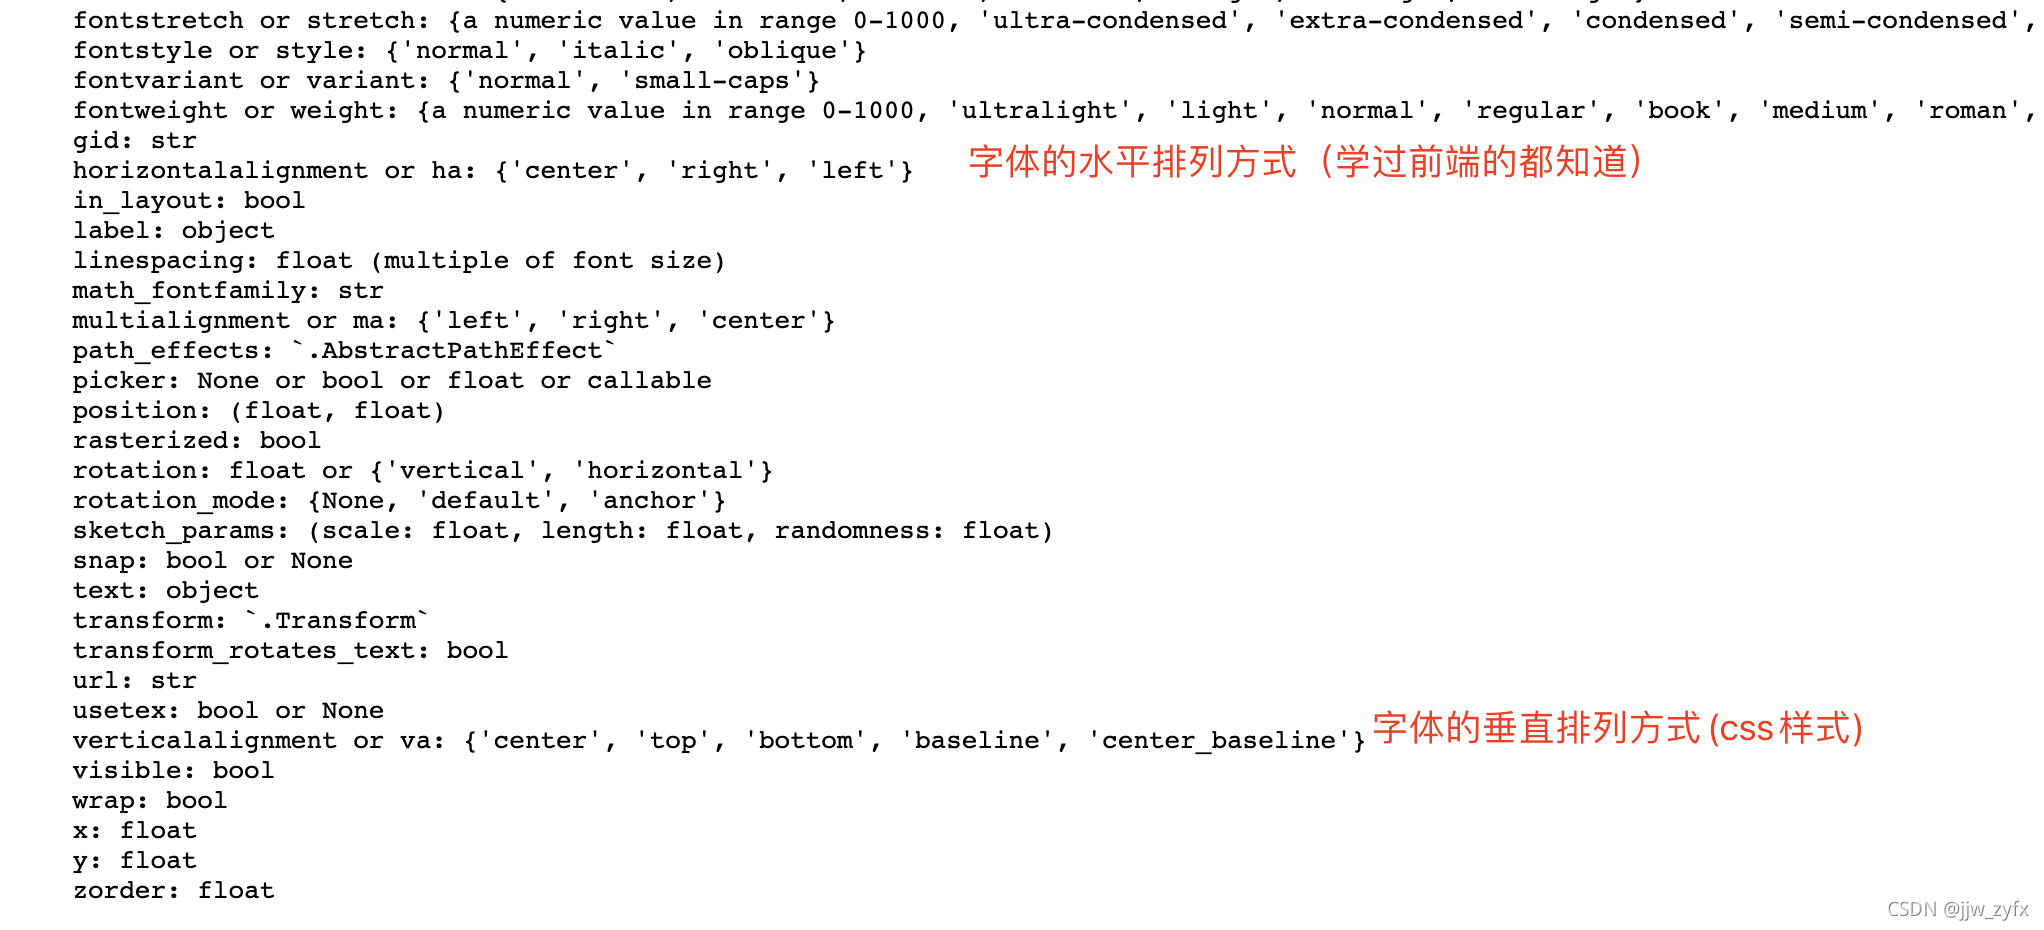
 本文详细介绍Matplotlib中如何使用文本注释功能,包括位置设置、样式调整等关键参数,并提供多个实例帮助理解。
 最低0.47元/天 解锁文章


 3594
3594

 被折叠的 条评论
为什么被折叠?
被折叠的 条评论
为什么被折叠?
 到【灌水乐园】发言


