


准备工作:
1.python34+sublime
2.准备太阳黑子数据predict.txt
3.安装tomcat,并将predict.txt置于根目录下
sunspots_roto.py
#第一行就与python2不同
#原文:from urllib import urlopen
from urllib.request import urlopen
from reportlab.graphics.shapes import *
from reportlab.graphics.charts.lineplots import LinePlot
from reportlab.graphics.charts.textlabels import Label
from reportlab.graphics import renderPDF
#http://localhost:8080/predict.txt
URL = 'http://localhost:8080/predict.txt'
#原文:COMMENT_CHARS = '#:',txt数据中没有:,因此不加也行的
COMMENT_CHARS = '#'
drawing=Drawing(400,200)
data = []
for line in urlopen(URL).readlines():
#原文:not line[0] in COMMENT_CHARS;
#不使用decode的话,line的类型为<class 'bytes'>,
#错误提示:TypeError: 'str' does not support the buffer interface
line = line.decode()
if not line.isspace() and not line[0] in COMMENT_CHARS:
data.append([float(n) for n in line.split()])
pred = [row[2]-40 for row in data]
high = [row[3]-40 for row in data]
low = [row[4]-40 for row in data]
times = [row[0] + row[1]/12 for row in data]
lp = LinePlot()
lp.x = 50
lp.y = 50
lp.height = 125
lp.width = 300
#原文:lp.data =[zip(times,pred),zip(times,high),zip(times,low)],
#不使用tuple转换会报错,
#错误提示:TypeError: object of type 'zip' has no len()
la =tuple(zip(times,pred))
lb =tuple(zip(times,high))
lc = tuple(zip(times,low))
lp.data =[la,lb,lc]
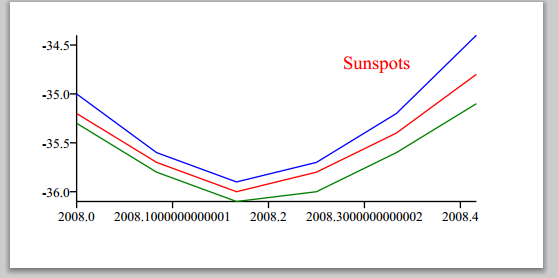
lp.lines[0].strokeColor= colors.red
lp.lines[1].strokeColor= colors.blue
lp.lines[2].strokeColor= colors.green
drawing.add(lp)
drawing.add(String(250,150,'Sunspots',fontSize =14,fillColor=colors.red))
renderPDF.drawToFile(drawing,'report2.pdf','ssss')运行效果:


 2704
2704

 被折叠的 条评论
为什么被折叠?
被折叠的 条评论
为什么被折叠?
 到【灌水乐园】发言


