


Mask RCNN系列文章目录
Mask RCNN笔记:环境安装篇(Win10+tensrflow-gpu) 不需要另行安装cuda cudnn
MaskRCNN可视化界面开发(PyQt5)
文章目录
笔者因毕设要求,需要对maskRCNN进行封装,制作一个可视化界面。
先来展示下效果图:

文章目录
前言
本文默认已经实现了MaskRCNN的训练和测试,现在测试的基础上加一个UI界面。 本文使用PyQt5进行界面开发。提示:以下是本篇文章正文内容,下面案例可供参考
一、PyQt5及Designer、Pyuic插件安装
1.激活maskRCNN虚拟环境,安装PyQt5:
pip install -i https://pypi.tuna.tsinghua.edu.cn/simple PyQt5
清华的镜像地址,加速下载,推荐使用
PyQt5 测试
import sys
from PyQt5 import QtWidgets

app = QtWidgets.QApplication(sys.argv)
widget = QtWidgets.QWidget()
widget.resize(360, 360)
widget.setWindowTitle("Hello, PyQt5")
widget.show()
sys.exit(app.exec_())

2.安装Qt的工具包
pip install -i https://pypi.tuna.tsinghua.edu.cn/simple PyQt5-tools
安装成功打开python的安装目录的Lib目录下,site-packages里面会有 PyQt5 和 pyqt5-tools 两个目录
配置PyChram,安装QtDesigner:
2.1打开PyCharm,File > Settings > Tools > External Tools

2.2点击 + 号创建
Name: Designer
Group: Qt
Program: designer.exe所在目录
Working directory: $ProjectFileDir$

2.3安装Pyuic
打开PyCharm,File > Settings > Tools > External Tools
点击 + 号创建
Name: Pyuic
Group: Qt
Program: python.exe所在目录
Arguments: -m PyQt5.uic.pyuic $FileName$ -o $FileNameWithoutExtension$.py
Working directory: $FileDir$

二、设计UI界面
1.使用Qt Designer来设计界面
注意本过程需在maskRCNN源码的同一目录下进行。
按照我们之前的界面构思

我们需要从3个PushButton按键,2个label用于展示和1个textBrowser用于状态显示。
控件上显示的文字 text 属性和控件的名字 objectName 属性需要修改,便于显示和代码调用。可以按照下面我推荐的命名:
| 控件 | 显示内容text | 控件名objectName |
|---|---|---|
| PushButton | 导入图片 | btnInput |
| PushButton | 检测 | btnTest |
| PushButton | 保存 | btnSave |
| Label | 输入图片 | labelinput |
| Label | 结果图片 | labelresult |
| TextBrowser | textBrowser |
2.按钮事件
我们知道GUI是通过事件驱动的,什么意思呢?比如前面我们已经设计好了界面,接下来就需要实现”导入图片”到”保存”这3个按钮的功能,也就是给每个按钮指定一个”函数”,逻辑代码写在这个函数里面。这种函数就称为事件,Qt中称为槽连接。
点击Designer工具栏的”Edit Signals/Slots”按钮,进入槽函数编辑界面,点击旁边的”Edit Widgets”可以恢复正常视图:
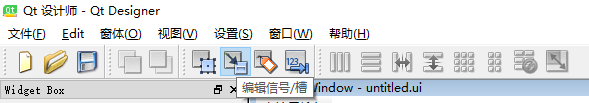
进入槽函数编辑界面后,然后点击按钮并拖动,当产生类似于电路中的接地符号时释放鼠标,参看下图:

到此,我们就完成了界面设计的所有工作,按下Ctrl+S保存当前窗口为.ui文件。
3.ui文件转py代码

运行PyUIC后,会生成UI个.py文件,打开.py就是我们需要的界面模板。注意不要直接在.py文件里编码,因为每一次运行PyUIC,生成的.py文件都会更新,添加的代码不会保存。
三、编写逻辑代码
在同一工作目录下新建一个”UI_main.py”的文件,存放逻辑代码。代码中的每部分我都写得比较独立,没有封装成函数,便于理解。代码看上去很长,但很简单,可以每个模块单独看。
我整体的思路比较简单:
1.当按下导入图片按键时,要导入的图片显示在待显示的label区域;
2.当按下导入检测按键时,运行原来的maskRCNN的测试部分的代码,并将测试部分的结果图片保存为temp.png,并显示在结果显示的label区域;
3.当按下导入保存按键时,读取temp.png图片,保存到指定位置。
4.以上三部步都会产生反馈状态,将反馈状态显示在textBrowser区域。
下面直接上代码:
import sys
import cv2 as cv

from PyQt5 import QtCore, QtGui, QtWidgets
from PyQt5.QtCore import *
from PyQt5.QtGui import *
# from PyQt5.QtWidgets import QFileDialog, QMainWindow
from PyQt5.QtWidgets import QFileDialog, QMainWindow, QApplication

from untitled import Ui_MainWindow


class PyQtMainEntry(QMainWindow, Ui_MainWindow):
    def __init__(self):
        super().__init__()
        self.setupUi(self)
        self.setWindowTitle("路面缺陷检测软件V1.0")

        self.labelinput.setAlignment(Qt.AlignCenter)
        self.labelinput.setStyleSheet("QLabel{background:gray;}"
                                      "QLabel{color:rgba(255,255,255,150);"
                                      "font-size:20px;"
                                      "font-weight:bold;"
                                      "font-family:Roman times;}")

        self.labelresult.setAlignment(Qt.AlignCenter)
        self.labelresult.setStyleSheet("QLabel{background:gray;}"
                                       "QLabel{color:rgba(255,255,255,150);"
                                       "font-size:20px;"
                                       "font-weight:bold;"
                                       "font-family:Roman times;}")

    def btnTest_Pressed(self):
        if not hasattr(self, "captured"):
            # print("没有输入图像")
            # self.textBrowser.setPlainText("没有输入图像")
            return
        self.textBrowser.append("图像检测中...")


    def btnInput_Clicked(self):
        '''
        从本地读取图片
        '''
        global fname
        # 打开文件选取对话框
        filename, _ = QFileDialog.getOpenFileName(self, '打开图片', "", "*.jpg;;*.png;;All Files(*)")
        if filename:
            self.captured = cv.imread(str(filename))
            # OpenCV图像以BGR通道存储,显示时需要从BGR转到RGB
            self.captured = cv.cvtColor(self.captured, cv.COLOR_BGR2RGB)

            rows, cols, channels = self.captured.shape
            bytesPerLine = channels * cols
            QImg = QImage(self.captured.data, cols, rows, bytesPerLine, QImage.Format_RGB888)
            self.labelinput.setPixmap(QPixmap.fromImage(QImg).scaled(
                self.labelinput.size(), Qt.KeepAspectRatio, Qt.SmoothTransformation))
        fname = filename
        print(fname)
        self.textBrowser.setPlainText("成功打开图片")

    def btnTest_Clicked(self):
        '''
        test
        '''
        global fname
        # 如果没有捕获图片,则不执行操作
        if not hasattr(self, "captured"):
            print("没有输入图像")
            self.textBrowser.setPlainText("没有输入图像")
            return
        print("start")
        print(fname.split("/")[-1])
        # -*- coding: utf-8 -*-
        import os
        import sys
        import skimage.io
        import matplotlib
        matplotlib.rcParams['font.sans-serif'] = ['KaiTi']
        matplotlib.rcParams['font.serif'] = ['KaiTi']
        from mrcnn.config import Config
        from datetime import datetime

        # Root directory of the project
        ROOT_DIR = os.getcwd()

        # Import Mask RCNN
        sys.path.append(ROOT_DIR)  # To find local version of the library
        from mrcnn import utils
        import mrcnn.model as modellib
        from mrcnn import visualize

        # Import COCO config
        # sys.path.append(os.path.join(ROOT_DIR, "samples/coco/"))  # To find local version
        # from samples.coco import coco

        # Directory to save logs and trained model
        MODEL_DIR = os.path.join(ROOT_DIR, "logs")

        # Local path to trained weights file
        # todo:模型位置
        COCO_MODEL_PATH = "E:\\maskrcnn_pycharm\\Mask_RCNN\\logs\\mask_rcnn_shapes_1000.h5"  # 模型保存目录
        # Download COCO trained weights from Releases if needed
        if not os.path.exists(COCO_MODEL_PATH):
            utils.download_trained_weights(COCO_MODEL_PATH)
            print("cuiwei***********************")

        # Directory of images to run detection on
        # todo:测试图片位置
        # IMAGE_DIR = os.path.join(ROOT_DIR, "picRGB")
        IMAGE_DIR = fname

        print(IMAGE_DIR)

        class ShapesConfig(Config):
            """Configuration for training on the toy shapes dataset.
            Derives from the base Config class and overrides values specific
            to the toy shapes dataset.
            """
            # Give the configuration a recognizable name
            NAME = "shapes"

            # Train on 1 GPU and 8 images per GPU. We can put multiple images on each
            # GPU because the images are small. Batch size is 8 (GPUs * images/GPU).
            GPU_COUNT = 1
            IMAGES_PER_GPU = 1

            # Number of classes (including background)
            NUM_CLASSES = 1 + 6  # background + 3 shapes

            # Use small images for faster training. Set the limits of the small side
            # the large side, and that determines the image shape.
            IMAGE_MIN_DIM = 320
            IMAGE_MAX_DIM = 512

            # Use smaller anchors because our image and objects are small
            RPN_ANCHOR_SCALES = (8 * 6, 16 * 6, 32 * 6, 64 * 6, 128 * 6)  # anchor side in pixels

            # Reduce training ROIs per image because the images are small and have
            # few objects. Aim to allow ROI sampling to pick 33% positive ROIs.
            TRAIN_ROIS_PER_IMAGE = 100

            # Use a small epoch since the data is simple
            STEPS_PER_EPOCH = 100

            # use small validation steps since the epoch is small
            VALIDATION_STEPS = 50

        # import train_tongue
        # class InferenceConfig(coco.CocoConfig):
        class InferenceConfig(ShapesConfig):
            # Set batch size to 1 since we'll be running inference on
            # one image at a time. Batch size = GPU_COUNT * IMAGES_PER_GPU
            GPU_COUNT = 1
            IMAGES_PER_GPU = 1

        config = InferenceConfig()

        # Create model object in inference mode.
        model = modellib.MaskRCNN(mode="inference", model_dir=MODEL_DIR, config=config)

        # Load weights trained on MS-COCO
        model.load_weights(COCO_MODEL_PATH, by_name=True)

        # COCO Class names
        # Index of the class in the list is its ID. For example, to get ID of
        # the teddy bear class, use: class_names.index('teddy bear')
        # class_names = ['BG', '隐裂']  # 注意修改类别名称
        class_names = ['BG', '灌缝修补', '横向裂缝', '块状裂缝', '块状修补', '纵向裂缝', '坑槽']
        # Load a random image from the images folder
        # file_names = next(os.walk(IMAGE_DIR))[2]
        # image = skimage.io.imread("E:\\maskrcnn_pycharm\\Mask_RCNN\\picRGB\\62.png")  # 你想要测试的图片
        image = skimage.io.imread(fname)  # 你想要测试的图片

        a = datetime.now()
        # Run detection
        results = model.detect([image], verbose=1)
        # print("result:",results)
        b = datetime.now()
        # Visualize results
        # print("检测用时", (b - a).seconds)
        time = (b - a).seconds
        self.textBrowser.append("检测用时:" + str(time) + "s")
        r = results[0]
        visualize.display_instances(image, r['rois'], r['masks'], r['class_ids'],
                                    class_names, r['scores'])

        class_ids = r['class_ids']

        class_dict = {}
        for index, i in enumerate(class_ids):
            if i in class_dict:
                class_dict[i] += 1
            else:
                class_dict[i] = 1

        output_dict = {}

        for key, value in class_dict.items():
            label = class_names[key]
            output_dict[label] = value
        print(output_dict)
        self.textBrowser.append("本张路面图片包含:" )
        for key, value in output_dict.items():
            self.textBrowser.append(str(value)+"处"+str(key))

        self.captured = cv.imread(r"temp.png")
        # OpenCV图像以BGR通道存储,显示时需要从BGR转到RGB
        self.captured = cv.cvtColor(self.captured, cv.COLOR_BGR2RGB)

        rows, cols, channels = self.captured.shape
        bytesPerLine = channels * cols
        QImg = QImage(self.captured.data, cols, rows, bytesPerLine, QImage.Format_RGB888)
        self.labelresult.setPixmap(QPixmap.fromImage(QImg).scaled(
            self.labelresult.size(), Qt.KeepAspectRatio, Qt.SmoothTransformation))

        self.textBrowser.append("检测完成")

    def btnSave_Clicked(self):
        '''
        保存
        '''
        global fname
        if not hasattr(self, "captured"):
            print("没有输入图像")
            self.textBrowser.setPlainText("没有输入图像")
            return
        tmp = fname.split('/')[-1]
        img = cv.imread("temp.png")
        fd, type = QFileDialog.getSaveFileName(self,
                                               "保存图片", tmp)
        print(fd)
        cv.imwrite(fd, img)
        # self.textBrowser.setPlainText("保存成功")
        self.textBrowser.append("保存成功")  # textedit是文本框的名称

        print("保存成功")


if __name__ == "__main__":
    app = QtWidgets.QApplication(sys.argv)
    window = PyQtMainEntry()
    window.show()
    sys.exit(app.exec_())
今天就先写到这边,后续有想法再补充!
2020年12月8日15:32:30
四、补充
1.界面样式美化
原来的界面有比较朴实无华(丑),这两天在原来的基础上做了一些布局修改和样式效果,下面先看下美化后的效果(简单的美化,哈哈哈!!!)。

总的来说就是,加了一些图标、按键样式和背景。
实现这些只需要在之前代码的def __init__(self)初始化函数中加入以下代码:
        self.setWindowIcon(QIcon('E:\\maskRCNN\\Mask_RCNN\\icon\\head.png'))

        # 设置背景图片
        palette1 = QPalette()
        palette1.setBrush(self.backgroundRole(), QBrush(QPixmap('E:\\maskRCNN\\Mask_RCNN\\icon\\bg.jpg')))
        self.setPalette(palette1)

        self.setStyleSheet(
            'QPushButton{font-weight: bold; background: skyblue; border-radius: 14px;'  # 为按钮设置通用样式
            'width: 64px; height: 28px; font-size: 20px; text-align: center;}'
            'QPushButton:hover{background: rgb(50, 150, 255);}'  # 鼠标划到按钮上的样式
            'QLabel{font-weight: bold; font-size: 20px; color: orange}'  # QLabel通用样式
            'QLineEdit{width: 100px; font: 微软雅黑}'  # QlineEdit通用样式
        )

        # self.btnInput.setIcon(QIcon(r'icon/open_img.png'))
        self.btnInput.setStyleSheet("QPushButton{color:black}"
                                      "QPushButton:hover{color:red}"
                                      "QPushButton{background-color:lightgreen}"
                                      "QPushButton{border:2px}"
                                      "QPushButton{border-radius:10px}"
                                      "QPushButton{padding:2px 4px}")

        # self.btnTest.setIcon(QIcon(r'icon/start.png'))
        self.btnTest.setStyleSheet("QPushButton{color:black}"
                                    "QPushButton:hover{color:red}"
                                    "QPushButton{background-color:lightgreen}"
                                    "QPushButton{border:2px}"
                                    "QPushButton{border-radius:10px}"
                                    "QPushButton{padding:2px 4px}")

        # self.btnSave.setIcon(QIcon(r'icon/save.png'))
        self.btnSave.setStyleSheet("QPushButton{color:black}"
                                   "QPushButton:hover{color:red}"
                                   "QPushButton{background-color:lightgreen}"
                                   "QPushButton{border:2px}"
                                   "QPushButton{border-radius:10px}"
                                   "QPushButton{padding:2px 4px}")
这次的补充就先到这,下次预计更新pyinstaller打包成独立exe文件。
第一次更新:2020年12月10日21:10:12
2.pyinstaller打包成独立exe文件
现在maskRCNN环境中安装pyinstaller
pip install pyinstaller
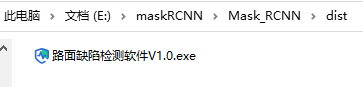
cmd到文件夹下运行pyinstaller -w -F UI_main.py

出现上图后,说明打包成功。
在同级目录下就会出现一个dist文件夹,里面就有一个我们打包好的exe文件。
打包调试:
1.pyinstaller重新安装后不是内部或外部命令,也不是可运行的程序 或批处理文件
一般安装完pyinstaller 会默认在 python 的 Scripts 目录下,需要你配置好环境变量。
接着把pyinstaller.exe从(C:\Users…\AppData\Roaming\Python\Python36\Scripts)复制一份到cmd检索的路径中(C:\Program Files\Python36\Scripts),此处需要根据自己的路径稍作修改。
2.图片加载问题
我在最初打包的时候没有将图片的路径写为绝对路径,导致打包后的程序打开后不能够显示图片,解决办法就是将程序中的路径,全部写为绝对路径,这样打包后的程序打开后就直接可以看到图片了!
第二次更新:2020年12月11日17:07:14
五、勘误
之前写的比较急,没有好好复查,有小伙伴说复现代码时self.captured = cv.imread(r"temp.png") 会报错,这里是因为我在visualize.py里将推理出的图片保存为了temp.png,但我却忘记给说明了。现在给出我修改后的visualize.py代码,希望小伙伴们都能跑的通!!!
visualize.py:
"""
Mask R-CNN
Display and Visualization Functions.

Copyright (c) 2017 Matterport, Inc.
Licensed under the MIT License (see LICENSE for details)
Written by Waleed Abdulla
"""

import os
import sys
import random
import itertools
import colorsys

import numpy as np
from skimage.measure import find_contours
import matplotlib.pyplot as plt
from matplotlib import patches,  lines
from matplotlib.patches import Polygon
import IPython.display

# Root directory of the project
ROOT_DIR = os.path.abspath("../")

# Import Mask RCNN
sys.path.append(ROOT_DIR)  # To find local version of the library
from mrcnn import utils


############################################################
#  Visualization
############################################################

def display_images(images, titles=None, cols=4, cmap=None, norm=None,
                   interpolation=None):
    """Display the given set of images, optionally with titles.
    images: list or array of image tensors in HWC format.
    titles: optional. A list of titles to display with each image.
    cols: number of images per row
    cmap: Optional. Color map to use. For example, "Blues".
    norm: Optional. A Normalize instance to map values to colors.
    interpolation: Optional. Image interpolation to use for display.
    """
    titles = titles if titles is not None else [""] * len(images)
    rows = len(images) // cols + 1
    plt.figure(figsize=(14, 14 * rows // cols))
    i = 1
    for image, title in zip(images, titles):
        plt.subplot(rows, cols, i)
        plt.title(title, fontsize=9)
        plt.axis('off')
        plt.imshow(image.astype(np.uint8), cmap=cmap,
                   norm=norm, interpolation=interpolation)
        i += 1
    plt.show()


def random_colors(N, bright=True):
    """
    Generate random colors.
    To get visually distinct colors, generate them in HSV space then
    convert to RGB.
    """
    brightness = 1.0 if bright else 0.7
    hsv = [(i / N, 1, brightness) for i in range(N)]
    colors = list(map(lambda c: colorsys.hsv_to_rgb(*c), hsv))
    random.shuffle(colors)
    return colors


def apply_mask(image, mask, color, alpha=0.5):
    """Apply the given mask to the image.
    """
    for c in range(3):
        image[:, :, c] = np.where(mask == 1,
                                  image[:, :, c] *
                                  (1 - alpha) + alpha * color[c] * 255,
                                  image[:, :, c])
    return image


def display_instances(image, boxes, masks, class_ids, class_names,
                      scores=None, title="",
                      figsize=(16, 16), ax=None,
                      show_mask=True, show_bbox=True,
                      colors=None, captions=None):
    """
    boxes: [num_instance, (y1, x1, y2, x2, class_id)] in image coordinates.
    masks: [height, width, num_instances]
    class_ids: [num_instances]
    class_names: list of class names of the dataset
    scores: (optional) confidence scores for each box
    title: (optional) Figure title
    show_mask, show_bbox: To show masks and bounding boxes or not
    figsize: (optional) the size of the image
    colors: (optional) An array or colors to use with each object
    captions: (optional) A list of strings to use as captions for each object
    """
    # Number of instances
    N = boxes.shape[0]
    if not N:
        print("\n*** No instances to display *** \n")
    else:
        assert boxes.shape[0] == masks.shape[-1] == class_ids.shape[0]

    # If no axis is passed, create one and automatically call show()
    auto_show = False
    if not ax:
        _, ax = plt.subplots(1, figsize=figsize)
        auto_show = True

    # Generate random colors
    colors = colors or random_colors(N)

    # Show area outside image boundaries.
    height, width = image.shape[:2]
    ax.set_ylim(height + 10, -10)
    ax.set_xlim(-10, width + 10)
    ax.axis('off')
    ax.set_title(title)

    masked_image = image.astype(np.uint32).copy()
    for i in range(N):
        color = colors[i]

        # Bounding box
        if not np.any(boxes[i]):
            # Skip this instance. Has no bbox. Likely lost in image cropping.
            continue
        y1, x1, y2, x2 = boxes[i]
        if show_bbox:
            p = patches.Rectangle((x1, y1), x2 - x1, y2 - y1, linewidth=2,
                                alpha=0.7, linestyle="dashed",
                                edgecolor=color, facecolor='none')
            ax.add_patch(p)

        # Label
        if not captions:
            class_id = class_ids[i]
            score = scores[i] if scores is not None else None
            label = class_names[class_id]
            caption = "{} {:.3f}".format(label, score) if score else label
        else:
            caption = captions[i]
        ax.text(x1, y1 + 8, caption,
                color='w', size=11, backgroundcolor="none")

        # Mask
        mask = masks[:, :, i]
        if show_mask:
            masked_image = apply_mask(masked_image, mask, color)

        # Mask Polygon
        # Pad to ensure proper polygons for masks that touch image edges.
        padded_mask = np.zeros(
            (mask.shape[0] + 2, mask.shape[1] + 2), dtype=np.uint8)
        padded_mask[1:-1, 1:-1] = mask
        contours = find_contours(padded_mask, 0.5)
        for verts in contours:
            # Subtract the padding and flip (y, x) to (x, y)
            verts = np.fliplr(verts) - 1
            p = Polygon(verts, facecolor="none", edgecolor=color)
            ax.add_patch(p)
    ax.imshow(masked_image.astype(np.uint8))
    # return output
    plt.savefig("temp.png", bbox_inches="tight", pad_inches=0.0)
    # if auto_show:
    #     plt.show()


def display_differences(image,
                        gt_box, gt_class_id, gt_mask,
                        pred_box, pred_class_id, pred_score, pred_mask,
                        class_names, title="", ax=None,
                        show_mask=True, show_box=True,
                        iou_threshold=0.5, score_threshold=0.5):
    """Display ground truth and prediction instances on the same image."""
    # Match predictions to ground truth
    gt_match, pred_match, overlaps = utils.compute_matches(
        gt_box, gt_class_id, gt_mask,
        pred_box, pred_class_id, pred_score, pred_mask,
        iou_threshold=iou_threshold, score_threshold=score_threshold)
    # Ground truth = green. Predictions = red
    colors = [(0, 1, 0, .8)] * len(gt_match)\
           + [(1, 0, 0, 1)] * len(pred_match)
    # Concatenate GT and predictions
    class_ids = np.concatenate([gt_class_id, pred_class_id])
    scores = np.concatenate([np.zeros([len(gt_match)]), pred_score])
    boxes = np.concatenate([gt_box, pred_box])
    masks = np.concatenate([gt_mask, pred_mask], axis=-1)
    # Captions per instance show score/IoU
    captions = ["" for m in gt_match] + ["{:.2f} / {:.2f}".format(
        pred_score[i],
        (overlaps[i, int(pred_match[i])]
            if pred_match[i] > -1 else overlaps[i].max()))
            for i in range(len(pred_match))]
    # Set title if not provided
    title = title or "Ground Truth and Detections\n GT=green, pred=red, captions: score/IoU"
    # Display
    display_instances(
        image,
        boxes, masks, class_ids,
        class_names, scores, ax=ax,
        show_bbox=show_box, show_mask=show_mask,
        colors=colors, captions=captions,
        title=title)


def draw_rois(image, rois, refined_rois, mask, class_ids, class_names, limit=10):
    """
    anchors: [n, (y1, x1, y2, x2)] list of anchors in image coordinates.
    proposals: [n, 4] the same anchors but refined to fit objects better.
    """
    masked_image = image.copy()

    # Pick random anchors in case there are too many.
    ids = np.arange(rois.shape[0], dtype=np.int32)
    ids = np.random.choice(
        ids, limit, replace=False) if ids.shape[0] > limit else ids

    fig, ax = plt.subplots(1, figsize=(12, 12))
    if rois.shape[0] > limit:
        plt.title("Showing {} random ROIs out of {}".format(
            len(ids), rois.shape[0]))
    else:
        plt.title("{} ROIs".format(len(ids)))

    # Show area outside image boundaries.
    ax.set_ylim(image.shape[0] + 20, -20)
    ax.set_xlim(-50, image.shape[1] + 20)
    ax.axis('off')

    for i, id in enumerate(ids):
        color = np.random.rand(3)
        class_id = class_ids[id]
        # ROI
        y1, x1, y2, x2 = rois[id]
        p = patches.Rectangle((x1, y1), x2 - x1, y2 - y1, linewidth=2,
                              edgecolor=color if class_id else "gray",
                              facecolor='none', linestyle="dashed")
        ax.add_patch(p)
        # Refined ROI
        if class_id:
            ry1, rx1, ry2, rx2 = refined_rois[id]
            p = patches.Rectangle((rx1, ry1), rx2 - rx1, ry2 - ry1, linewidth=2,
                                  edgecolor=color, facecolor='none')
            ax.add_patch(p)
            # Connect the top-left corners of the anchor and proposal for easy visualization
            ax.add_line(lines.Line2D([x1, rx1], [y1, ry1], color=color))

            # Label
            label = class_names[class_id]
            ax.text(rx1, ry1 + 8, "{}".format(label),
                    color='w', size=11, backgroundcolor="none")

            # Mask
            m = utils.unmold_mask(mask[id], rois[id]
                                  [:4].astype(np.int32), image.shape)
            masked_image = apply_mask(masked_image, m, color)

    ax.imshow(masked_image)

    # Print stats
    print("Positive ROIs: ", class_ids[class_ids > 0].shape[0])
    print("Negative ROIs: ", class_ids[class_ids == 0].shape[0])
    print("Positive Ratio: {:.2f}".format(
        class_ids[class_ids > 0].shape[0] / class_ids.shape[0]))


# TODO: Replace with matplotlib equivalent?
def draw_box(image, box, color):
    """Draw 3-pixel width bounding boxes on the given image array.
    color: list of 3 int values for RGB.
    """
    y1, x1, y2, x2 = box
    image[y1:y1 + 2, x1:x2] = color
    image[y2:y2 + 2, x1:x2] = color
    image[y1:y2, x1:x1 + 2] = color
    image[y1:y2, x2:x2 + 2] = color
    return image


def display_top_masks(image, mask, class_ids, class_names, limit=4):
    """Display the given image and the top few class masks."""
    to_display = []
    titles = []
    to_display.append(image)
    titles.append("H x W={}x{}".format(image.shape[0], image.shape[1]))
    # Pick top prominent classes in this image
    unique_class_ids = np.unique(class_ids)
    mask_area = [np.sum(mask[:, :, np.where(class_ids == i)[0]])
                 for i in unique_class_ids]
    top_ids = [v[0] for v in sorted(zip(unique_class_ids, mask_area),
                                    key=lambda r: r[1], reverse=True) if v[1] > 0]
    # Generate images and titles
    for i in range(limit):
        class_id = top_ids[i] if i < len(top_ids) else -1
        # Pull masks of instances belonging to the same class.
        m = mask[:, :, np.where(class_ids == class_id)[0]]
        m = np.sum(m * np.arange(1, m.shape[-1] + 1), -1)
        to_display.append(m)
        titles.append(class_names[class_id] if class_id != -1 else "-")
    display_images(to_display, titles=titles, cols=limit + 1, cmap="Blues_r")


def plot_precision_recall(AP, precisions, recalls):
    """Draw the precision-recall curve.

    AP: Average precision at IoU >= 0.5
    precisions: list of precision values
    recalls: list of recall values
    """
    # Plot the Precision-Recall curve
    _, ax = plt.subplots(1)
    ax.set_title("Precision-Recall Curve. AP@50 = {:.3f}".format(AP))
    ax.set_ylim(0, 1.1)
    ax.set_xlim(0, 1.1)
    _ = ax.plot(recalls, precisions)


def plot_overlaps(gt_class_ids, pred_class_ids, pred_scores,
                  overlaps, class_names, threshold=0.5):
    """Draw a grid showing how ground truth objects are classified.
    gt_class_ids: [N] int. Ground truth class IDs
    pred_class_id: [N] int. Predicted class IDs
    pred_scores: [N] float. The probability scores of predicted classes
    overlaps: [pred_boxes, gt_boxes] IoU overlaps of predictions and GT boxes.
    class_names: list of all class names in the dataset
    threshold: Float. The prediction probability required to predict a class
    """
    gt_class_ids = gt_class_ids[gt_class_ids != 0]
    pred_class_ids = pred_class_ids[pred_class_ids != 0]

    plt.figure(figsize=(12, 10))
    plt.imshow(overlaps, interpolation='nearest', cmap=plt.cm.Blues)
    plt.yticks(np.arange(len(pred_class_ids)),
               ["{} ({:.2f})".format(class_names[int(id)], pred_scores[i])
                for i, id in enumerate(pred_class_ids)])
    plt.xticks(np.arange(len(gt_class_ids)),
               [class_names[int(id)] for id in gt_class_ids], rotation=90)

    thresh = overlaps.max() / 2.
    for i, j in itertools.product(range(overlaps.shape[0]),
                                  range(overlaps.shape[1])):
        text = ""
        if overlaps[i, j] > threshold:
            text = "match" if gt_class_ids[j] == pred_class_ids[i] else "wrong"
        color = ("white" if overlaps[i, j] > thresh
                 else "black" if overlaps[i, j] > 0
                 else "grey")
        plt.text(j, i, "{:.3f}\n{}".format(overlaps[i, j], text),
                 horizontalalignment="center", verticalalignment="center",
                 fontsize=9, color=color)

    plt.tight_layout()
    plt.xlabel("Ground Truth")
    plt.ylabel("Predictions")


def draw_boxes(image, boxes=None, refined_boxes=None,
               masks=None, captions=None, visibilities=None,
               title="", ax=None):
    """Draw bounding boxes and segmentation masks with different
    customizations.

    boxes: [N, (y1, x1, y2, x2, class_id)] in image coordinates.
    refined_boxes: Like boxes, but draw with solid lines to show
        that they're the result of refining 'boxes'.
    masks: [N, height, width]
    captions: List of N titles to display on each box
    visibilities: (optional) List of values of 0, 1, or 2. Determine how
        prominent each bounding box should be.
    title: An optional title to show over the image
    ax: (optional) Matplotlib axis to draw on.
    """
    # Number of boxes
    assert boxes is not None or refined_boxes is not None
    N = boxes.shape[0] if boxes is not None else refined_boxes.shape[0]

    # Matplotlib Axis
    if not ax:
        _, ax = plt.subplots(1, figsize=(12, 12))

    # Generate random colors
    colors = random_colors(N)

    # Show area outside image boundaries.
    margin = image.shape[0] // 10
    ax.set_ylim(image.shape[0] + margin, -margin)
    ax.set_xlim(-margin, image.shape[1] + margin)
    ax.axis('off')

    ax.set_title(title)

    masked_image = image.astype(np.uint32).copy()
    for i in range(N):
        # Box visibility
        visibility = visibilities[i] if visibilities is not None else 1
        if visibility == 0:
            color = "gray"
            style = "dotted"
            alpha = 0.5
        elif visibility == 1:
            color = colors[i]
            style = "dotted"
            alpha = 1
        elif visibility == 2:
            color = colors[i]
            style = "solid"
            alpha = 1

        # Boxes
        if boxes is not None:
            if not np.any(boxes[i]):
                # Skip this instance. Has no bbox. Likely lost in cropping.
                continue
            y1, x1, y2, x2 = boxes[i]
            p = patches.Rectangle((x1, y1), x2 - x1, y2 - y1, linewidth=2,
                                  alpha=alpha, linestyle=style,
                                  edgecolor=color, facecolor='none')
            ax.add_patch(p)

        # Refined boxes
        if refined_boxes is not None and visibility > 0:
            ry1, rx1, ry2, rx2 = refined_boxes[i].astype(np.int32)
            p = patches.Rectangle((rx1, ry1), rx2 - rx1, ry2 - ry1, linewidth=2,
                                  edgecolor=color, facecolor='none')
            ax.add_patch(p)
            # Connect the top-left corners of the anchor and proposal
            if boxes is not None:
                ax.add_line(lines.Line2D([x1, rx1], [y1, ry1], color=color))

        # Captions
        if captions is not None:
            caption = captions[i]
            # If there are refined boxes, display captions on them
            if refined_boxes is not None:
                y1, x1, y2, x2 = ry1, rx1, ry2, rx2
            ax.text(x1, y1, caption, size=11, verticalalignment='top',
                    color='w', backgroundcolor="none",
                    bbox={'facecolor': color, 'alpha': 0.5,
                          'pad': 2, 'edgecolor': 'none'})

        # Masks
        if masks is not None:
            mask = masks[:, :, i]
            masked_image = apply_mask(masked_image, mask, color)
            # Mask Polygon
            # Pad to ensure proper polygons for masks that touch image edges.
            padded_mask = np.zeros(
                (mask.shape[0] + 2, mask.shape[1] + 2), dtype=np.uint8)
            padded_mask[1:-1, 1:-1] = mask
            contours = find_contours(padded_mask, 0.5)
            for verts in contours:
                # Subtract the padding and flip (y, x) to (x, y)
                verts = np.fliplr(verts) - 1
                p = Polygon(verts, facecolor="none", edgecolor=color)
                ax.add_patch(p)
    ax.imshow(masked_image.astype(np.uint8))


def display_table(table):
    """Display values in a table format.
    table: an iterable of rows, and each row is an iterable of values.
    """
    html = ""
    for row in table:
        row_html = ""
        for col in row:
            row_html += "<td>{:40}</td>".format(str(col))
        html += "<tr>" + row_html + "</tr>"
    html = "<table>" + html + "</table>"
    IPython.display.display(IPython.display.HTML(html))


def display_weight_stats(model):
    """Scans all the weights in the model and returns a list of tuples
    that contain stats about each weight.
    """
    layers = model.get_trainable_layers()
    table = [["WEIGHT NAME", "SHAPE", "MIN", "MAX", "STD"]]
    for l in layers:
        weight_values = l.get_weights()  # list of Numpy arrays
        weight_tensors = l.weights  # list of TF tensors
        for i, w in enumerate(weight_values):
            weight_name = weight_tensors[i].name
            # Detect problematic layers. Exclude biases of conv layers.
            alert = ""
            if w.min() == w.max() and not (l.__class__.__name__ == "Conv2D" and i == 1):
                alert += "<span style='color:red'>*** dead?</span>"
            if np.abs(w.min()) > 1000 or np.abs(w.max()) > 1000:
                alert += "<span style='color:red'>*** Overflow?</span>"
            # Add row
            table.append([
                weight_name + alert,
                str(w.shape),
                "{:+9.4f}".format(w.min()),
                "{:+10.4f}".format(w.max()),
                "{:+9.4f}".format(w.std()),
            ])
    display_table(table)
主要修改处为:
如果阅读本文对你有用,欢迎关注点赞评论收藏呀!!!
2021年6月4日13:18:52


 428
428


 被折叠的 条评论
为什么被折叠?
被折叠的 条评论
为什么被折叠?
 到【灌水乐园】发言


