


说明
【跟月影学可视化】学习笔记。
如何用 Canvas2D 绘制带宽度的曲线?
Canvas2D 提供了相应的 API,能够绘制出不同宽度、具有特定连线方式(lineJoin)和线帽形状(lineCap)的曲线,绘制曲线非常简单。
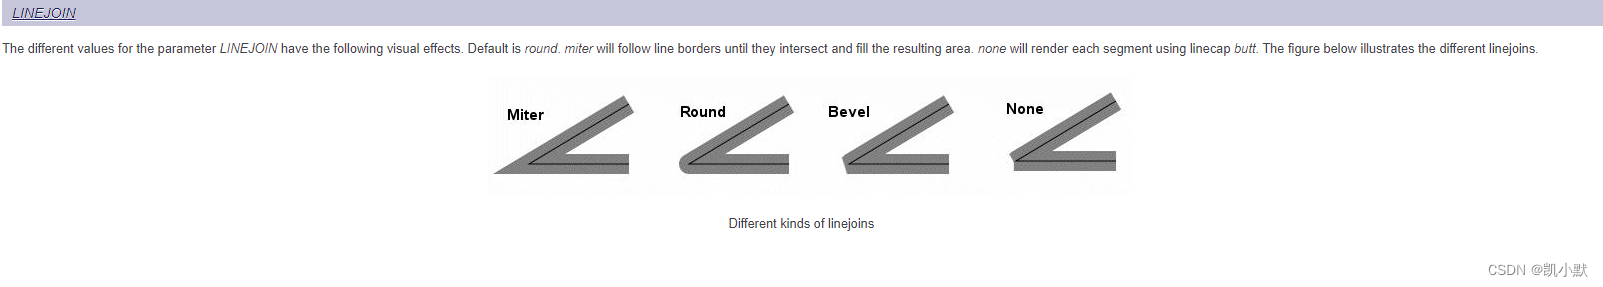
什么是连线方式(lineJoin)?
线宽超过一个像素,两个线段中间转折的部分处就会有缺口,不同的填充方式,就对应了不同的 lineJoin。
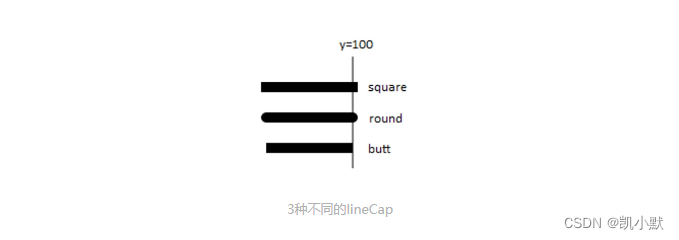
线帽形状(lineCap)?
lineCap 就是指曲线头尾部的形状。
- 第一种:
square,方形线帽,它会在线段的头尾端延长线宽的一半。 - 第二种:
round,圆弧线帽,它会在头尾端延长一个半圆。 - 第三种:
butt,不添加线帽。
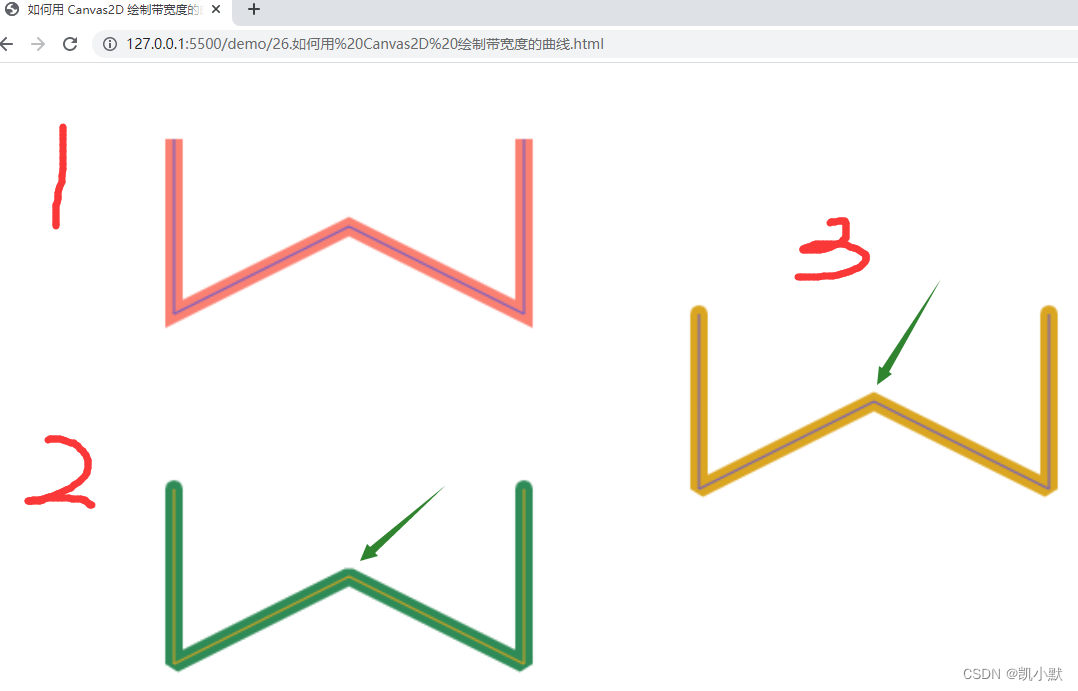
绘制曲线例子
注意:Canvas2D 的 lineJoin 只支持 miter、bevel 和 round,不支持 none。lineCap 支持 butt、square 和 round。
<!DOCTYPE html>
<html lang="en">
    <head>
        <meta charset="UTF-8" />
        <meta http-equiv="X-UA-Compatible" content="IE=edge" />
        <meta name="viewport" content="width=device-width, initial-scale=1.0" />
        <title>如何用 Canvas2D 绘制带宽度的曲线</title>
        <style>
            canvas {
                border: 1px dashed #fa8072;
            }
        </style>
    </head>
    <body>
        <canvas width="800" height="512"></canvas>
        <script type="module">
            // 设置 lineWidth、lingJoin、lineCap,然后根据 points 数据的内容设置绘图指令执行绘制。
            function drawPolyline(context, points, {lineWidth = 1, lineJoin = 'miter', lineCap = 'butt', miterLimit = 10} = {}) {
                context.lineWidth = lineWidth;
                context.lineJoin = lineJoin;
                context.lineCap = lineCap;
                // The CanvasRenderingContext2D.miterLimit 是 Canvas 2D API 设置斜接面限制比例的属性。
                // 当获取属性值时,会返回当前的值(默认值是10.0 )。
                // 当给属性赋值时,0、负数、 Infinity 和 NaN 都会被忽略;除此之外都会被赋予一个新值。
                context.miterLimit = miterLimit;
                context.beginPath();
                context.moveTo(...points[0]);
                for(let i = 1; i < points.length; i++) {
                    context.lineTo(...points[i]);
                }
                context.stroke();
            }

            const canvas = document.querySelector('canvas');
            const ctx = canvas.getContext('2d');
            // 第一组
            const points = [
                [100, 100],
                [100, 200],
                [200, 150],
                [300, 200],
                [300, 100],
            ];
            ctx.strokeStyle = 'salmon';
            drawPolyline(ctx, points, { lineWidth: 10 });
            ctx.strokeStyle = 'slateblue';
            drawPolyline(ctx, points);
            // 第二组
            const point2s = [
                [100, 300],
                [100, 400],
                [200, 350],
                [300, 400],
                [300, 300],
            ];
            ctx.strokeStyle = 'seagreen';
            drawPolyline(ctx, point2s, { lineWidth: 10, lineCap: 'round', lineJoin: 'bevel' });
            ctx.strokeStyle = 'goldenrod';
            drawPolyline(ctx, point2s);
            // 第三组
            const point3s = [
                [400, 200],
                [400, 300],
                [500, 250],
                [600, 300],
                [600, 200],
            ];
            ctx.strokeStyle = 'goldenrod';
            drawPolyline(ctx, point3s, { lineWidth: 10, lineCap: 'round', lineJoin: 'miter', miterLimit: 1.5});
            ctx.strokeStyle = 'slateblue';
            drawPolyline(ctx, point3s);
        </script>
    </body>
</html>
效果如下:图三中,两侧的转角由于超过了 miterLimit 限制,所以表现为斜角,而中间的转角因为没有超过 miterLimit 限制,所以是尖角。
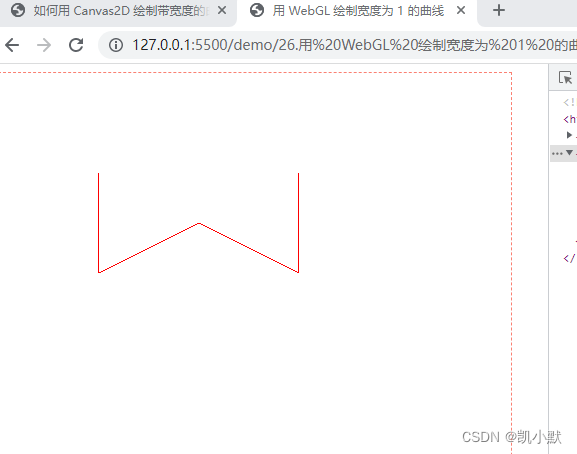
如何用 WebGL 绘制带宽度的曲线
WebGL 支持线段类的图元,LINE_STRIP 是一种图元类型,表示以首尾连接的线段方式绘制。
用 WebGL 绘制宽度为 1 的曲线
<!DOCTYPE html>
<html lang="en">
    <head>
        <meta charset="UTF-8" />
        <meta http-equiv="X-UA-Compatible" content="IE=edge" />
        <meta name="viewport" content="width=device-width, initial-scale=1.0" />
        <title>用 WebGL 绘制宽度为 1 的曲线</title>
        <style>
            canvas {
                border: 1px dashed #fa8072;
            }
        </style>
    </head>
    <body>
        <canvas width="512" height="512"></canvas>
        <script type="module">
            import { Renderer, Program, Geometry, Transform, Mesh } from './common/lib/ogl/index.mjs';

            const vertex = `
                attribute vec2 position;

                void main() {
                    gl_PointSize = 10.0;
                    float scale = 1.0 / 256.0;
                    mat3 projectionMatrix = mat3(
                        scale, 0, 0,
                        0, -scale, 0,
                        -1, 1, 1
                    );
                    vec3 pos = projectionMatrix * vec3(position, 1);
                    gl_Position = vec4(pos.xy, 0, 1);
                }
            `;


            const fragment = `
                precision highp float;
                void main() {
                    gl_FragColor = vec4(1, 0, 0, 1);
                }
            `;

            const canvas = document.querySelector('canvas');
            const renderer = new Renderer({
                canvas,
                width: 512,
                height: 512,
            });

            const gl = renderer.gl;
            gl.clearColor(1, 1, 1, 1);

            const program = new Program(gl, {
                vertex,
                fragment,
            });

            const geometry = new Geometry(gl, {
                position: {size: 2,
                data: new Float32Array(
                    [
                        100, 100,
                        100, 200,
                        200, 150,
                        300, 200,
                        300, 100,
                    ],
                )},
            });

            const scene = new Transform();
            const polyline = new Mesh(gl, {geometry, program, mode: gl.LINE_STRIP});
            polyline.setParent(scene);

            renderer.render({scene});
        </script>
    </body>
</html>
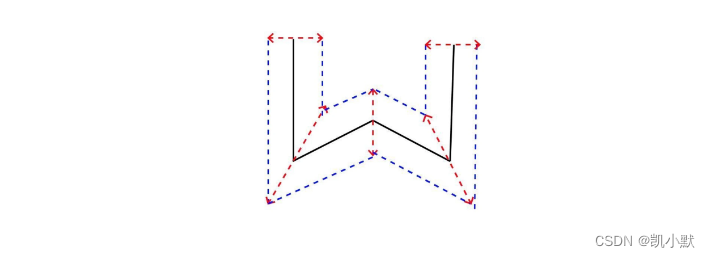
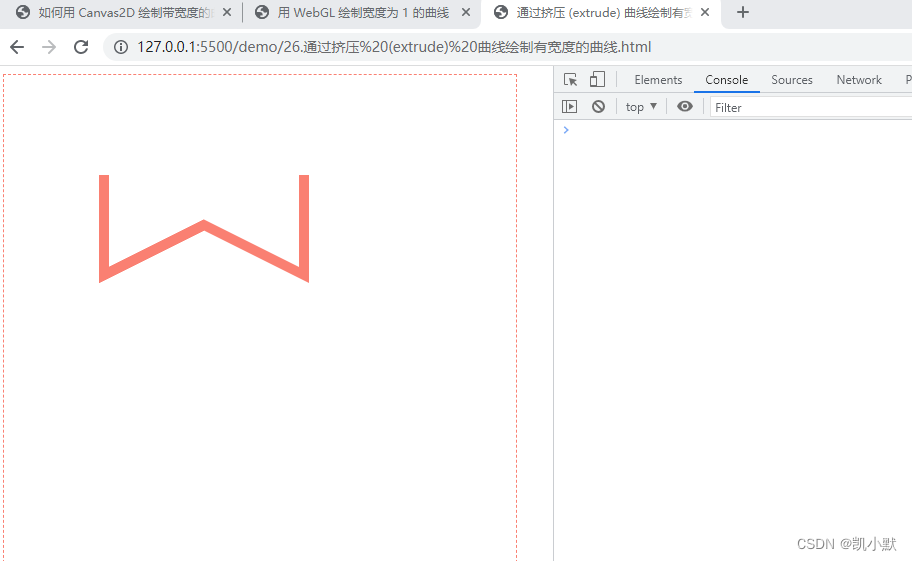
通过挤压 (extrude) 曲线绘制有宽度的曲线
挤压 (extrude) 曲线就是将曲线的顶点沿法线方向向两侧移出,让 1 个像素的曲线变宽。
大致步骤:
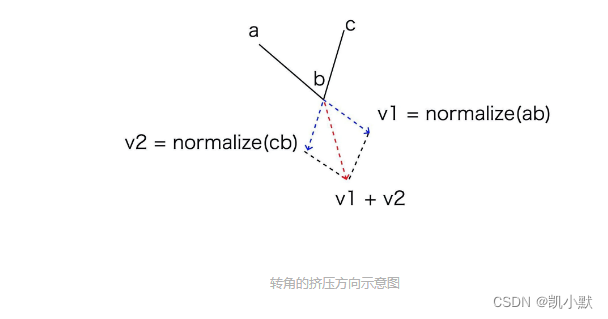
- 1、确定端点和转角的挤压方向,端点可以沿线段的法线挤压,转角则通过两条线段延长线的单位向量求和的方式获得。
- 2、确定端点和转角挤压的长度
- 端点两个方向的挤压长度是线宽 lineWidth 的一半。
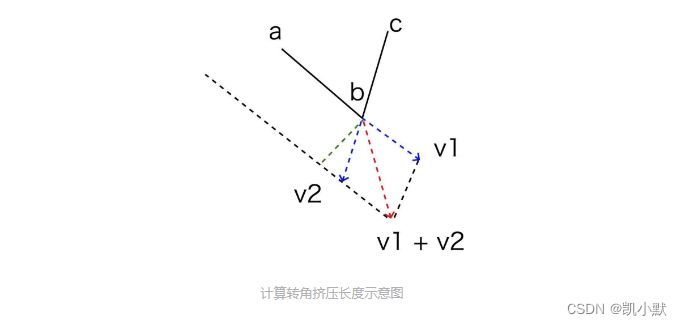
- 求转角挤压长度的时候,要先计算方向向量和线段法线的余弦,然后将线宽 lineWidth 的一半除以我们计算出的余弦值。
- 3、由步骤 1、2 计算出顶点后,我们构建三角网格化的几何体顶点数据,然后将 Geometry 对象返回。
如下图所示:
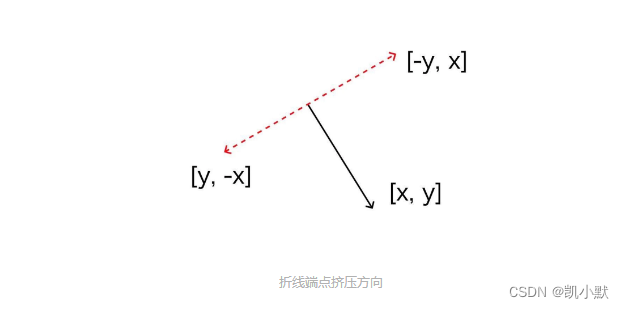
折线端点的挤压方向
顶点的两个移动方向为(-y, x)和(y, -x)。
转角的挤压方向
折线端点的挤压长度
折线端点的挤压长度等于 lineWidth 的一半。
转角的挤压长度
需要计算法线方向与挤压方向的余弦值,就能算出挤压长度
用 JavaScript 实现的代码如下所示:
function extrudePolyline(gl, points, {thickness = 10} = {}) {
    const halfThick = 0.5 * thickness;
    // 向内和向外挤压的点分别保存在 innerSide 和 outerSide 数组中。
    const innerSide = [];
    const outerSide = [];

    // 构建挤压顶点
    for(let i = 1; i < points.length - 1; i++) {
        // v1、v2 是线段的延长线,v 是挤压方向
        const v1 = (new Vec2()).sub(points[i], points[i - 1]).normalize();
        const v2 = (new Vec2()).sub(points[i], points[i + 1]).normalize();
        const v = (new Vec2()).add(v1, v2).normalize(); // 得到挤压方向
        const norm = new Vec2(-v1.y, v1.x); // 法线方向
        const cos = norm.dot(v);
        const len = halfThick / cos;
        if(i === 1) { // 起始点
            const v0 = new Vec2(...norm).scale(halfThick);
            outerSide.push((new Vec2()).add(points[0], v0));
            innerSide.push((new Vec2()).sub(points[0], v0));
        }
        v.scale(len);
        outerSide.push((new Vec2()).add(points[i], v));
        innerSide.push((new Vec2()).sub(points[i], v));
        if(i === points.length - 2) { // 结束点
            const norm2 = new Vec2(v2.y, -v2.x);
            const v0 = new Vec2(...norm2).scale(halfThick);
            outerSide.push((new Vec2()).add(points[points.length - 1], v0));
            innerSide.push((new Vec2()).sub(points[points.length - 1], v0));
        }
    }
    const count = innerSide.length * 4 - 4;
    const position = new Float32Array(count * 2);
    const index = new Uint16Array(6 * count / 4);

    // 创建 geometry 对象
    for(let i = 0; i < innerSide.length - 1; i++) {
        const a = innerSide[i],
        b = outerSide[i],
        c = innerSide[i + 1],
        d = outerSide[i + 1];

        const offset = i * 4;
        index.set([offset, offset + 1, offset + 2, offset + 2, offset + 1, offset + 3], i * 6);
        position.set([...a, ...b, ...c, ...d], i * 8);
    }

    return new Geometry(gl, {
        position: {size: 2, data: position},
        index: {data: index},
    });
}
根据 innerSide 和 outerSide 中的顶点来构建三角网格化的几何体顶点数据,最终返回 Geometry 对象来构建三角网格对象。
构建折线的顶点数据示意图:

下面实战一下:
<!DOCTYPE html>
<html lang="en">
    <head>
        <meta charset="UTF-8" />
        <meta http-equiv="X-UA-Compatible" content="IE=edge" />
        <meta name="viewport" content="width=device-width, initial-scale=1.0" />
        <title>通过挤压 (extrude) 曲线绘制有宽度的曲线</title>
        <style>
            canvas {
                border: 1px dashed #fa8072;
            }
        </style>
    </head>
    <body>
        <canvas width="512" height="512"></canvas>
        <script type="module">
            import { Renderer, Program, Geometry, Transform, Mesh, Vec2 } from './common/lib/ogl/index.mjs';

            function extrudePolyline(gl, points, {thickness = 10} = {}) {
                const halfThick = 0.5 * thickness;
                // 向内和向外挤压的点分别保存在 innerSide 和 outerSide 数组中。
                const innerSide = [];
                const outerSide = [];

                // 构建挤压顶点
                for(let i = 1; i < points.length - 1; i++) {
                    // v1、v2 是线段的延长线,v 是挤压方向
                    const v1 = (new Vec2()).sub(points[i], points[i - 1]).normalize();
                    const v2 = (new Vec2()).sub(points[i], points[i + 1]).normalize();
                    const v = (new Vec2()).add(v1, v2).normalize(); // 得到挤压方向
                    const norm = new Vec2(-v1.y, v1.x); // 法线方向
                    const cos = norm.dot(v);
                    const len = halfThick / cos;
                    if(i === 1) { // 起始点
                        const v0 = new Vec2(...norm).scale(halfThick);
                        outerSide.push((new Vec2()).add(points[0], v0));
                        innerSide.push((new Vec2()).sub(points[0], v0));
                    }
                    v.scale(len);
                    outerSide.push((new Vec2()).add(points[i], v));
                    innerSide.push((new Vec2()).sub(points[i], v));
                    if(i === points.length - 2) { // 结束点
                        const norm2 = new Vec2(v2.y, -v2.x);
                        const v0 = new Vec2(...norm2).scale(halfThick);
                        outerSide.push((new Vec2()).add(points[points.length - 1], v0));
                        innerSide.push((new Vec2()).sub(points[points.length - 1], v0));
                    }
                }
                const count = innerSide.length * 4 - 4;
                const position = new Float32Array(count * 2);
                const index = new Uint16Array(6 * count / 4);

                // 创建 geometry 对象
                for(let i = 0; i < innerSide.length - 1; i++) {
                    const a = innerSide[i],
                    b = outerSide[i],
                    c = innerSide[i + 1],
                    d = outerSide[i + 1];

                    const offset = i * 4;
                    index.set([offset, offset + 1, offset + 2, offset + 2, offset + 1, offset + 3], i * 6);
                    position.set([...a, ...b, ...c, ...d], i * 8);
                }

                return new Geometry(gl, {
                    position: {size: 2, data: position},
                    index: {data: index},
                });
            }

            const vertex = `
                attribute vec2 position;

                void main() {
                    gl_PointSize = 10.0;
                    float scale = 1.0 / 256.0;
                    mat3 projectionMatrix = mat3(
                        scale, 0, 0,
                        0, -scale, 0,
                        -1, 1, 1
                    );
                    vec3 pos = projectionMatrix * vec3(position, 1);
                    gl_Position = vec4(pos.xy, 0, 1);
                }
            `;


            const fragment = `
                precision highp float;
                void main() {
                    gl_FragColor = vec4(0.9803921568627451, 0.5019607843137255, 0.4470588235294118, 1);
                }
            `;

            const canvas = document.querySelector('canvas');
            const renderer = new Renderer({
                canvas,
                width: 512,
                height: 512,
                antialias: true,
            });

            const gl = renderer.gl;
            gl.clearColor(1, 1, 1, 1);

            const program = new Program(gl, {
                vertex,
                fragment,
            });

            const points = [
                new Vec2(100, 100),
                new Vec2(100, 200),
                new Vec2(200, 150),
                new Vec2(300, 200),
                new Vec2(300, 100),
            ];

            const geometry = extrudePolyline(gl, points, {lineWidth: 10});
            const scene = new Transform();
            const polyline = new Mesh(gl, {geometry, program});
            polyline.setParent(scene);
            renderer.render({scene});
        </script>
    </body>
</html>


 1147
1147


 被折叠的 条评论
为什么被折叠?
被折叠的 条评论
为什么被折叠?
 到【灌水乐园】发言


