


环境:华为云服务器、ubuntu22、4核16G
一、场景
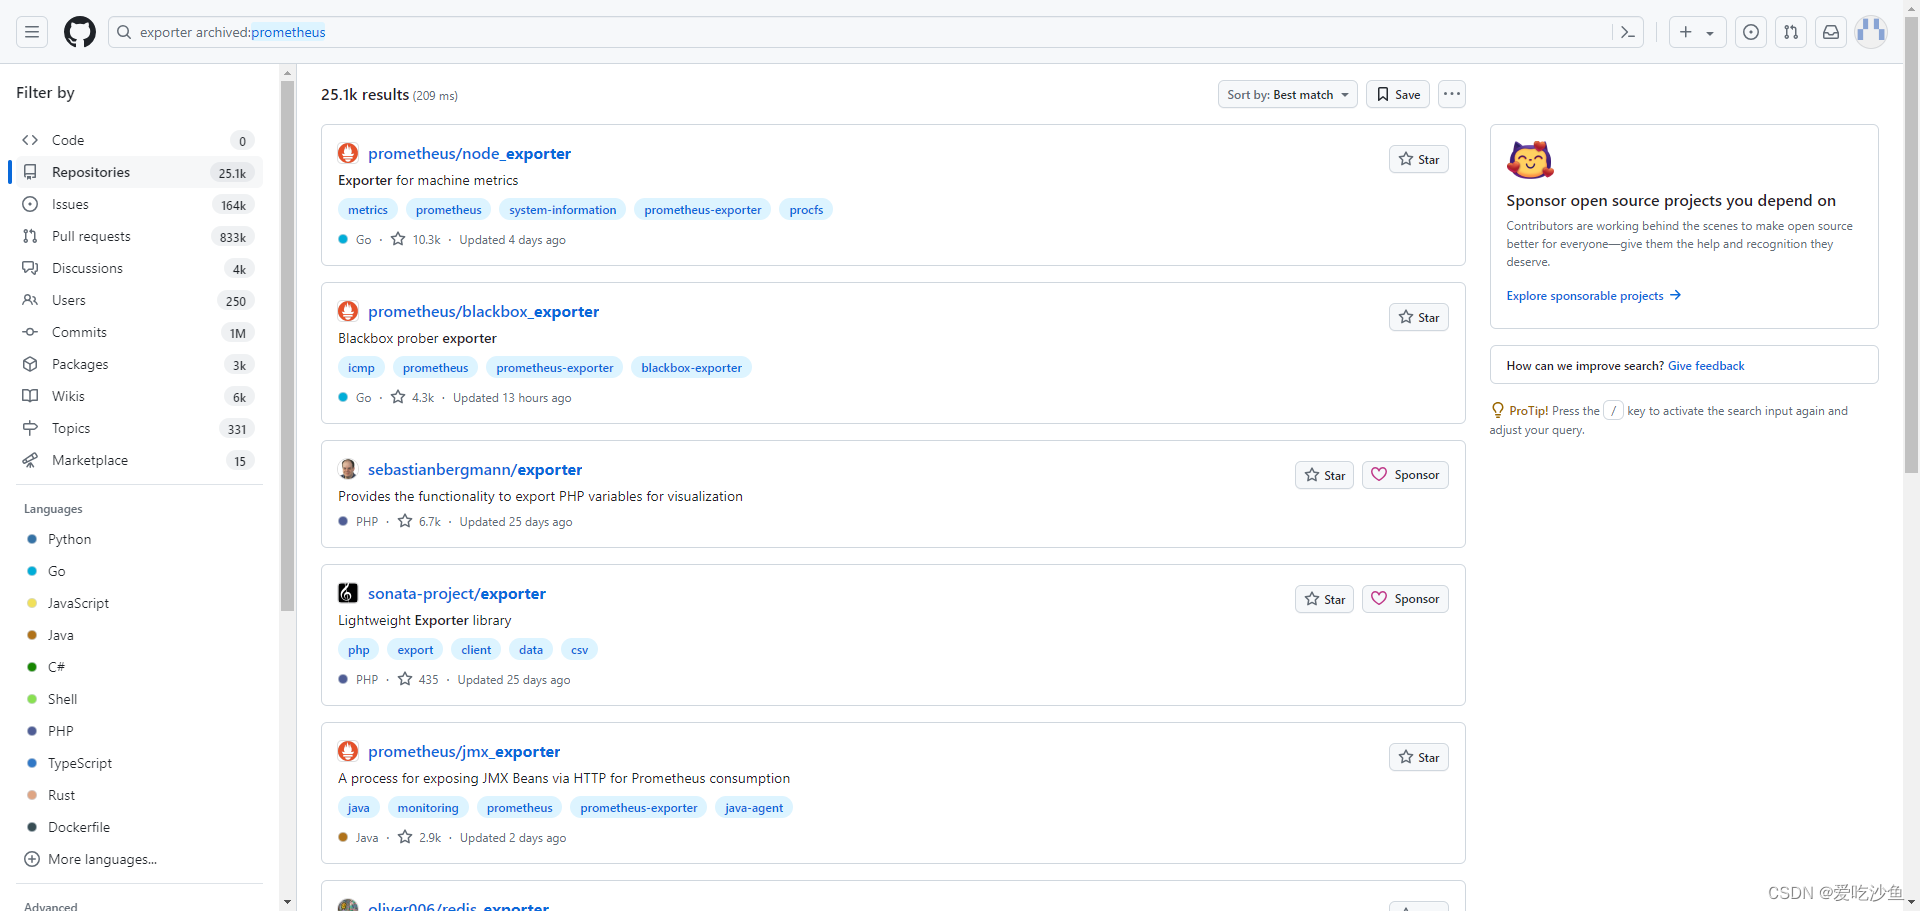
node_exporter主要用于监控服务器,监控mysql需要用到mysqld_exporter。具体可以浏览github其各种exporterhttps://github.com/orgs/prometheus/repositories?type=all
二、步骤
参考博客Prometheus+Grafana监控Mysql数据库,步骤挺详细,防止失联结合本机情况记录一下过程
1.新增一个监控用的数据库账密
root@hcss-ecs-ed4e:/www/server# mysql -h 127.0.0.1 -u root
Welcome to the MySQL monitor.  Commands end with ; or \g.
Your MySQL connection id is 17170
Server version: 8.0.35 Source distribution

Copyright (c) 2000, 2023, Oracle and/or its affiliates.

Oracle is a registered trademark of Oracle Corporation and/or its
affiliates. Other names may be trademarks of their respective
owners.

Type 'help;' or '\h' for help. Type '\c' to clear the current input statement.

mysql> use mysql
Database changed
mysql> CREATE USER 'exporter'@'%' IDENTIFIED BY 'Exporter1234!';
Query OK, 0 rows affected (0.01 sec)

mysql> grant SELECT,UPDATE,INSERT,DELETE on *.* To 'exporter'@'%';
Query OK, 0 rows affected (0.01 sec)

mysql> flush privileges;
Query OK, 0 rows affected (0.00 sec)
2.下载并解压至/usr/local/bin/目录下
wget https://github.com/prometheus/mysqld_exporter/releases/download/v0.15.1/mysqld_exporter-0.15.1.linux-amd64.tar.gz

tar xvzf mysqld_exporter-0.15.1.linux-amd64.tar.gz
mv mysqld_exporter-0.15.1.linux-amd64 /usr/local/bin/mysqld_exporter
3.切换目录至/usr/local/bin/mysqld_exporter下,新增配置文件.my-exporter.cnf
[client]

user=exporter

password=Exporter1234!

host=127.0.0.1

port=3306
4. 根据配置文件启动mysqld_exporter,并将数据暴露到9104端口,并且通过参数指定暴露的数据
./mysqld_exporter --web.listen-address=localhost:9104 --config.my-cnf=/usr/bin/mysqld_exporter/.my-exporter.cnf --collect.auto_increment.columns --collect.binlog_size --collect.global_status --collect.engine_innodb_status --collect.global_variables --collect.info_schema.innodb_metrics --collect.info_schema.innodb_tablespaces --collect.info_schema.innodb_cmp --collect.info_schema.innodb_cmpmem --collect.info_schema.processlist --collect.info_schema.query_response_time --collect.info_schema.tables --collect.info_schema.tablestats --collect.info_schema.userstats --collect.perf_schema.eventswaits --collect.perf_schema.file_events --collect.perf_schema.indexiowaits --collect.perf_schema.tableiowaits --collect.perf_schema.tablelocks
5.注册到系统服务
vim /etc/systemd/system/mysqld_exporter.service
[Unit]
Description=mysqld_exporter
After=network.target
[Service]
Type=simple
User=mysqld_exporter
ExecStart=/usr/local/bin/mysqld_exporter/mysqld_exporter --config.my-cnf=/usr/local/bin/mysqld_exporter/.my-exporter.cnf
Restart=on-failure
[Install]
WantedBy=multi-user.target
6.以服务的方式进行启动管理
# 添加用户
useradd --no-create-home --shell /bin/false mysqld_exporter
# 为用户赋予文件夹权限
chown -R mysqld_exporter:mysqld_exporter /usr/local/bin/mysqld_exporter

# 重新加载系统配置
systemctl daemon-reload
# 开机启动
systemctl enable mysqld_exporter.service
# 启动服务
systemctl start mysqld_exporter
# 查看状态
systemctl status mysqld_exporter
7.最后修改prometheus的配置文件,并重启
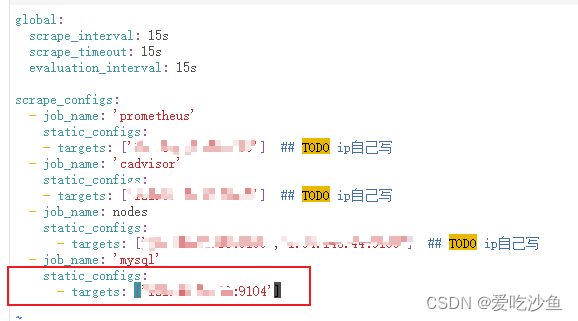
root@hcss-ecs-ed4e:/www/server/prometheus# docker restart prometheus
prometheus
8. 刷新prometheus,发现又报错了

防火墙开放9104端口给本机
root@hcss-ecs-ed4e:/# ufw allow from 本机ip地址 to any port 9104 proto tcp
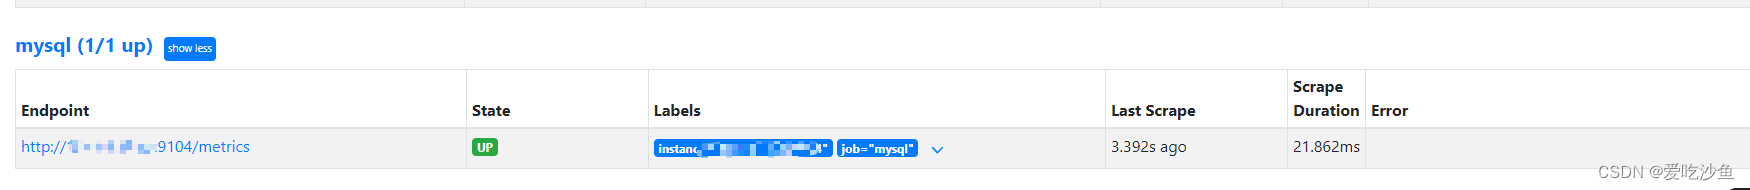
Rule added再次刷新Prometheus,状态变为up
简单跑个压测脚本看看数据库情况:

三、常用exporter配置和安装参考
防止失联这里简单记录一下各exporter地址
node_exporter
Releases · prometheus/node_exporter · GitHub
elasticsearch_exporter Releases · prometheus-community/elasticsearch_exporter · GitHub
redis_exporter
Releases · oliver006/redis_exporter · GitHub
rabbitmq_exporter
Releases · kbudde/rabbitmq_exporter · GitHub
kafka_exporter
GitHub - danielqsj/kafka_exporter: Kafka exporter for Prometheus


 1268
1268


 被折叠的 条评论
为什么被折叠?
被折叠的 条评论
为什么被折叠?
 到【灌水乐园】发言


