


参考:http://chiffon.gitcafe.io/2014/12/28/cluster-analysis.html
聚类算法可以分为:中心点方法、层次聚类方法、基于密度方法、基于网格、基于模型方法。
其中最为经典的是K-means算法
K-means
K-means属于中心点方法(也有叫划分方法),算法经典简单。
算法
- 人工选取K值,并选取K个点作为K个簇的质心
- 对所有样本分别计算到K个簇的质心的距离(欧式或者曼哈顿),取最近距离的质心,并将该样本归于最近质心所在的簇。
- 更新K个簇的质心
- Until质心位置不再发生变化(也就是每个簇中的样本不再发生变化)
算法的复杂度为O(tnK),t代表迭代次数,n代表样本个数,K代表簇个数。由此看来它的复杂度只和样本大小线性相关,因此是一种非常有效的大数据聚类算法。
问题
K-means存在几个问题:1、对聚类中心的初始化比较敏感,不同的初始化带来不同的聚类结果。2、K值需要首先人工确定(启发式)。3、只能处理服从标准正太分布的聚类。4、K-means对于噪声比较敏感。
如何设置K值和如何选择初始簇的K个点可以参考
对于非标准正太分布和非均匀分布样本集合聚类时,可以使用Kernel K-means和谱聚类Spectral Clustering。
对于噪声的处理,可以使用K-mediods。这是一种K-means的简单改进,区别在于对于质心的选择。K-means的质心是同簇下所有点的平均值,K-mediods则将簇中的某点选为质心,条件是此点到簇内其他点距离和最小。
仿真实验
from numpy import *
#select k sample using kmeans++
def initCent(dataSet,k):
    numSamples,dim=dataSet.shape
    indexlist=[int(random.uniform(0,numSamples))]
    loop=1
    while loop<k:
        maxD=0
        maxIndex=0
        for i in xrange(numSamples):
            d=0
            for j in indexlist:
                d+=eucleanDistance(dataSet[j],dataSet[i])
            if d>maxD:
                maxD=d
                maxIndex=i
        loop+=1
        indexlist.append(maxIndex)
    centroids=zeros((k,dim))
    for i in range(k):
        centroids[i]=dataSet[indexlist[i]]
    return centroids


#random select k sample
def initRandomCent(dataSet,k):
    numSamples,dim=dataSet.shape
    centroids=zeros((k,dim))
    for i in range(k):
        index=int(random.uniform(0,numSamples))
        centroids[i,:]=dataSet[index,:]
    return centroids

def eucleanDistance(x1,x2):
    return sqrt(sum(power(x1-x2,2)))


def kmeans(dataSet,k):
    numSamples,dim=dataSet.shape
    clusterAssment=zeros(numSamples)

    #random select k sample
    #centroids=initRandomCent(dataSet,k)
    centroids=initCent(dataSet,k)
    clusterChanged=True

    count=0
    while clusterChanged:
        clusterChanged=False

        #go through all samples
        for i in xrange(numSamples):
            minDist=float('inf')
            minIndex=0
            #get the minDistance and which cluster belong to
            for j in range(k):
                distance=eucleanDistance(centroids[j,:],dataSet[i,:])
                if distance<minDist:
                    minDist=distance
                    minIndex=j
            #update cluster infomation: cluster center , distance
            if clusterAssment[i]!=minIndex:
                clusterChanged=True
                clusterAssment[i]=minIndex

        #go through k cluster
        for j in range(k):
            #get cluster j dataSet
            pointsInCluster=dataSet[nonzero(clusterAssment[:]==j)[0]]
            centroids[j,:]=mean(pointsInCluster,axis=0)
        count+=1
    print 'iterate:%d' % count
    return centroids,clusterAssment

from skimage import io,color
from scipy import misc
import matplotlib.pyplot as plt
rgb=io.imread('E:\BaiduYunDownload\ML\project\city.jpg')
rows=rgb.shape[0]
cols=rgb.shape[1]
lab=color.rgb2lab(rgb)
ab=lab[:,:,1:3]
plt.figure(figsize(10,10))
plt.subplot(2,2,1)
plt.imshow(rgb)
plt.subplot(2,2,2)
plt.scatter(ab[:,:,0],ab[:,:,1],10)

k=5
centroids,clusterAssment=kmeans(ab.reshape(ab.shape[0]*ab.shape[1],ab.shape[2]),k)
plt.subplot(2,2,3)
plt.scatter(ab[:,:,0],ab[:,:,1],10)
plt.scatter(centroids[:,0],centroids[:,1],20,color='r')

rgblabel=color.label2rgb(clusterAssment.reshape(rows,cols))
plt.subplot(2,2,4)
plt.imshow(rgblabel)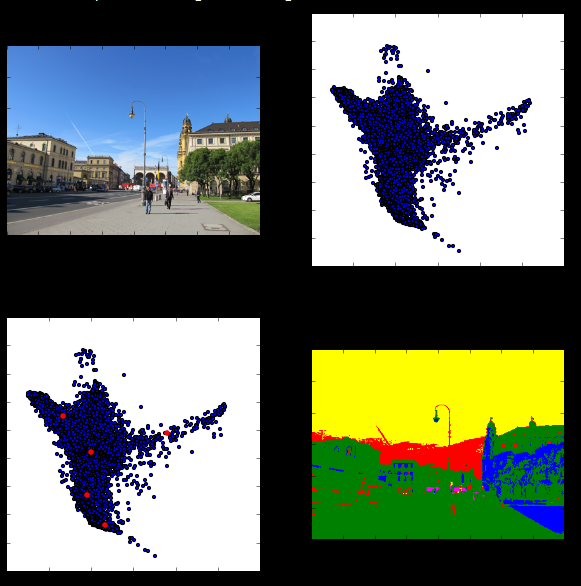
二分K-means聚类
Kernel K-means
Spectral Clustering


 1万+
1万+

 被折叠的 条评论
为什么被折叠?
被折叠的 条评论
为什么被折叠?
 到【灌水乐园】发言


