


前言
Proms Operator 添加自定义监控可以通过如下两种方式实现,本文是 additional 方式。
- additional 方式
- serviceMonitor方式
官网
安装参考这个专栏里以前的博文。
##
https://github.com/prometheus-operator/kube-prometheus#quickstart
按照官网的部署,这个方式部署起来的prometheus还有很多的缺陷,不能直接用于生产环境使用,具体问题点如下:
官网
##
https://github.com/prometheus-operator/prometheus-operator/blob/main/Documentation/additional-scrape-config.md
vim prometheus-prometheus.yaml
末尾添加:
  additionalScrapeConfigs:
    name: additional-scrape-configs
    key: prometheus-additional.yaml
vim prometheus-additional.yaml
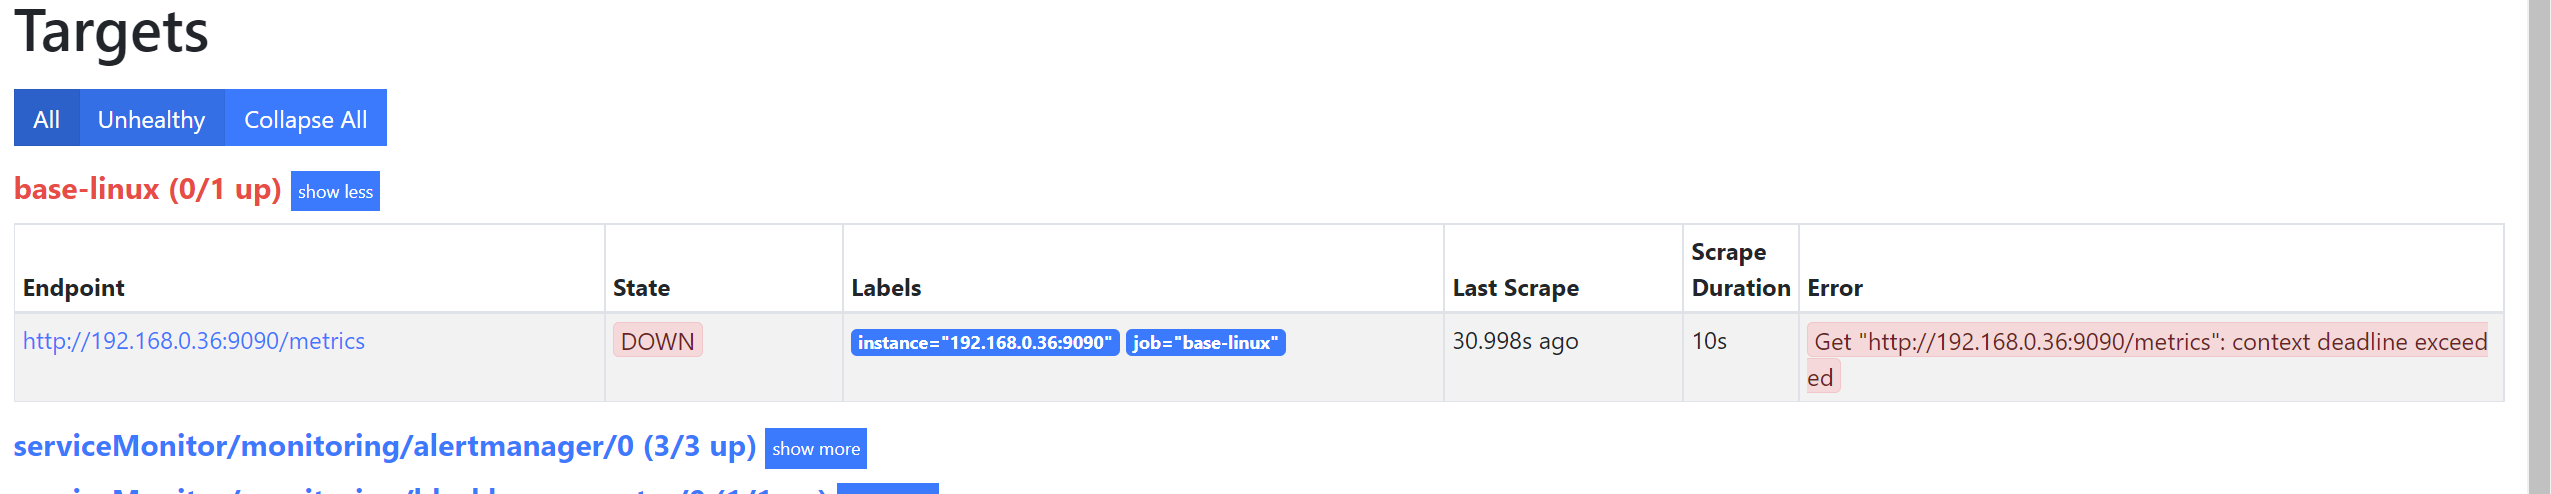
- job_name: "base-linux"
  static_configs:
  - targets: ["192.168.0.36:9090","192.168.0.11:9090"]

- job_name: "kafka-explorer"
  static_configs:
  - targets: ["192.168.0.11:9000"]
添加secret
kubectl create secret generic additional-scrape-configs --from-file=prometheus-additional.yaml --dry-run=client -oyaml > additional-scrape-configs.yaml
Next, apply the generated kubernetes manifest
##
kubectl apply -f additional-scrape-configs.yaml -n monitoring
查看
如何删除 target ?
kubectl delete secret additional-configs -n monitoring

kubectl delete secret additional-scrape-configs -n monitoring
如何更新target?
## 重新生成
kubectl create secret generic additional-scrape-configs --from-file=prometheus-additional.yaml --dry-run=client -oyaml > additional-scrape-configs.yaml


## 应用
kubectl apply -f additional-scrape-configs.yaml -n monitoring


 2347
2347

 被折叠的 条评论
为什么被折叠?
被折叠的 条评论
为什么被折叠?
 到【灌水乐园】发言


