


一、代码封装
var pie = function (options) {
var option = {
backgroundColor: "#fff",
//不显示标题
title: {
show: false,
text: options.title,
textStyle: {
fontSize: 24 * iWidth / 720,
color: "#36383c",
fontWeight: "normal",
fontFamily: "Microsoft Yahei"
},
left: 20 * iWidth / 720,
top: 20 * iWidth / 720,
},
grid: {
top: 0 * iWidth / 720,
left: '50%',
right: '50%',
bottom: 45 * iWidth / 720
},
//鼠标放上去提示
// tooltip: {
// trigger: 'item',
// formatter: "{a} <br/>{b}: {c} ({d}%)"
// },
legend: {
orient: 'vertical',
left: 180 * iWidth / 720,
top: "middle",
icon: 'circle',
itemGap: 20 * iWidth / 720,
textStyle: {
fontSize: 16 * iWidth / 720,
color: "#91989e",
fontWeight: "normal",
fontFamily: "Microsoft Yahei"
},
//图例不能点击
selectedMode: false,
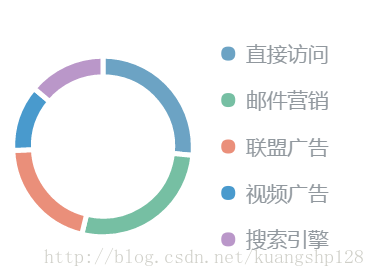
data: options.legendData
},
series: [
{
name: '访问来源',
type: 'pie',
center: ["28%", "50%"],
radius: [54 * iWidth / 720, 70 * iWidth / 720],
top: "50%",
avoidLabelOverlap: false,
label: {
normal: {
show: false,
position: 'center'
},
//鼠标移上去中间显示文字
emphasis: {
show: false,
textStyle: {
fontSize: 30 * iWidth / 720,
color: "#91989e",
fontWeight: "normal",
fontFamily: "Microsoft Yahei"
}
}
},
labelLine: {
normal: {
show: false
}
},
data: [],
}
]
};
//如果是大图设置样式
if(options.isBig){
option.legend.left = 300 * iWidth / 720;
}
//重组数据
(function () {
options.seriesData.map(function (item, index) {
option.series[0].data.push({
value: item.value,
name: item.name,
itemStyle: {
normal: {
color: colorGroup[index % colorGroupLen],
//中间间隔
borderColor: '#fff',
borderType: 'solid',
borderWidth: 5
}
}
})
})
})();
return option;
}


 3689
3689

 被折叠的 条评论
为什么被折叠?
被折叠的 条评论
为什么被折叠?
 到【灌水乐园】发言


