


背景:
前面文章有对Winscope的Transaction的数据手机等进行了源码分析,今天来继续对Winscope中抓取Window相关的信息进行深入剖析
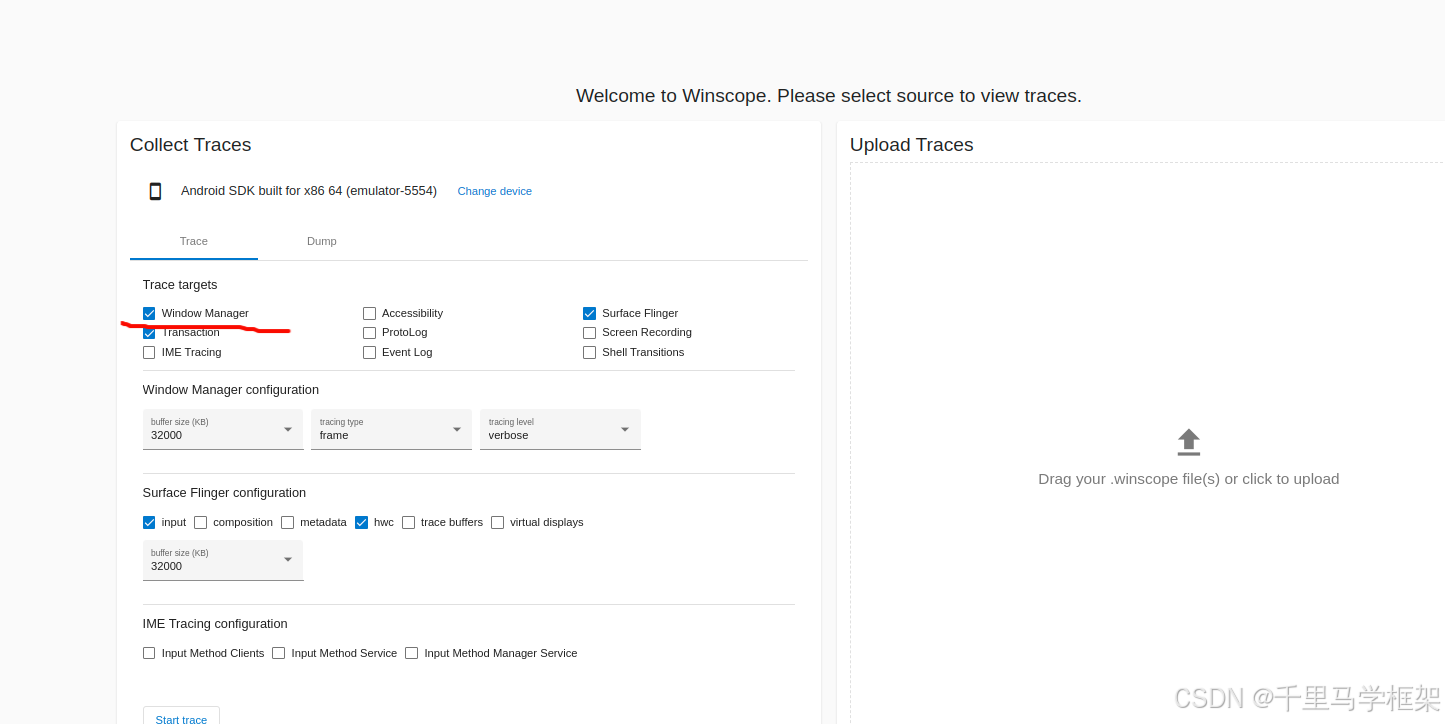 首先切入点可以从触发window相关Winscope的命令进行入手:
adb shell cmd window tracing start  --开启抓取

adb shell cmd window tracing stop  --结束抓取
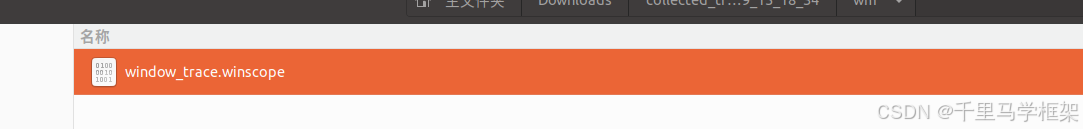
使用命令抓取后成果:
源码分析:
触发window相关Winscope的命令:
adb shell cmd window tracing start
这里会调用到WindowManagerService的onShellCommand方法:
frameworks/base/services/core/java/com/android/server/wm/WindowManagerService.java
@Override
public void onShellCommand(FileDescriptor in, FileDescriptor out, FileDescriptor err,
        String[] args, ShellCallback callback, ResultReceiver result) {
    new WindowManagerShellCommand(this).exec(this, in, out, err, args, callback, result);
}
然后主要看看WindowManagerShellCommand的相关的方法
frameworks/base/services/core/java/com/android/server/wm/WindowManagerShellCommand.java
@Override
    public int onCommand(String cmd) {
        if (cmd == null) {
            return handleDefaultCommands(cmd);
        }
        final PrintWriter pw = getOutPrintWriter();
        try {
            switch (cmd) {
                case "size":
                    return runDisplaySize(pw);
                case "density":
                    return runDisplayDensity(pw);
                case "folded-area":
                    return runDisplayFoldedArea(pw);
                case "scaling":
                    return runDisplayScaling(pw);
                case "dismiss-keyguard":
                    return runDismissKeyguard(pw);
                case "tracing":
                    // XXX this should probably be changed to use openFileForSystem() to create
                    // the output trace file, so the shell gets the correct semantics for where
                    // trace files can be written.
                    return mInternal.mWindowTracing.onShellCommand(this);
                    //省略
                    }
}
这里调用到了WindowManagerShellCommand的onCommand,走到了"tracing"分支,即最后调用到了mWindowTracing.onShellCommand方法
frameworks/base/services/core/java/com/android/server/wm/WindowTracing.java
    int onShellCommand(ShellCommand shell) {
        PrintWriter pw = shell.getOutPrintWriter();
        String cmd = shell.getNextArgRequired();
        switch (cmd) {
            case "start":
                startTrace(pw);
                return 0;
            case "stop":
                stopTrace(pw);
                return 0;
                //省略
                }
}
下面看看 startTrace(pw)方法:
void startTrace(@Nullable PrintWriter pw) {
    synchronized (mEnabledLock) {
        ProtoLogImpl.getSingleInstance().startProtoLog(pw);
        logAndPrintln(pw, "Start tracing to " + mTraceFile + ".");
        mBuffer.resetBuffer();//把mBuffer清空
        mEnabled = mEnabledLockFree = true;
    }
    log("trace.enable");//这里是主要的核心方法会往mBuffer填入数据
}
可以看到startTrace主要干的事:
1、清空mBuffer,及一些标志位mEnabled为true
2、使用log往mBuffer填入数据
下面重点看看log方法
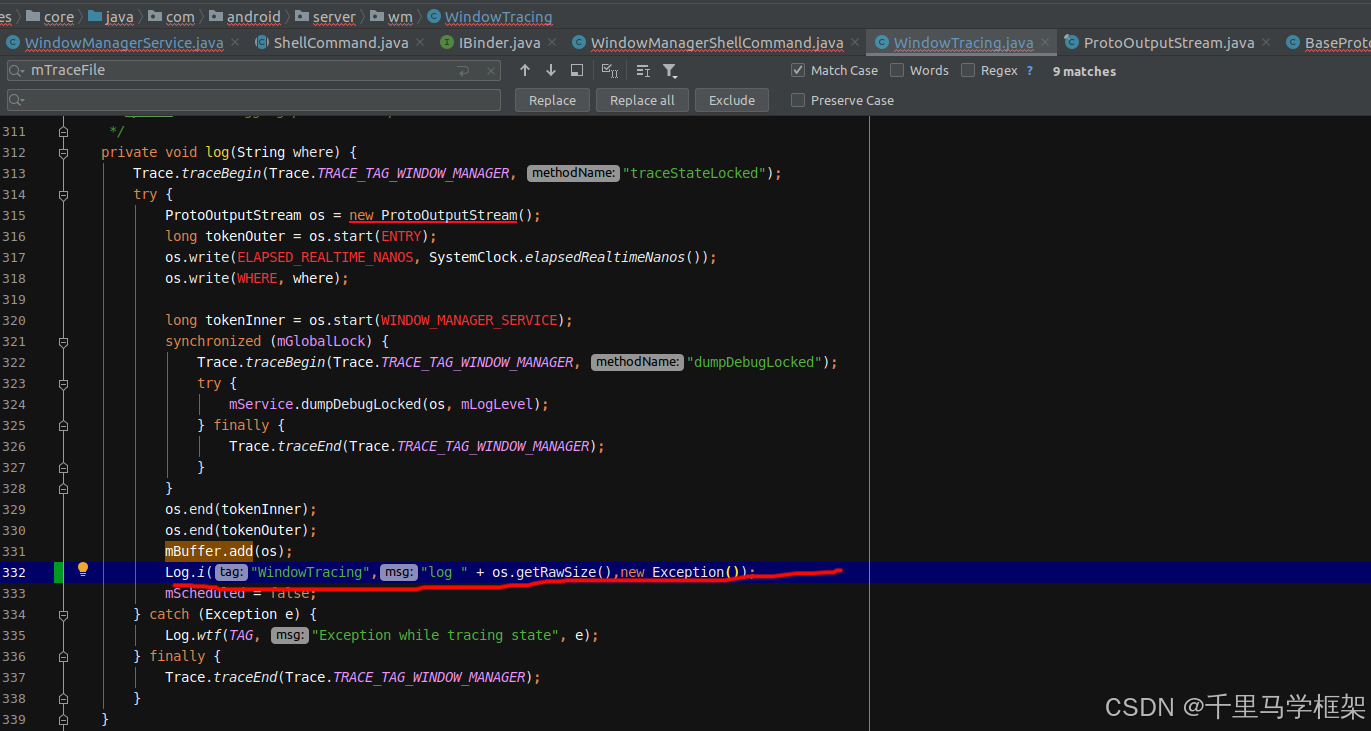
/**
     * Write the current frame to the buffer
     *
     * @param where Logging point descriptor
     */
    private void log(String where) {
        Trace.traceBegin(Trace.TRACE_TAG_WINDOW_MANAGER, "traceStateLocked");
        try {
            ProtoOutputStream os = new ProtoOutputStream();
            long tokenOuter = os.start(ENTRY);
            os.write(ELAPSED_REALTIME_NANOS, SystemClock.elapsedRealtimeNanos());
            os.write(WHERE, where);

            long tokenInner = os.start(WINDOW_MANAGER_SERVICE);
            synchronized (mGlobalLock) {
                Trace.traceBegin(Trace.TRACE_TAG_WINDOW_MANAGER, "dumpDebugLocked");
                try {
                    mService.dumpDebugLocked(os, mLogLevel);//这里是核心,把WindowManagerService相关的数据填入到了os
                } finally {
                    Trace.traceEnd(Trace.TRACE_TAG_WINDOW_MANAGER);
                }
            }
            os.end(tokenInner);
            os.end(tokenOuter);
            mBuffer.add(os);//os数据丢入mBuffer
            mScheduled = false;
        } catch (Exception e) {
            Log.wtf(TAG, "Exception while tracing state", e);
        } finally {
            Trace.traceEnd(Trace.TRACE_TAG_WINDOW_MANAGER);
        }
    }
可以看出log方法主要就是WindowManagerService会dumpDebugLocked进入os,os数据放入mBuffer,那么重点就是dumpDebugLocked方法:
frameworks/base/services/core/java/com/android/server/wm/WindowManagerService.java
/**
     * Write to a protocol buffer output stream. Protocol buffer message definition is at
     * {@link com.android.server.wm.WindowManagerServiceDumpProto}.
     *
     * @param proto     Stream to write the WindowContainer object to.
     * @param logLevel  Determines the amount of data to be written to the Protobuf.
     */
    void dumpDebugLocked(ProtoOutputStream proto, @WindowTraceLogLevel int logLevel) {
        mPolicy.dumpDebug(proto, POLICY);
        mRoot.dumpDebug(proto, ROOT_WINDOW_CONTAINER, logLevel);//这里把所有WindowContainer数据都会进行dump
        final DisplayContent topFocusedDisplayContent = mRoot.getTopFocusedDisplayContent();
        if (topFocusedDisplayContent.mCurrentFocus != null) {
            topFocusedDisplayContent.mCurrentFocus.writeIdentifierToProto(proto, FOCUSED_WINDOW);
        }
        if (topFocusedDisplayContent.mFocusedApp != null) {
            topFocusedDisplayContent.mFocusedApp.writeNameToProto(proto, FOCUSED_APP);
        }
        final WindowState imeWindow = mRoot.getCurrentInputMethodWindow();
        if (imeWindow != null) {
            imeWindow.writeIdentifierToProto(proto, INPUT_METHOD_WINDOW);
        }
        proto.write(DISPLAY_FROZEN, mDisplayFrozen);
        proto.write(FOCUSED_DISPLAY_ID, topFocusedDisplayContent.getDisplayId());
        proto.write(HARD_KEYBOARD_AVAILABLE, mHardKeyboardAvailable);

        // This is always true for now since we still update the window frames at the server side.
        // Once we move the window layout to the client side, this can be false when we are waiting
        // for the frames.
        proto.write(WINDOW_FRAMES_VALID, true);

        // Write the BackNavigationController's state into the protocol buffer
        mAtmService.mBackNavigationController.dumpDebug(proto, BACK_NAVIGATION);
    }
可以看出来这里会有一个很重要的 mRoot.dumpDebug,mRoot就是RootWindowContainer,它会迭代dump出来整个wms层级结构的所有数据的详细信息,这样也是浏览器上可以绘制层级结构详细信息的关键。
更新数据时机:
因为Winscope是一个动态的过程,属于数据是不断变化的而上面只是开始抓取时候有往mBuffer中添加,那么是什么地方可以触发这个WindowTracing源源不断的打入log,即添加到mBuffer中?这里就需要加入相关堆栈追踪
每次在WindowManagerService.closeSurfaceTransaction时候就触发输入新的数据,相关堆栈如下:
11-30 11:32:12.809   489   511 I WindowTracing: log 24135
11-30 11:32:12.809   489   511 I WindowTracing: java.lang.Exception
11-30 11:32:12.809   489   511 I WindowTracing: 	at com.android.server.wm.WindowTracing.log(WindowTracing.java:332)
11-30 11:32:12.809   489   511 I WindowTracing: 	at com.android.server.wm.WindowTracing.logState(WindowTracing.java:291)
11-30 11:32:12.809   489   511 I WindowTracing: 	at com.android.server.wm.WindowManagerService.closeSurfaceTransaction(WindowManagerService.java:1075)
11-30 11:32:12.809   489   511 I WindowTracing: 	at com.android.server.wm.RootWindowContainer.performSurfacePlacementNoTrace(RootWindowContainer.java:799)
11-30 11:32:12.809   489   511 I WindowTracing: 	at com.android.server.wm.RootWindowContainer.performSurfacePlacement(RootWindowContainer.java:756)
11-30 11:32:12.809   489   511 I WindowTracing: 	at com.android.server.wm.WindowSurfacePlacer.performSurfacePlacementLoop(WindowSurfacePlacer.java:177)
11-30 11:32:12.809   489   511 I WindowTracing: 	at com.android.server.wm.WindowSurfacePlacer.performSurfacePlacement(WindowSurfacePlacer.java:126)
11-30 11:32:12.809   489   511 I WindowTracing: 	at com.android.server.wm.WindowSurfacePlacer.performSurfacePlacement(WindowSurfacePlacer.java:115)
11-30 11:32:12.809   489   511 I WindowTracing: 	at com.android.server.wm.WindowSurfacePlacer$Traverser.run(WindowSurfacePlacer.java:57)
11-30 11:32:12.809   489   511 I WindowTracing: 	at android.os.Handler.handleCallback(Handler.java:958)
11-30 11:32:12.809   489   511 I WindowTracing: 	at android.os.Handler.dispatchMessage(Handler.java:99)
11-30 11:32:12.809   489   511 I WindowTracing: 	at android.os.Looper.loopOnce(Looper.java:205)
11-30 11:32:12.809   489   511 I WindowTracing: 	at android.os.Looper.loop(Looper.java:294)
11-30 11:32:12.809   489   511 I WindowTracing: 	at android.os.HandlerThread.run(HandlerThread.java:67)
11-30 11:32:12.809   489   511 I WindowTracing: 	at com.android.server.ServiceThread.run(ServiceThread.java:46)
11-30 11:32:12.819   489   511 I WindowTracing: log 24120
11-30 11:32:12.819   489   511 I WindowTracing: java.lang.Exception
11-30 11:32:12.819   489   511 I WindowTracing: 	at com.android.server.wm.WindowTracing.log(WindowTracing.java:332)
11-30 11:32:12.819   489   511 I WindowTracing: 	at com.android.server.wm.WindowTracing.logState(WindowTracing.java:291)
11-30 11:32:12.819   489   511 I WindowTracing: 	at com.android.server.wm.WindowManagerService.closeSurfaceTransaction(WindowManagerService.java:1075)
11-30 11:32:12.819   489   511 I WindowTracing: 	at com.android.server.wm.WindowAnimator.animate(WindowAnimator.java:198)
11-30 11:32:12.819   489   511 I WindowTracing: 	at com.android.server.wm.WindowAnimator.lambda$new$1(WindowAnimator.java:99)
11-30 11:32:12.819   489   511 I WindowTracing: 	at com.android.server.wm.WindowAnimator.$r8$lambda$aHNu1uhcqxihX5NZc4McDDQPAyw(WindowAnimator.java:0)
11-30 11:32:12.819   489   511 I WindowTracing: 	at com.android.server.wm.WindowAnimator$$ExternalSyntheticLambda1.doFrame(R8$$SyntheticClass:0)
11-30 11:32:12.819   489   511 I WindowTracing: 	at android.view.Choreographer$CallbackRecord.run(Choreographer.java:1337)
11-30 11:32:12.819   489   511 I WindowTracing: 	at android.view.Choreographer$CallbackRecord.run(Choreographer.java:1348)
11-30 11:32:12.819   489   511 I WindowTracing: 	at android.view.Choreographer.doCallbacks(Choreographer.java:952)
11-30 11:32:12.819   489   511 I WindowTracing: 	at android.view.Choreographer.doFrame(Choreographer.java:878)
11-30 11:32:12.819   489   511 I WindowTracing: 	at android.view.Choreographer$FrameDisplayEventReceiver.run(Choreographer.java:1322)
11-30 11:32:12.819   489   511 I WindowTracing: 	at android.os.Handler.handleCallback(Handler.java:958)
11-30 11:32:12.819   489   511 I WindowTracing: 	at android.os.Handler.dispatchMessage(Handler.java:99)
11-30 11:32:12.819   489   511 I WindowTracing: 	at android.os.Looper.loopOnce(Looper.java:205)
11-30 11:32:12.819   489   511 I WindowTracing: 	at android.os.Looper.loop(Looper.java:294)
11-30 11:32:12.819   489   511 I WindowTracing: 	at android.os.HandlerThread.run(HandlerThread.java:67)
11-30 11:32:12.819   489   511 I WindowTracing: 	at com.android.server.ServiceThread.run(ServiceThread.java:46)
结束部分分析:
结束命令:
adb shell cmd window tracing stop --结束抓取
也会执行到WindowTracing的onShellCommand方法中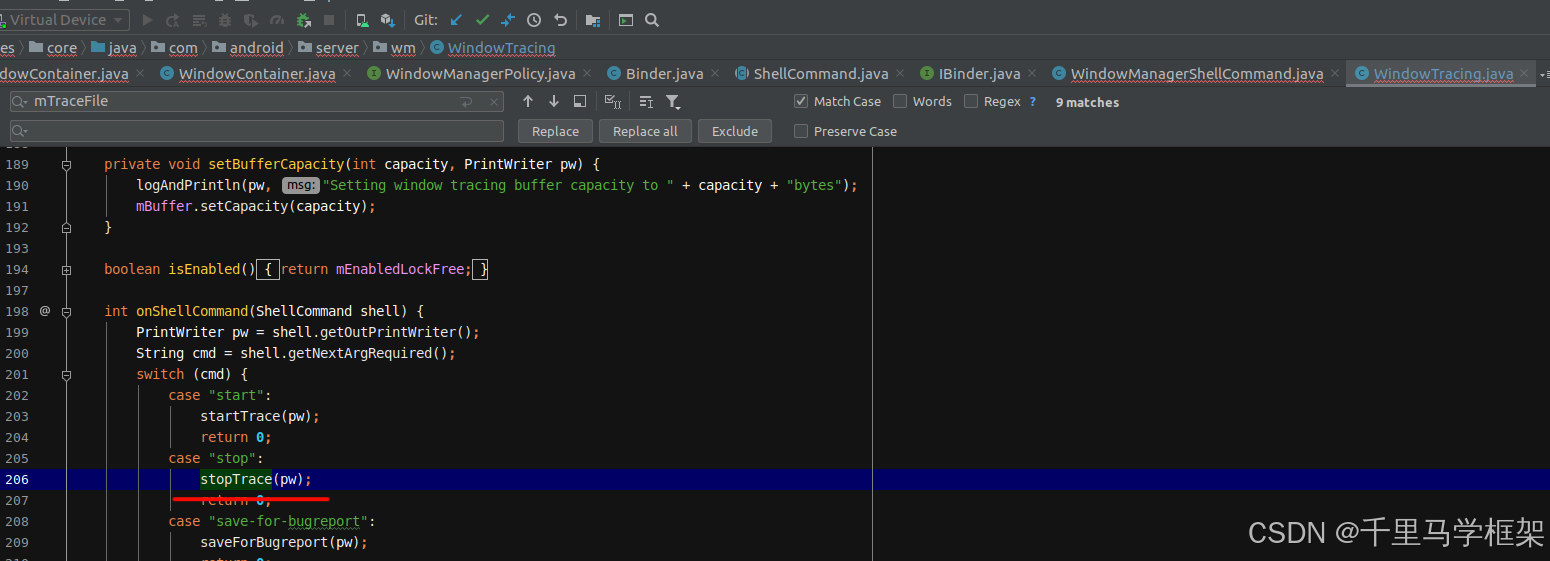
执行到如下代码:
 /**
     * Stops the trace and write the current buffer to disk
     * @param pw Print writer
     */
    void stopTrace(@Nullable PrintWriter pw) {
        if (IS_USER) {
            logAndPrintln(pw, "Error: Tracing is not supported on user builds.");
            return;
        }
        synchronized (mEnabledLock) {
            logAndPrintln(pw, "Stop tracing to " + mTraceFile + ". Waiting for traces to flush.");
            mEnabled = mEnabledLockFree = false;

            if (mEnabled) {
                logAndPrintln(pw, "ERROR: tracing was re-enabled while waiting for flush.");
                throw new IllegalStateException("tracing enabled while waiting for flush.");
            }
            writeTraceToFileLocked();//这里是核心,把数据写入到文件
            logAndPrintln(pw, "Trace written to " + mTraceFile + ".");
        }
        ProtoLogImpl.getSingleInstance().stopProtoLog(pw, true);
    }
这里重点看看writeTraceToFileLocked方法:
  /**
     * Writes the trace buffer to disk. This method has no internal synchronization and should be
     * externally synchronized
     */
    private void writeTraceToFileLocked() {
        try {
            Trace.traceBegin(Trace.TRACE_TAG_WINDOW_MANAGER, "writeTraceToFileLocked");
            ProtoOutputStream proto = new ProtoOutputStream();
            proto.write(MAGIC_NUMBER, MAGIC_NUMBER_VALUE);
            long timeOffsetNs =
                    TimeUnit.MILLISECONDS.toNanos(System.currentTimeMillis())
                    - SystemClock.elapsedRealtimeNanos();
            proto.write(REAL_TO_ELAPSED_TIME_OFFSET_NANOS, timeOffsetNs);
            mBuffer.writeTraceToFile(mTraceFile, proto);//这里把mBuffer写入文件
        } catch (IOException e) {
            Log.e(TAG, "Unable to write buffer to file", e);
        } finally {
            Trace.traceEnd(Trace.TRACE_TAG_WINDOW_MANAGER);
        }
    }
mBuffer.writeTraceToFile写入的文件就是/data/misc/wmtrace/wm_trace.winscope.这个
https://mp.weixin.qq.com/s/QJCORrJQZS4daxDDlhe83A
更多framework技术干货,请关注下面“千里马学框架”


 被折叠的 条评论
为什么被折叠?
被折叠的 条评论
为什么被折叠?
 到【灌水乐园】发言


