


在遥感影像处理领域,植被指数的提取与分类是非常重要的环节,它可以帮助我们了解地表植被的分布和生长状况。本文将详细介绍如何使用 Python 对高空间分辨率影像和低空间分辨率多光谱数据进行处理,提取归一化植被指数(NDVI)并进行无监督分类。
1. 引言
在遥感领域,不同分辨率的影像具有不同的特点和用途。高空间分辨率影像可以提供更详细的地物信息,而低空间分辨率多光谱数据则包含了更多的光谱信息。将两者结合起来,可以更好地进行植被分析。本文将使用 Python 中的numpy、scipy、skimage、matplotlib和sklearn等库来完成这一任务。
2. 代码实现
2.1 导入必要的库
import numpy as np
import scipy.io
from skimage.transform import resize
import matplotlib.pyplot as plt
from sklearn.cluster import KMeans
这些库分别用于数值计算、数据加载、图像重采样、图像显示和聚类分析。
2.2 加载影像数据
# 加载高空间分辨率影像(假设为RGB影像,形状为(3210, 3219, 3))
high_res_img = scipy.io.loadmat(r'E:\WORK_SPACE\rgb_image.mat')['rgb_image']

# 加载低空间分辨率多光谱数据(形状为(350, 352, 18))
low_res_img = scipy.io.loadmat(r'E:\WORK_SPACE\sentinel_image1.mat')['sentinel_image']这里使用scipy.io.loadmat函数加载.mat格式的影像数据。(用你自己的数据和路径)
2.3 对低分辨率多光谱图像进行重采样
# 1. 对低分辨率多光谱图像进行重采样
resampled_low_res_img = resize(low_res_img, (high_res_img.shape[0], high_res_img.shape[1], low_res_img.shape[2]), mode='reflect', anti_aliasing=True)使用skimage.transform.resize函数将低分辨率多光谱图像重采样到与高分辨率影像相同的尺寸。
2.4 提取植被指数(NDVI)
# 2. 提取植被指数(例如NDVI)
# 假设NIR为第8波段,RED为第4波段(这取决于您所使用的波段信息,需根据实际数据选择)
nir_band = resampled_low_res_img[:, :, 7]  # 假设NIR波段是第8个波段
red_band = resampled_low_res_img[:, :, 3]  # 假设RED波段是第4个波段

# 计算NDVI
ndvi = (nir_band - red_band) / (nir_band + red_band)
根据近红外波段(NIR)和红光波段(RED)计算 NDVI。
2.5 基于 NDVI 值进行聚类(K-means)进行分类
# 3. 基于NDVI值进行聚类(如K-means)进行分类
# 将NDVI图像展开为一维数组,以便进行K-means聚类
ndvi_flat = ndvi.reshape(-1, 1)

# 使用K-means进行无监督分类
kmeans = KMeans(n_clusters=5, random_state=42)
ndvi_labels = kmeans.fit_predict(ndvi_flat)使用sklearn.cluster.KMeans对 NDVI 值进行聚类,将其分为 5 类。
2.6 将聚类结果恢复为图像空间
# 4. 将聚类结果恢复为图像空间
classified_ndvi_image = ndvi_labels.reshape(high_res_img.shape[0], high_res_img.shape[1])
将聚类结果重新转换为图像的二维形状。
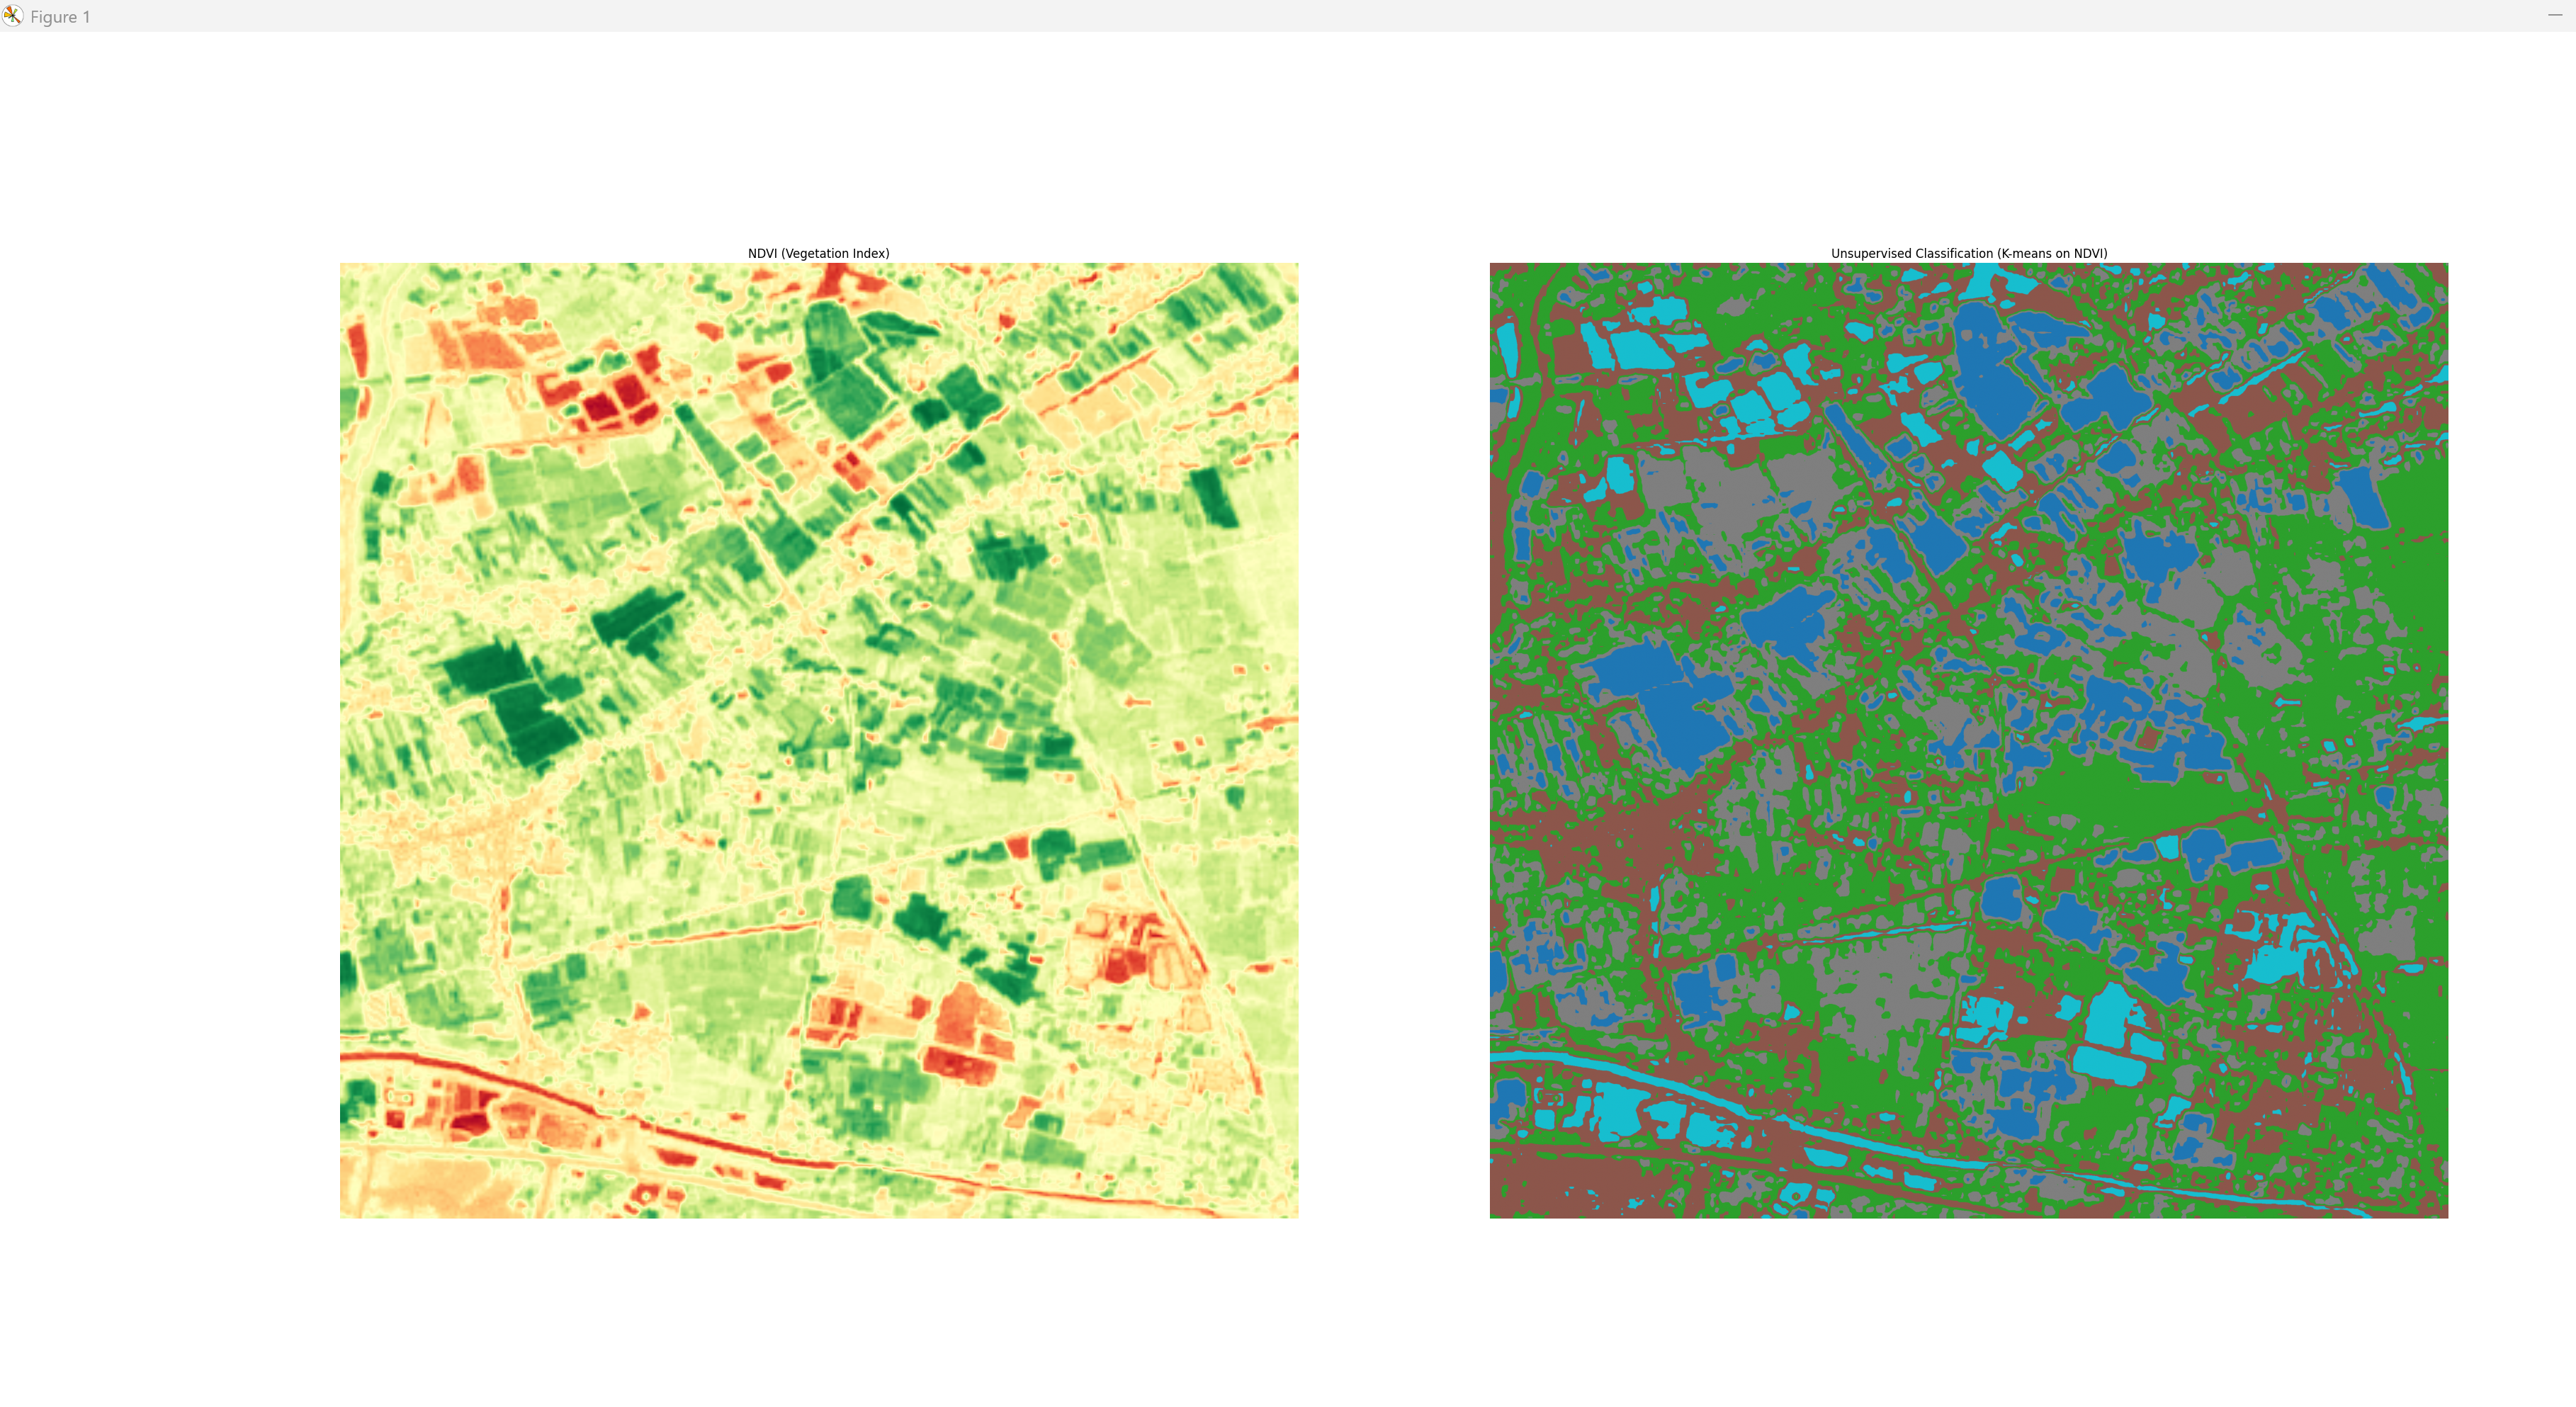
2.7 显示 NDVI 指数图像和分类结果
# 5. 显示NDVI指数图像和分类结果
plt.figure(figsize=(12, 6))

# 显示NDVI图像
plt.subplot(1, 2, 1)
plt.imshow(ndvi, cmap='RdYlGn')  # 使用NDVI常用的颜色映射
plt.title("NDVI (Vegetation Index)")
plt.axis('off')

# 显示K-means聚类结果
plt.subplot(1, 2, 2)
plt.imshow(classified_ndvi_image, cmap='tab10')
plt.title("Unsupervised Classification (K-means on NDVI)")
plt.axis('off')

plt.show(block=True)
3. 完整代码:
import numpy as np
import scipy.io
from skimage.transform import resize
import matplotlib.pyplot as plt
from sklearn.cluster import KMeans

# 加载高空间分辨率影像(假设为RGB影像,形状为(3210, 3219, 3))
high_res_img = scipy.io.loadmat(r'E:\WORK_SPACE\rgb_image.mat')['rgb_image']

# 加载低空间分辨率多光谱数据(形状为(350, 352, 18))
low_res_img = scipy.io.loadmat(r'E:\WORK_SPACE\sentinel_image1.mat')['sentinel_image']

# 1. 对低分辨率多光谱图像进行重采样
resampled_low_res_img = resize(low_res_img, (high_res_img.shape[0], high_res_img.shape[1], low_res_img.shape[2]), mode='reflect', anti_aliasing=True)

# 2. 提取植被指数(例如NDVI)
# 假设NIR为第8波段,RED为第4波段(这取决于您所使用的波段信息,需根据实际数据选择)
nir_band = resampled_low_res_img[:, :, 7]  # 假设NIR波段是第8个波段
red_band = resampled_low_res_img[:, :, 3]  # 假设RED波段是第4个波段

# 计算NDVI
ndvi = (nir_band - red_band) / (nir_band + red_band)

# 3. 基于NDVI值进行聚类(如K-means)进行分类
# 将NDVI图像展开为一维数组,以便进行K-means聚类
ndvi_flat = ndvi.reshape(-1, 1)

# 使用K-means进行无监督分类
kmeans = KMeans(n_clusters=5, random_state=42)
ndvi_labels = kmeans.fit_predict(ndvi_flat)

# 4. 将聚类结果恢复为图像空间
classified_ndvi_image = ndvi_labels.reshape(high_res_img.shape[0], high_res_img.shape[1])

# 5. 显示NDVI指数图像和分类结果
plt.figure(figsize=(12, 6))

# 显示NDVI图像
plt.subplot(1, 2, 1)
plt.imshow(ndvi, cmap='RdYlGn')  # 使用NDVI常用的颜色映射
plt.title("NDVI (Vegetation Index)")
plt.axis('off')

# 显示K-means聚类结果
plt.subplot(1, 2, 2)
plt.imshow(classified_ndvi_image, cmap='tab10')
plt.title("Unsupervised Classification (K-means on NDVI)")
plt.axis('off')

plt.show(block=True)
结果展示:


 4213
4213

 被折叠的 条评论
为什么被折叠?
被折叠的 条评论
为什么被折叠?
 到【灌水乐园】发言


