


web应用发送日志到logstash,logstash再同步到es,最后kibana展示
(1)控制台到logstash
用springboot自带的lagback做日志收集,添加logback-spring.xml:
<?xml version="1.0" encoding="UTF-8"?>
<configuration>
    <include resource="org/springframework/boot/logging/logback/base.xml" />

    <appender name="LOGSTASH" class="net.logstash.logback.appender.LogstashTcpSocketAppender">
        <!-- logstash ip和暴露的端口,logback就是通过这个地址把日志发送给logstash,5044端口一定要和下方logstash-spring.conf中input的端口一致 -->
        <destination>127.0.0.1:5044</destination>
        <!-- 日志输出格式 -->
        <encoder charset="UTF-8" class="net.logstash.logback.encoder.LogstashEncoder">
            <!-- 在elasticsearch的index中追加applicationName字段 -->
            <customFields>{"applicationName":"demo-test"}</customFields>
        </encoder>
    </appender>
    <logger name="org.apache.rocketmq" level="WARN"/>
    <!-- INFO日志输出到控制台和logstash -->
    <root level="INFO">
        <appender-ref ref="LOGSTASH" />
        <appender-ref ref="CONSOLE" />
    </root>
</configuration>
在application.properties添加配置:
#logstash相关
logging.config=classpath:logback-spring.xml
(2)logstash输出到es
在logstash的conf目录添加logstash-spring.conf:
# Sample Logstash configuration for creating a simple
# srping输入给logstash,logstash再输出到es
input {
  tcp {
	port => 5044
    codec => json_lines
  }
}

output {
  elasticsearch {
    hosts => ["127.0.0.1:9200"]
	index => "log-%{+YYYY_MM_dd}" # 设置 logstash同步到es的哪个索引,不存在该索引则新建,新建的索引中有个message字段专门存放从 logstash中同步过去的信息
  }
  stdout{ codec => rubydebug}  # 顺便输出日志到logstash控制台
}
新建的索引中含有的字段:
"level" : "INFO", #该条日志级别
"@version" : "1", #索引的版本
"message" : "closeChannel: close the connection to remote address[] result: true", #logstash传过来的信息
"applicationName" : "demo-test",#logback-spring.xml中设置了添加applicationName字段
"thread_name" : "NettyClientSelector_1", #线程名字
"level_value" : 20000,
"@timestamp" : "2023-09-12T07:36:26.902Z",
"port" : 64158,
"logger_name" : "RocketmqRemoting",
"host" : "127.0.0.1" #ip
(3)kibana展示es的日志
在kibana的conf目录下的kibana.yml设置监听获取es日志:
elasticsearch.hosts: ["http://localhost:9200"]
最后依次cmd启动ELK,spring应用打印info级别的日志会同时输出到控制台和logstash,然后logstash又会同步到es,然后打开kibana面板的discover页面直接搜(或者在dev tools页面用DSL语句查询)
设置ELK开机自启动
es启动的是bin目录下自带的elasticsearch.bat,kibana启动的是bin目录下自带的kibana.bat,logstash启动的是config目录下自定义的logstashstart.bat,其内容:
logstash -f D:\Users\Downloads\logstash-7.17.7\config\logstash-spring.conf
只要把这三个文件添加到服务开机自启动即可,参考nssm用法(https://www.cnblogs.com/weihengblogs/p/17031104.html、https://blog.csdn.net/muzihuaner/article/details/130538604)
logstash同步mysql数据到es,最后kibana展示
(1)数据库表结构
CREATE TABLE `country` (
  `country_id` smallint unsigned NOT NULL AUTO_INCREMENT,
  `country` varchar(50) NOT NULL,
  `last_update` datetime NOT NULL DEFAULT CURRENT_TIMESTAMP ON UPDATE CURRENT_TIMESTAMP,
  `created_date` datetime DEFAULT NULL,
  PRIMARY KEY (`country_id`)
) ENGINE=InnoDB AUTO_INCREMENT=113 DEFAULT CHARSET=utf8mb4 COLLATE=utf8mb4_0900_ai_ci;
(2)添加es索引
PUT /demo-test-country_2023_09
{
  "mappings": {
    "properties": {
      "countryId":{
        "type": "keyword"
      },
      "country":{
        "type": "text"
      },
       "lastUpdate":{
        "type": "date",
         "format": "yyyy-MM-dd HH:mm:ss"
      },
      "createdDate":{
        "type": "date",
        "format": "yyyy-MM-dd HH:mm:ss"
      }
    }
  }
}
(3)logstash的config目录增加logstash-mysql.conf配置文件
# Sample Logstash configuration for creating a simple
# mysql输出到es
input {
	stdin {}
	jdbc {
	    #给当前的jdbc命名
		type => "jdbc"
		 # 数据库连接地址
		jdbc_connection_string => "jdbc:mysql://127.0.0.1:3306/sakila?serverTimezone=GMT%2b8&characterEncoding=UTF-8&autoReconnect=true"
		 # 数据库连接账号密码;
		jdbc_user => "root"
		jdbc_password => "****"
		 # MySQL依赖包路径;
		jdbc_driver_library => ".\mysql-connector-java-8.0.22.jar"
		 # the name of the driver class for mysql
		jdbc_driver_class => "com.mysql.cj.jdbc.Driver"
		 # 数据库重连尝试次数
		connection_retry_attempts => "3"
		 # 判断数据库连接是否可用,默认false不开启
		jdbc_validate_connection => "true"
		 # 数据库连接可用校验超时时间,默认3600S
		jdbc_validation_timeout => "3600"
		 # 开启分页查询(默认false不开启);
		jdbc_paging_enabled => "true"
		 # 单次分页查询条数(默认100000,若字段较多且更新频率较高,建议调低此值);
		jdbc_page_size => "500"
		 # statement为查询数据sql,如果sql较复杂,建议配通过statement_filepath配置sql文件的存放路径;
		 # sql_last_value为内置的变量,存放上次查询结果中最后一条数据的createdDate值;
		 # statement_filepath => "mysql/jdbc.sql"
		statement =>"select c.country_id as countryId,c.country as country,DATE_FORMAT(c.last_update,'%Y-%m-%d %H:%i:%s') as lastUpdate,DATE_FORMAT(c.created_date,'%Y-%m-%d %H:%i:%s') as createdDate from country c where DATE_FORMAT(c.created_date,'%Y-%m-%d %H:%i:%s') >= DATE_FORMAT(:sql_last_value,'%Y-%m-%d %H:%i:%s') order by c.created_date"
		 # 是否将字段名转换为小写,默认true(如果有数据序列化、反序列化需求,建议改为false);
		lowercase_column_names => false
		 # Value can be any of: fatal,error,warn,info,debug,默认info;
		sql_log_level => warn
		 #
		 # 是否记录上次执行结果,true表示会将上次执行结果"createdDate"字段的值保存到last_run_metadata_path指定的文件中;
		record_last_run => true
		 # record_last_run上次数据"createdDate"的存放位置;
        last_run_metadata_path => "D:\Users\Downloads\logstash-7.17.7\config\createdDate.txt"
		 # 需要记录查询结果某字段的值时,此字段为true,不配置的话默认createdDate为timestamp的值;
		use_column_value => true
		 # 需要记录的字段,用于增量同步,是查询语句中结果显示字段
		tracking_column => "createdDate"
		 # Value can be any of: numeric,timestamp,Default value is "numeric"
		tracking_column_type => timestamp
		 # 是否清除last_run_metadata_path的记录,需要增量同步时此字段必须为false;
		clean_run => false
		 #
		 # 同步频率(秒 分 时 天 月 年),每分钟同步一次:“* * * * *”,每30秒同步一次:"*/30 * * * * *"
		schedule => "*/30 * * * * *"
	}
}


output {
	elasticsearch {
		 # 配置ES集群地址
		hosts => ["127.0.0.1:9200"]
		 # 索引名字,必须小写
		index => "demo-test-country_%{+YYYY_MM}"
		 # 数据唯一索引(建议使用数据库主键字段)
		document_id => "%{countryId}"
	}
	stdout {
		codec => json_lines
	}
}
(4)启动ELK
依次启动ELK,启动logstash:
## logstash的bin目录
logstash -f ..\config\logstash-mysql.conf
然后通过api接口往数据库插入数据,
postman:
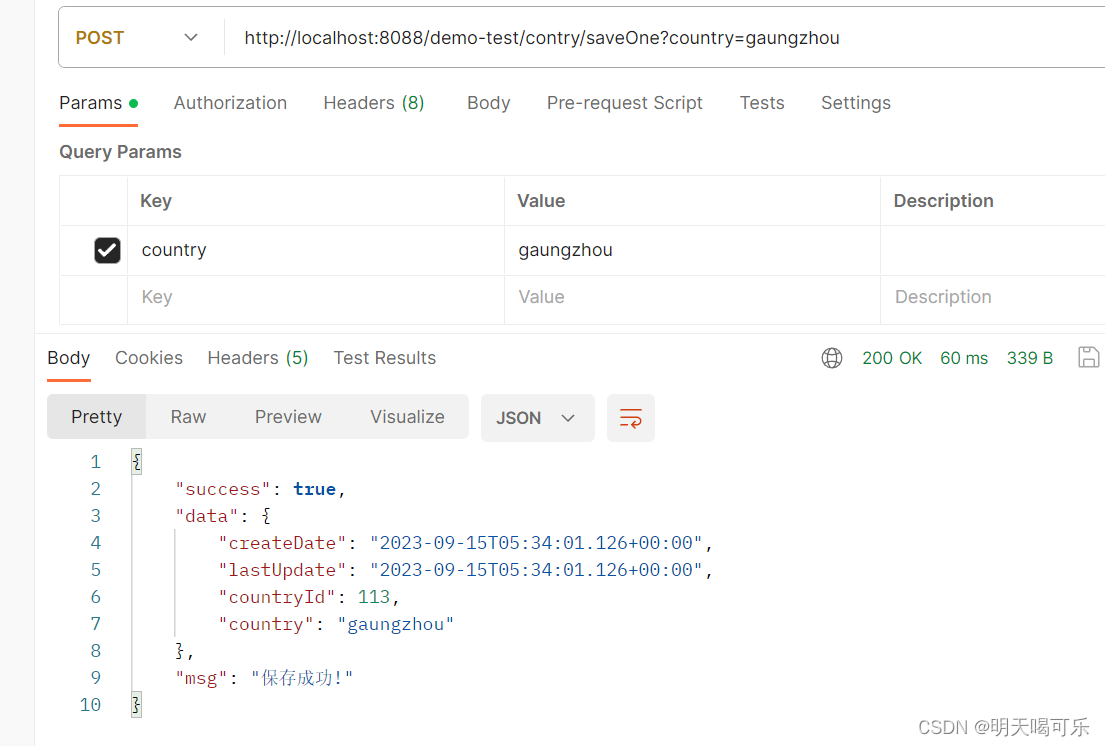
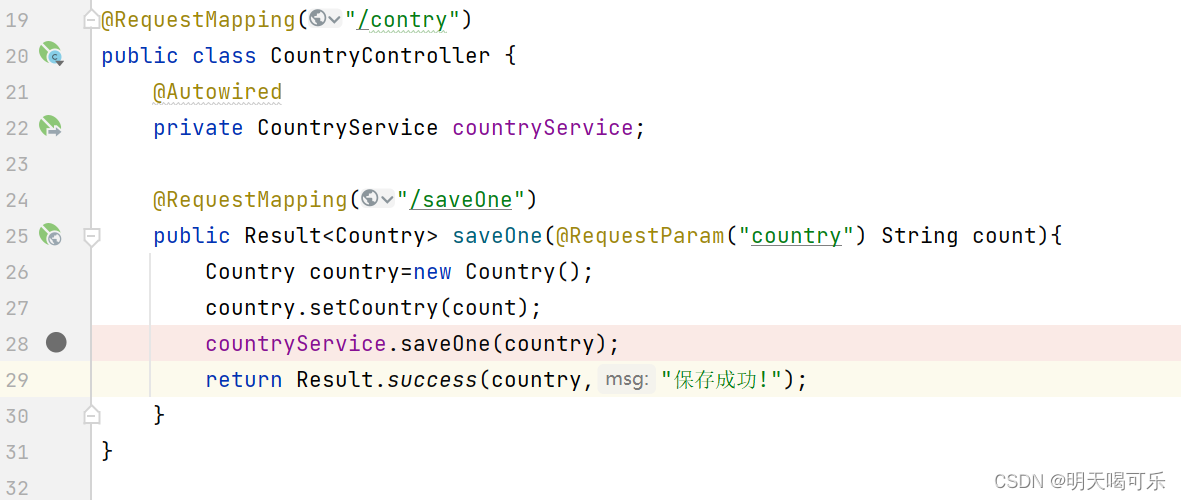
api:
mysql:

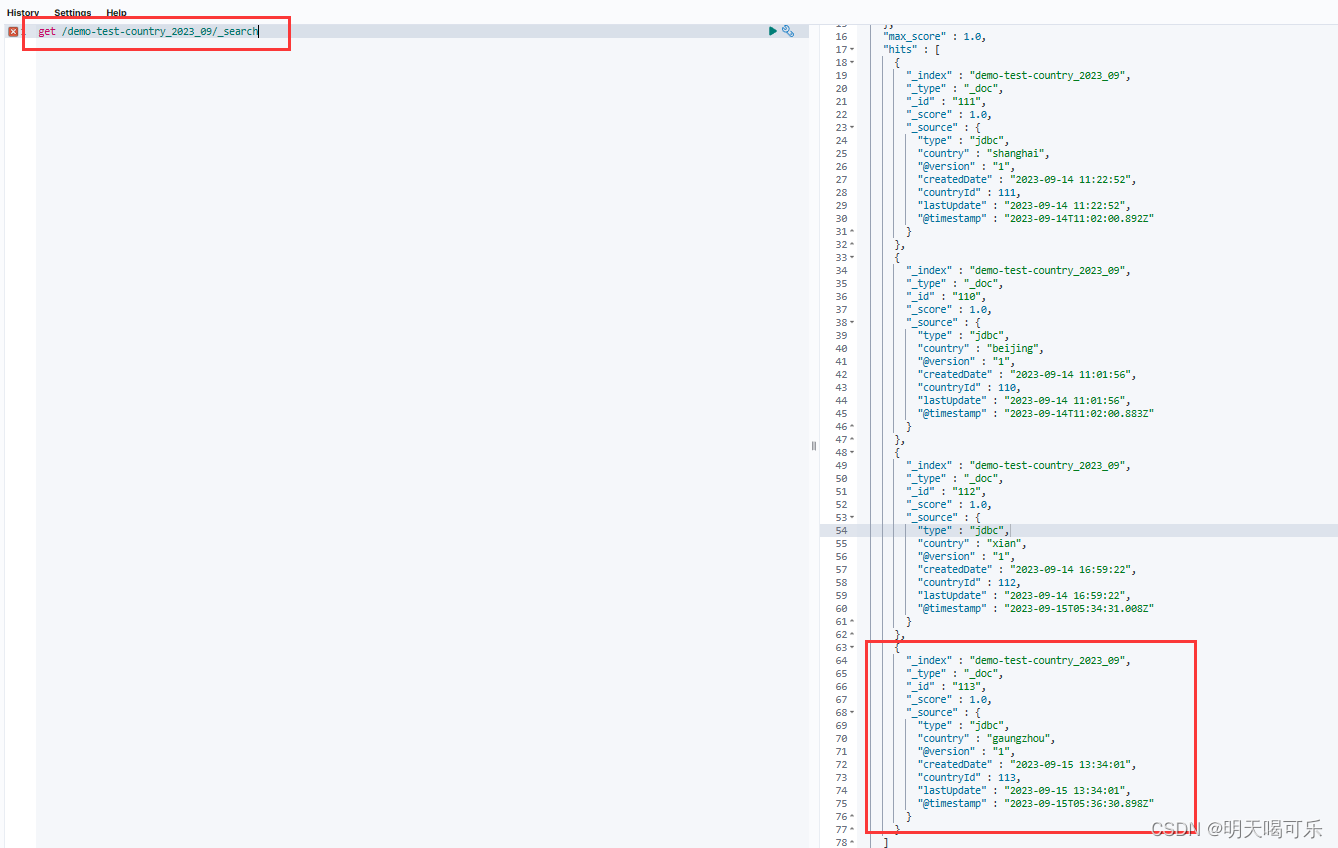
每隔30s从mysql同步到es,每次同步都根据last_run_metadata_path指定的文件中保存的上一次同步最后一条数据的createdDate值,来进行下一次同步:
logstash同时同步spring应用日志和mysql数据到es,最后kibana展示
config目录下新增一个logstash-spring_mysql.conf文件,配置的内容就是把同步mysql和spring日志的脚本合并,然后input中增加"type"字段,output中再用"type"字段输出到不同的索引:
# Sample Logstash configuration for creating a simple
# srping输入给logstash,logstash再输出到es
input {
  tcp {
    type => "spring"
	port => 5044
    codec => json_lines
  }

  jdbc {
  	    #给当前的jdbc命名
  		type => "mysql"
  		 # 数据库连接地址
  		jdbc_connection_string => "jdbc:mysql://127.0.0.1:3306/sakila?serverTimezone=GMT%2b8&characterEncoding=UTF-8&autoReconnect=true"
  		 # 数据库连接账号密码;
  		jdbc_user => "root"
  		jdbc_password => "tiger"
  		 # MySQL依赖包路径;
  		jdbc_driver_library => "D:\Users\liaozhifei\Downloads\apache-maven-3.8.4-bin\repository\mysql\mysql-connector-java\8.0.22\mysql-connector-java-8.0.22.jar"
  		 # the name of the driver class for mysql
  		jdbc_driver_class => "com.mysql.cj.jdbc.Driver"
  		 # 数据库重连尝试次数
  		connection_retry_attempts => "3"
  		 # 判断数据库连接是否可用,默认false不开启
  		jdbc_validate_connection => "true"
  		 # 数据库连接可用校验超时时间,默认3600S
  		jdbc_validation_timeout => "3600"
  		 # 开启分页查询(默认false不开启);
  		jdbc_paging_enabled => "true"
  		 # 单次分页查询条数(默认100000,若字段较多且更新频率较高,建议调低此值);
  		jdbc_page_size => "500"
  		 # statement为查询数据sql,如果sql较复杂,建议配通过statement_filepath配置sql文件的存放路径;
  		 # sql_last_value为内置的变量,存放上次查询结果中最后一条数据tracking_column的值,此处即为ModifyTime;
  		 # statement_filepath => "mysql/jdbc.sql"
  		statement =>"select c.country_id as countryId,c.country as country,DATE_FORMAT(c.last_update,'%Y-%m-%d %H:%i:%s') as lastUpdate,DATE_FORMAT(c.created_date,'%Y-%m-%d %H:%i:%s') as createdDate from country c where DATE_FORMAT(c.created_date,'%Y-%m-%d %H:%i:%s') >= DATE_FORMAT(:sql_last_value,'%Y-%m-%d %H:%i:%s') order by c.created_date"
  		 # 是否将字段名转换为小写,默认true(如果有数据序列化、反序列化需求,建议改为false);
  		lowercase_column_names => false
  		 # Value can be any of: fatal,error,warn,info,debug,默认info;
  		sql_log_level => warn
  		 #
  		 # 是否记录上次执行结果,true表示会将上次执行结果的tracking_column字段的值保存到last_run_metadata_path指定的文件中;
  		record_last_run => true
  		 # record_last_run上次数据存放位置;
          last_run_metadata_path => "D:\Users\liaozhifei\Downloads\logstash-7.17.7\config\createdDate.txt"
  		 # 需要记录查询结果某字段的值时,此字段为true,否则默认tracking_column为timestamp的值;
  		use_column_value => true
  		 # 需要记录的字段,用于增量同步,是查询语句中结果显示字段
  		tracking_column => "createdDate"
  		 # Value can be any of: numeric,timestamp,Default value is "numeric"
  		tracking_column_type => timestamp
  		 # 是否清除last_run_metadata_path的记录,需要增量同步时此字段必须为false;
  		clean_run => false
  		 #
  		 # 同步频率(秒 分 时 天 月 年),每分钟同步一次:“* * * * *”,每30秒同步一次:"*/30 * * * * *"
  		schedule => "*/30 * * * * *"
  	}
}

output {
    if [type]=="spring" {
          elasticsearch {
            hosts => ["127.0.0.1:9200"]
            index => "demo-test-log_%{+YYYY_MM}"
          }
          stdout{ codec => rubydebug}  # 顺便输出日志到logstash控制台
    }
    if [type]=="mysql" {
        elasticsearch {
    		 # 配置ES集群地址
    		hosts => ["127.0.0.1:9200"]
    		 # 索引名字,必须小写
    		index => "demo-test-country_%{+YYYY_MM}"
    		 # 数据唯一索引(建议使用数据库主键字段)
    		document_id => "%{countryId}"
    	}
    	stdout {
    		codec => json_lines
    	}

    }
}
依次启动ELK,启动logstash:
## logstash的bin目录
logstash -f ..\config\logstash-spring_mysql.conf.conf
可以把ELK设置为开机自启动,这样就能定时同步日志了


 1798
1798


 被折叠的 条评论
为什么被折叠?
被折叠的 条评论
为什么被折叠?
 到【灌水乐园】发言


