


目录
matplotlib.pyplot.plot的color参数设置线条颜色
一、线条属性
- color 颜色
- linestyle 样式
- linewidth 宽度
- alpha 透明度
- marker 标记
- mfc: marker face color 标记的背景颜色
matplotlib.pyplot.plot的color参数设置线条颜色
- 通用颜色
设定值 说明 设定值 说明 b 蓝色 m 洋红色 g 绿色 y 黄色 r 红色 k 黑色 c 蓝绿色 w 白色 #FFFF00 黄色 0.5 灰度值字符串 - 其他颜色
- 浮点形式的RGB或RGBA元组
- 十六进制的RGB或RGBA字符串
- 0-1之间的小数作为的灰度值
- {'b','g','r','c', 'm';'y ','k','w'}其中任取
- X11/CSS4中规定的颜色名称
- Xkcd中指定的颜色名称
- Tableau调色板中的颜色{'tab:blue','tab:orange'}
- CN格式的颜色循环
二、常用函数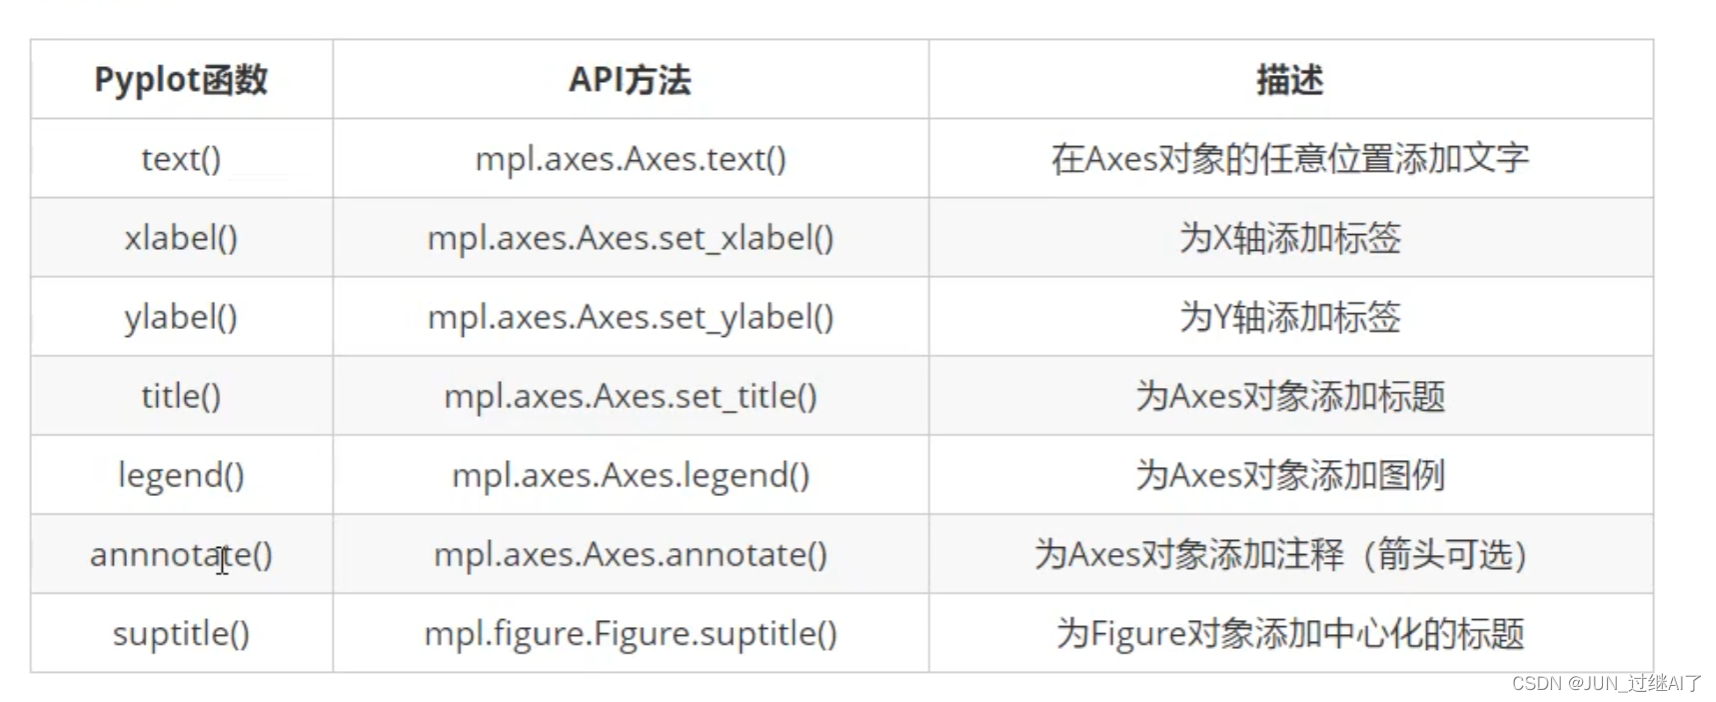
图例:legend
法一:
# 导入numpy和matplotlib.pyplot两个库
import numpy as np
import matplotlib.pyplot as plt

# 创建一个大小为6x4的图形窗口
plt.figure(figsize=(6,4))

# 生成0到2π之间的等间距数值作为x轴数据
x = np.linspace(0,2*np.pi)

# 绘制sin函数曲线,并设置标签为'sin'
plt.plot(x,np.sin(x), label='sin')

# 绘制cos函数曲线,并设置标签为'cos'
plt.plot(x, np.cos(x), label='cos')

# 添加图例
plt.legend()

# 显示图形
plt.show()
该代码绘制了两个函数的曲线,其中一个是sin函数(np.sin(x)),另一个是cos函数(np.cos(x))。使用label参数为每条曲线设置标签。然后,通过plt.legend()添加图例,图例会显示出每条曲线对应的标签。最后使用plt.show()显示图形。
法二:
# 导入numpy和matplotlib.pyplot两个库
import numpy as np
import matplotlib.pyplot as plt

# 创建一个大小为6x4的图形窗口
plt.figure(figsize=(6,4))

# 生成0到2π之间的等间距数值作为x轴数据
x = np.linspace(0,2*np.pi)

# 绘制sin函数曲线,并设置标签为'sin'
plt.plot(x,np.sin(x))

# 绘制cos函数曲线,并设置标签为'cos'
plt.plot(x, np.cos(x))

# 添加图例
plt. legend(['sin','cos'])

# 显示图形
plt.show()
效果图: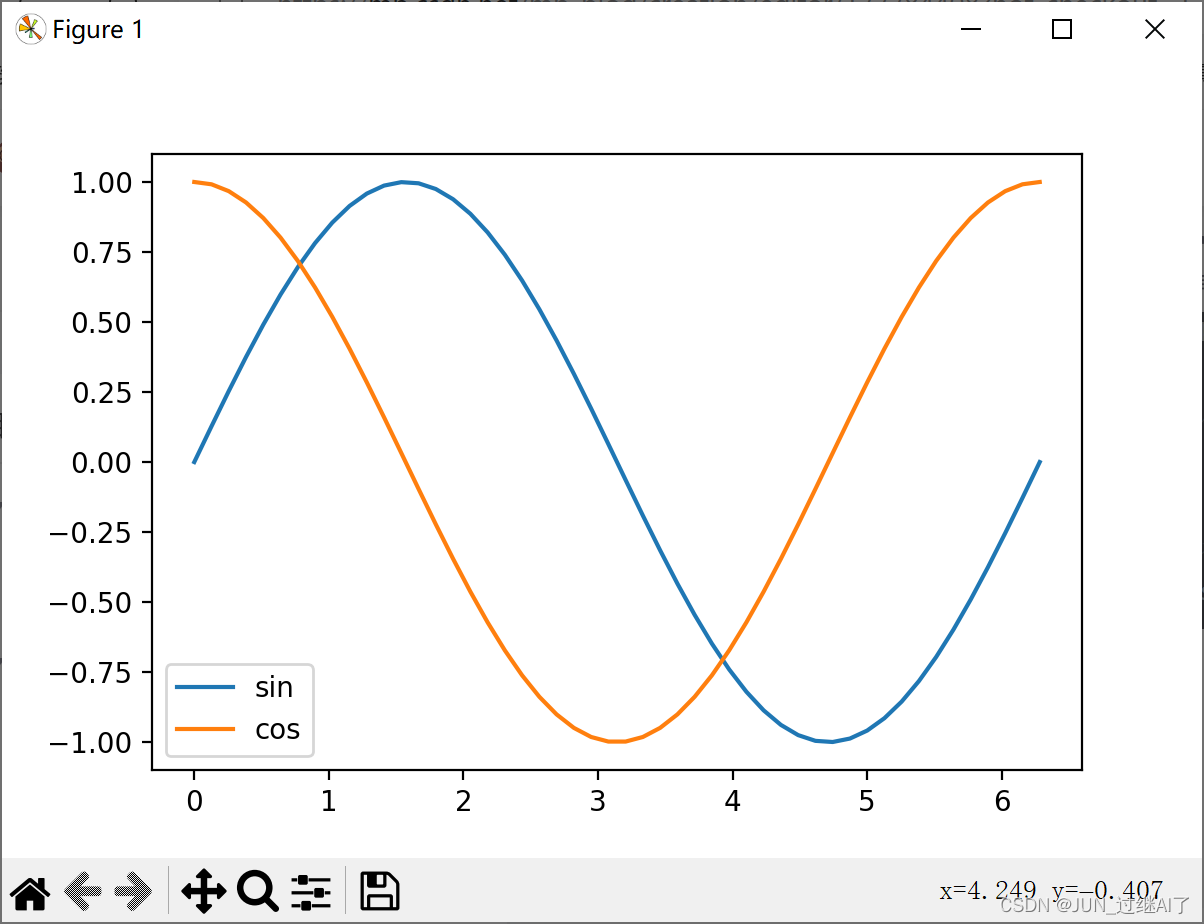
三、坐标轴刻度
- xticks
- yticks
# 设置x轴刻度值为0到10,步长为1
plt.xticks(np.arange(0, 11, 1))

# 设置y轴刻度值为-1、0、1
plt.yticks([-1, 0, 1])

# 显示图形
plt.show()
该代码通过plt.xticks()函数设置x轴刻度值,np.arange(0, 11, 1)表示从0到10之间以步长为1的方式生成刻度值。同时,通过plt.yticks()函数设置y轴刻度值为-1、0和1。最后使用plt.show()显示图形。
效果图
进阶:
# 设置图形窗口大小为5x3
plt.figure(figsize=(5, 3))

# 生成0到10之间的等间距数值作为x轴数据
x = np.linspace(0, 10)

# 根据x轴数据生成对应的sin值作为y轴数据
y = np.sin(x)

# 绘制曲线
plt.plot(x, y)

# 设置x轴刻度值为0、11、1,字体大小为20,颜色为红色
plt.xticks(ticks=(0, 11, 1), fontsize=20, c='r')

# 设置y轴刻度值为-1、0、1,刻度标签分别为'min'、'0'、'max',字体大小为20,颜色为蓝色,对齐方式为右对齐
plt.yticks(ticks=[-1, 0, 1], labels=['min', '0', 'max'], fontsize=20, c='b', ha='right')

# 显示图形
plt.show()
该代码设置了图形窗口的大小为5x3。然后使用np.linspace()生成0到10之间的等间距数值作为x轴数据,根据x轴数据计算相应的sin值作为y轴数据。接下来调用plt.plot()绘制曲线。
通过plt.xticks()设置x轴刻度值,参数ticks=(0, 11, 1)表示刻度值为0、11、1;fontsize=20设置刻度文本的字体大小为20;c='r'设置刻度文本的颜色为红色。
通过plt.yticks()设置y轴刻度值,参数ticks=[-1, 0, 1]表示刻度值为-1、0、1;labels=['min', '0', 'max']设置刻度文本分别为'min'、'0'、'max';fontsize=20设置刻度文本的字体大小为20;c='b'设置刻度文本的颜色为蓝色;ha='right'设置刻度文本右对齐。
最后使用plt.show()显示图形。
效果图: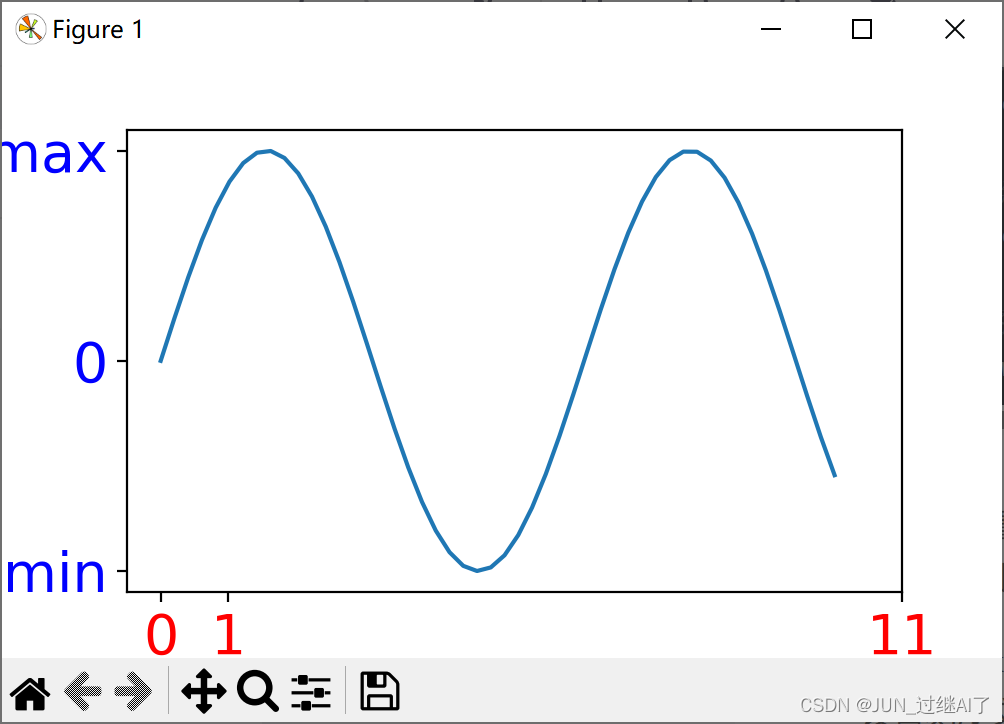


 332
332


 被折叠的 条评论
为什么被折叠?
被折叠的 条评论
为什么被折叠?
 到【灌水乐园】发言


