


1. 概述
由于Spring Cloud Sleuth最新版本只支持Spring Boot 2.7.x,核心项目已经迁移到Micrometer Traceing项目,Spring Boot 3.x版本要实现分布式链路追踪需要集成Micrometer。更多详情可以参阅Micrometer官网
本文将以Spring Boot 3.2.x和Spring Cloud 2023.0.x版本和JDK 17实现分布式链路追踪,有需要了解Spring Boot 2.7.x版本实现分布式链路追踪的小伙伴可以参阅SpringCloud搭建微服务之Sleuth分布式请求链路跟踪
2. 搭建搭建Zipkin Server
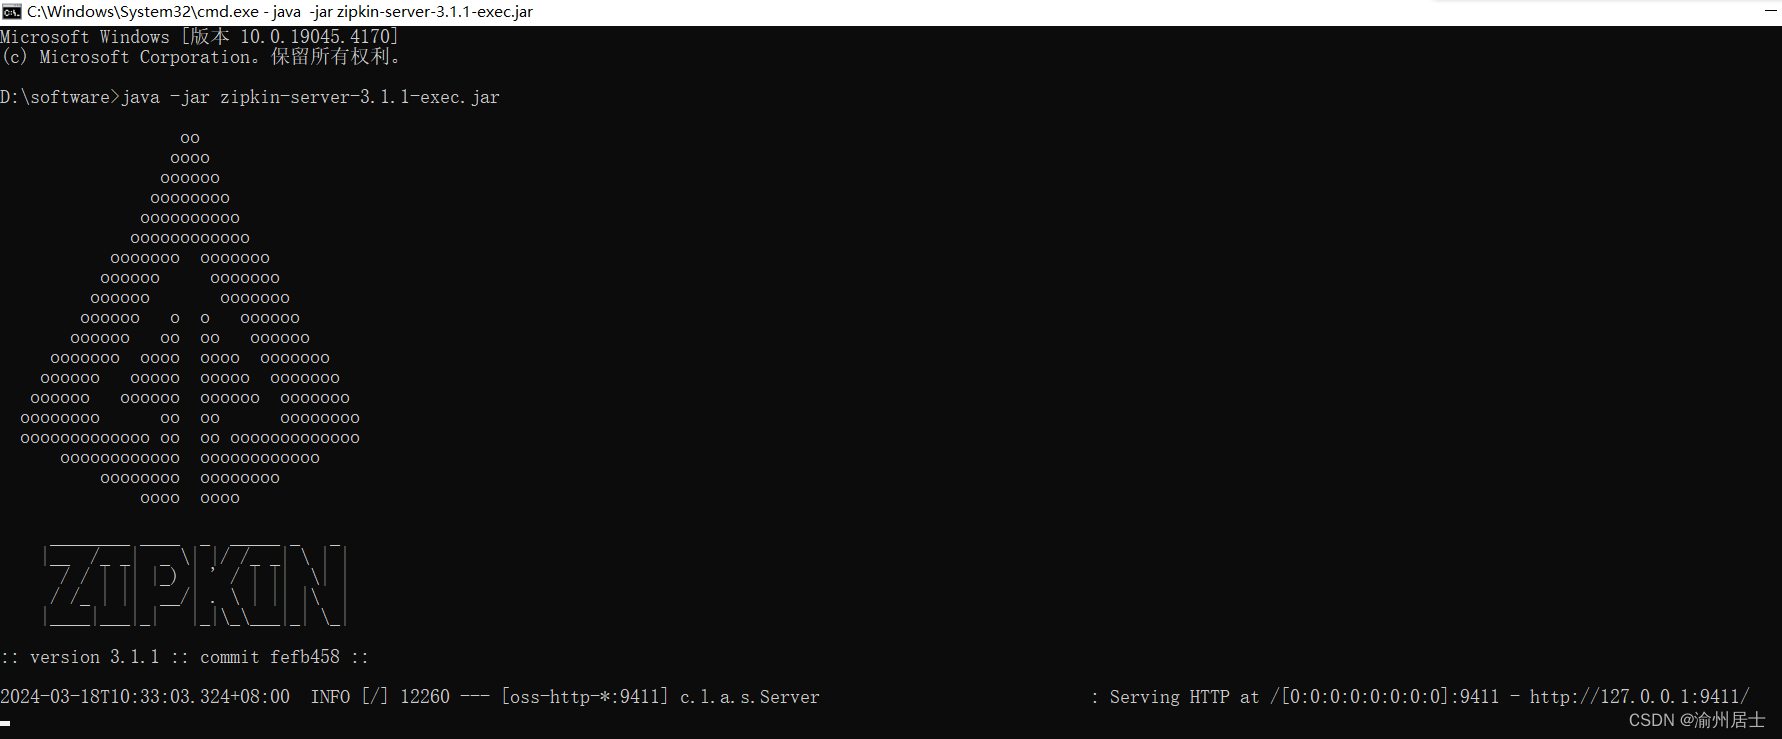
SpringCloud搭建微服务之Sleuth分布式请求链路跟踪这篇文章第二部分已经详细介绍了如何下载zipkin jar包和安装的步骤,新的版本下载就不再赘述,需要注意的是,最新版zipkin需要本地安装JDK 17。下载后,使用命令java -jar zipkin-server-3.1.1-exec.jar启动zipkin server即可
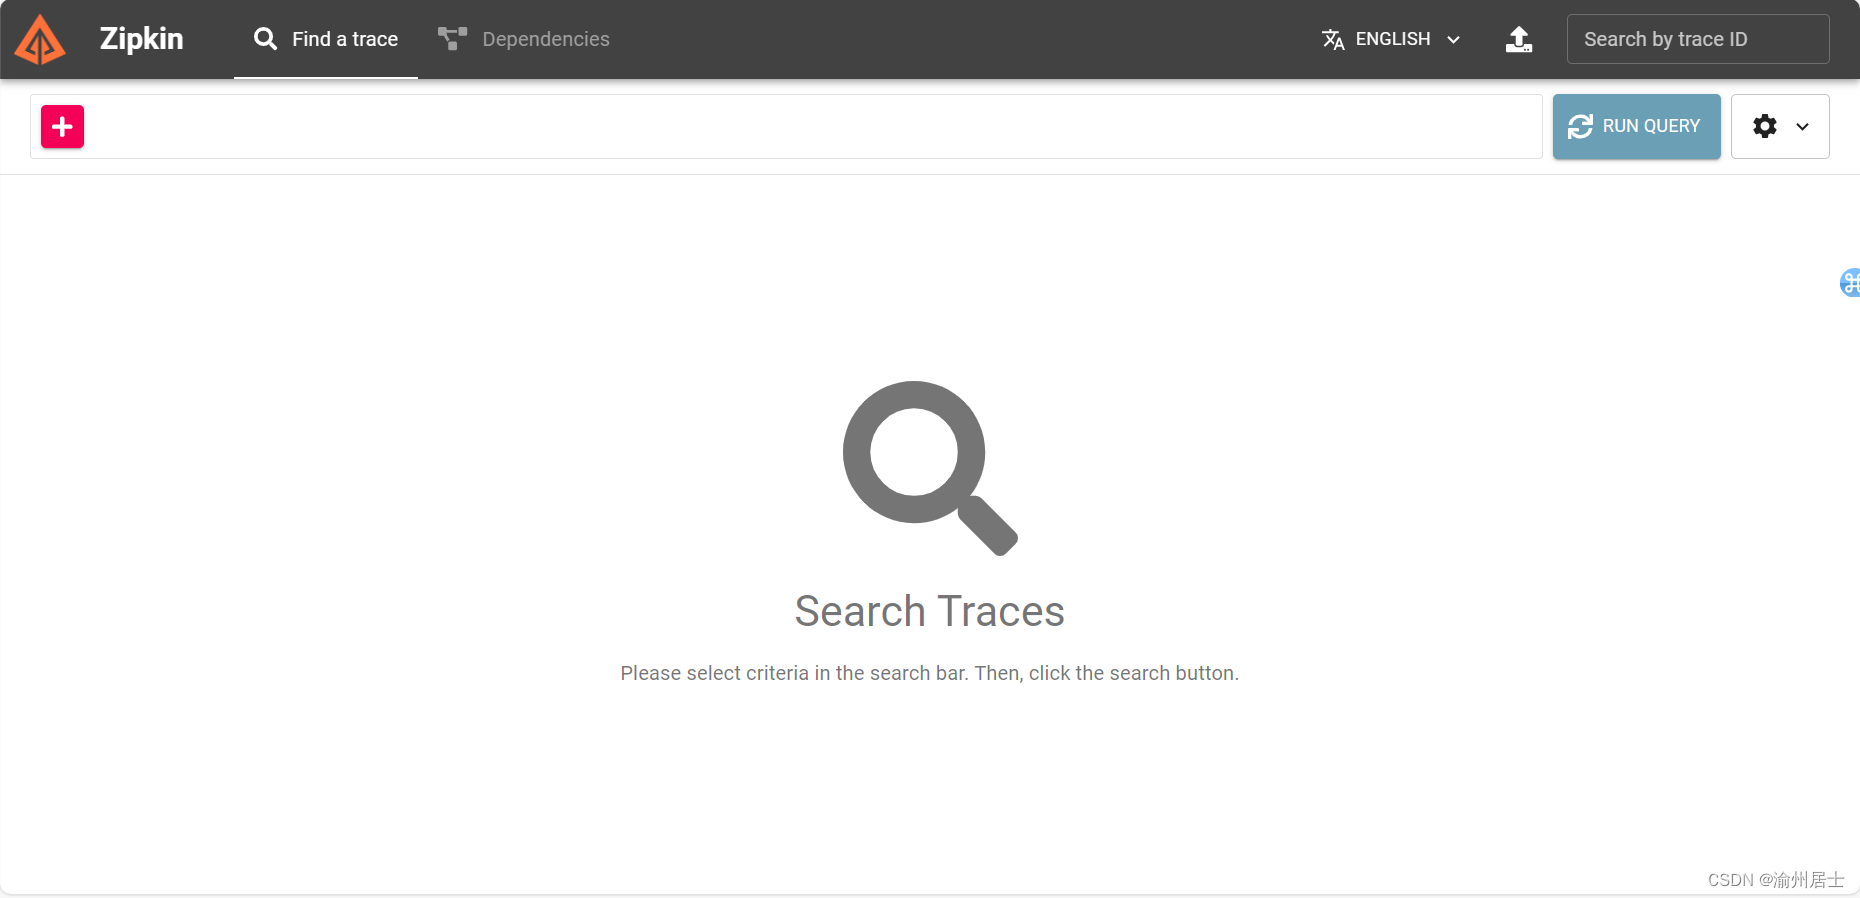
启动zipkin server后,在浏览器输入http://localhost:9411/zipkin进入zipkin首页
3. 微服务集成Micrometer
3.1. 引入核心依赖
在服务提供端和服务消费端都引如以下依赖
<dependency>
    <groupId>org.springframework.boot</groupId>
    <artifactId>spring-boot-starter-actuator</artifactId>
</dependency>
<!--指标追踪-->
<dependency>
    <groupId>io.micrometer</groupId>
    <artifactId>micrometer-tracing</artifactId>
</dependency>
<!--适配zipkin的桥接包-->
<dependency>
    <groupId>io.micrometer</groupId>
    <artifactId>micrometer-tracing-bridge-brave</artifactId>
</dependency>
<dependency>
    <groupId>io.micrometer</groupId>
    <artifactId>micrometer-observation</artifactId>
</dependency>
<dependency>
    <groupId>io.github.openfeign</groupId>
    <artifactId>feign-micrometer</artifactId>
</dependency>
<dependency>
    <groupId>io.zipkin.reporter2</groupId>
    <artifactId>zipkin-reporter-brave</artifactId>
</dependency>
3.2. 编写application.yml
management:
  zipkin:
    tracing:
      endpoint: http://localhost:9411/api/v2/spans
  tracing:
    sampling:
      probability: 1.0 #采样率默认0.1(10次只能有一次被记录),值越大手机越及时
4. 验证
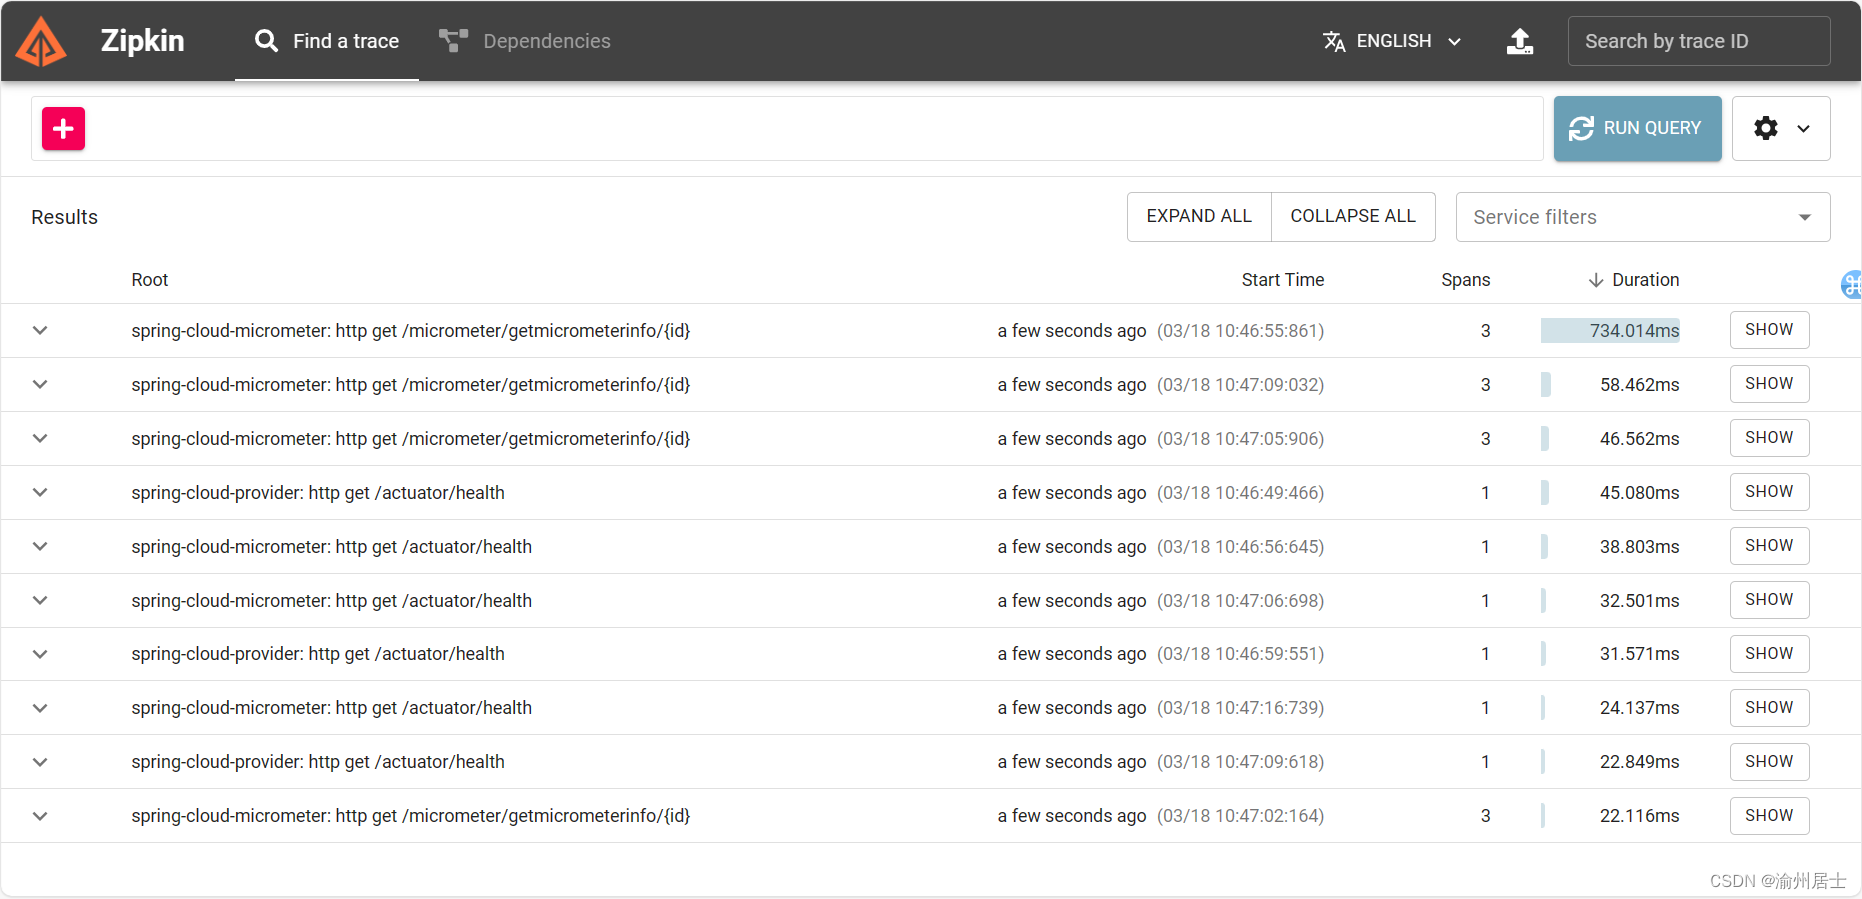
分别启动服务提供端和服务消费端微服务
刷新zipkin管理端,可以看到调用请求
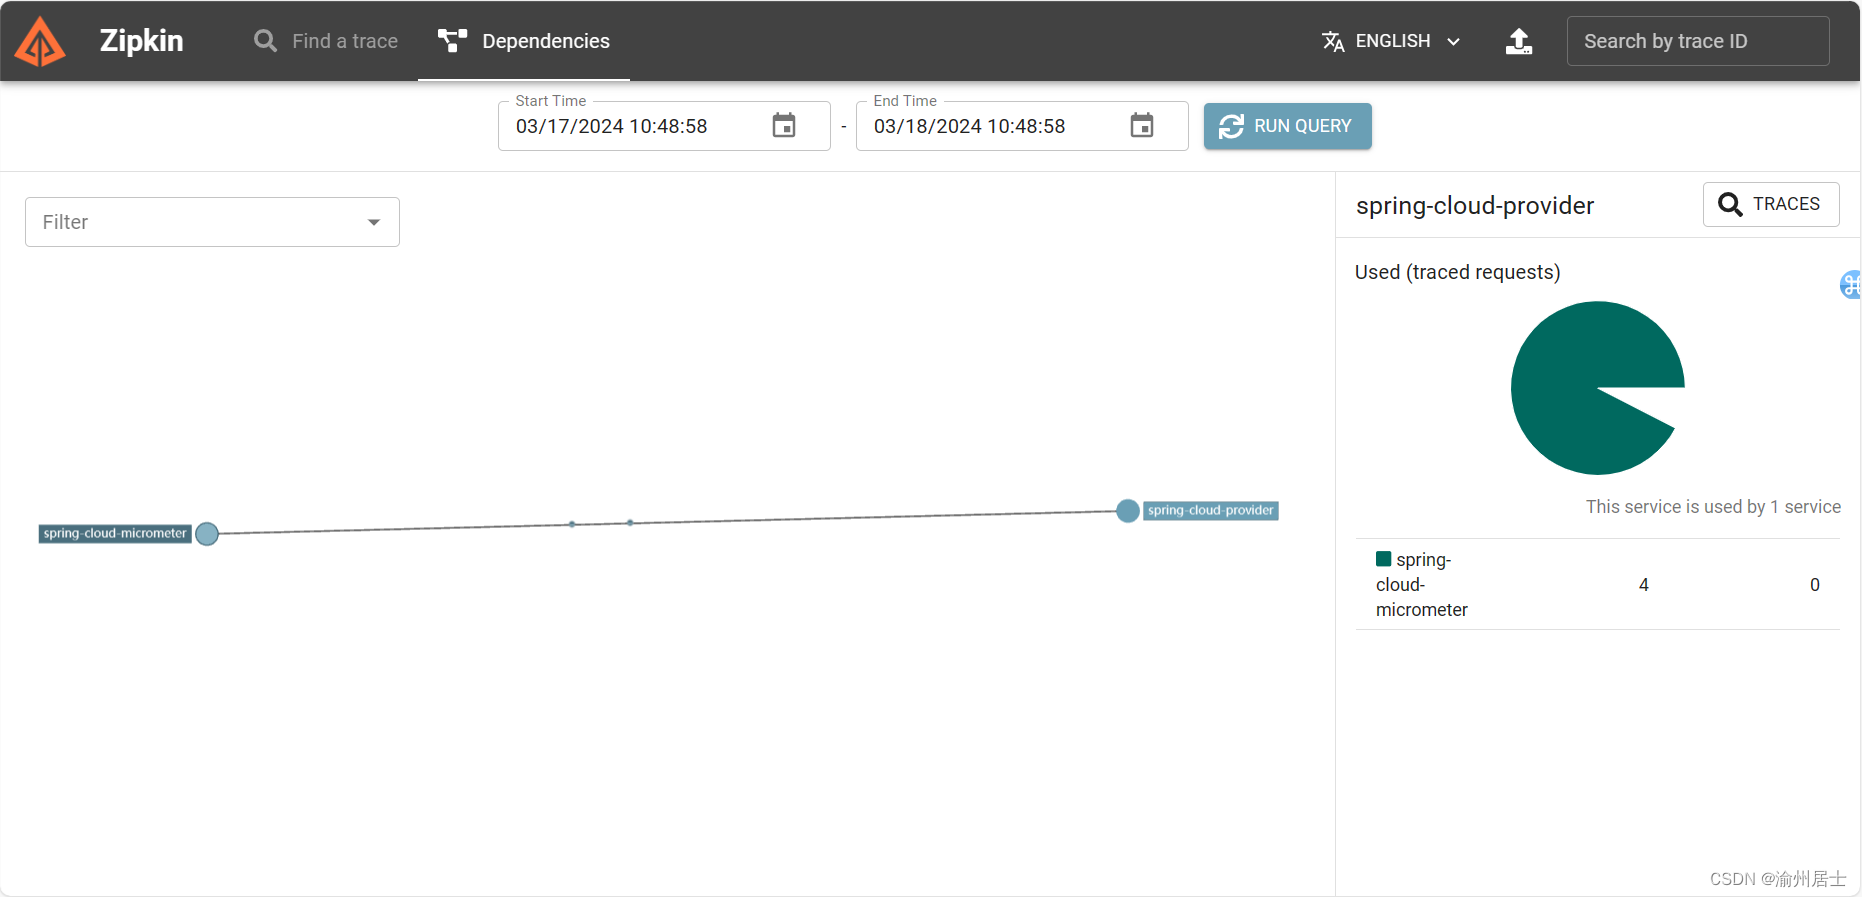
点击Dependencies,可以查看调用链路


 1363
1363


 被折叠的 条评论
为什么被折叠?
被折叠的 条评论
为什么被折叠?
 到【灌水乐园】发言


